![]()
14. Building A Machine Learning Model from Scratch¶
本章開始進入機器學習(Machine Learning)的領域,使用公開資料集來介紹如何運用 Python 的工具實現機器學習。 一開始會先只用基本工具來從頭建構一個機器學習的演算法,所以在學習本章節的內容前,需要先熟悉 Python 的基本容器、Numpy ndarray、 Pandas DataFrame 和 Series 的操作、以及 Matplotlib 的繪圖工具。 有了自己動手從頭建構演算法的經驗後,接著會介紹 Scikit-Learn 套件所提供的機器學習工具。
| 工具函式庫套件 | 網址 |
|---|---|
numpy |
numpy.org |
pandas |
pandas.pydata.org |
matplotlib |
matplotlib.org |
scikit-learn |
scikit-learn.org |
14.1 機器學習的基本認識¶
一般而言,機器學習關心的是要如何從已知的資料中,建構一個可以用來預測未知資料特性的模型。 執行學習的任務使用電腦系統的演算法來*自動發現數據的規律性*,稱為模式識別(Pattern Recognition)。 所以機器學習演算法的設計,所關心的是如何識別資料中隱含的模式來作推論,而不是明確指示推論的邏輯。
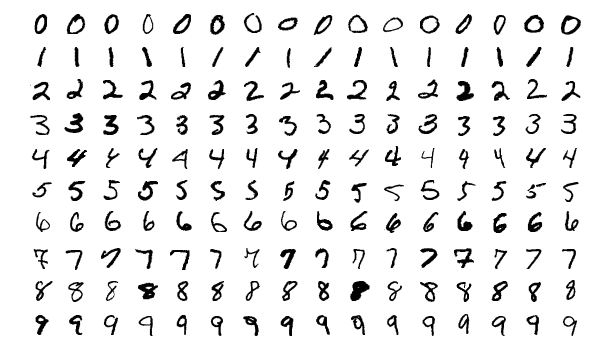
以著名的 MNIST 手寫辯識資料庫為例。每一個數字是 28x28 個像素的影像,也就是要從 784 個實數的向量資料中,辨識出所代表的 0, 1, 2, ..., 9 的正確數字。 要達到接近人類辨識的正確率,用手工打造(hand-engineering)辨識的特徵及規則非常的困難。 透過機器學習的方法可以取得比手工打造規則還要好的結果,甚至於超越人類辨識的正確率。
常見的 監督式學習(supervised learning) 手法,使用帶有正確答案且數量夠大的資料集 X 來調整匹配模型的參數,這個資料集稱為 訓練集(training set)。 每筆資料(影像)的類別(數字)都已經事先知道,並且在資料集裡都有對應欄位作標籤註記正確答案(例如標註是0-9其中某個數字),我們稱為標籤向量或目標向量 Y。 所執行的機器學習演算法可以表示為學習一個複雜函數的對應關係。
Y=f(X)確切的 f(X) 函數模型則是透過 訓練(training) 的過程來決定,這個過程也稱為 學習(learning)。 模型經過訓練後可以用來 推論(inference) 判斷訓練過程沒見過的新資料,稱為 測試集(test set),足以正確判斷分類新資料的能力稱為 泛化(generalization),設計具備足夠泛化能力的演算法就是機器學習的主要目標。
監督式學習中,根據學習目標數據的特質有不同的解決手法。 常見的術語,例如從手寫數字的影像辨識成有限數量的 0 到 9 的數字類別,這樣的問題稱為 分類(classification) 問題,由於是分辨多個類別的其中一種,又叫 多元分類(multiclass classification)。 如果是醫學中常見的區分有病(positive)、沒病(negative)的推斷,稱為 二元分類(binary classification)。 現實中另外還常見有一種輸入帶有多種類別標籤的數據,例如電影的分類,某部片可能同時有家庭、科幻、動作、史詩、愛情片,這種稱為 multi-label calssification。 假如問題輸出的目標包含一個或多個連續數值的變量,則稱為 回歸(regression)。
另外有一種 非監督式學習(unsupervised learning) 的方式,使用的訓練集資料沒有包含任何對應的目標向量,而學習的目標則是從資料集中探索如何將類似的觀察資料分門別類,稱為 聚類(clustering)。
# 預載入必要模組與環境設定
%matplotlib inline
import matplotlib.pyplot as plt
plt.style.use('seaborn-darkgrid')

import numpy as np
import pandas as pd
# 輔助圖片顯示及嵌入 notebook
from IPython.display import Image
14.2 二元分類案例 — 乳癌檢測¶
§ Breast Cancer Wisconsin 資料集¶
資料來源是公開的乳癌資料集 UCI ML Breast Cancer Wisconsin (Diagnostic) dataset,檔案是逗號分隔欄位值的格式(Comma-Separated Values, CSV),一般文字編輯器或 Excel 都可以開啟,在 Python 的程式裡可以使用 pandas 套件來操作。 任何機器學習專案的第一個步驟都是要先熟悉取得的數據,pandas 非常適合用來執行探索數據的任務。
# 載入 WDBC (Wisconsin Diagnostic Breast Cancer) 資料集,傳回 pandas.DataFrame 類別的物件
dfWDBC = pd.read_csv('https://archive.ics.uci.edu/ml/machine-learning-databases/breast-cancer-wisconsin/wdbc.data', header=None)
# 資料欄位基本檢視
dfWDBC.info()
<class 'pandas.core.frame.DataFrame'>
RangeIndex: 569 entries, 0 to 568
Data columns (total 32 columns):
 #   Column  Non-Null Count  Dtype
---  ------  --------------  -----
 0   0       569 non-null    int64
 1   1       569 non-null    object
 2   2       569 non-null    float64
 3   3       569 non-null    float64
 4   4       569 non-null    float64
 5   5       569 non-null    float64
 6   6       569 non-null    float64
 7   7       569 non-null    float64
 8   8       569 non-null    float64
 9   9       569 non-null    float64
 10  10      569 non-null    float64
 11  11      569 non-null    float64
 12  12      569 non-null    float64
 13  13      569 non-null    float64
 14  14      569 non-null    float64
 15  15      569 non-null    float64
 16  16      569 non-null    float64
 17  17      569 non-null    float64
 18  18      569 non-null    float64
 19  19      569 non-null    float64
 20  20      569 non-null    float64
 21  21      569 non-null    float64
 22  22      569 non-null    float64
 23  23      569 non-null    float64
 24  24      569 non-null    float64
 25  25      569 non-null    float64
 26  26      569 non-null    float64
 27  27      569 non-null    float64
 28  28      569 non-null    float64
 29  29      569 non-null    float64
 30  30      569 non-null    float64
 31  31      569 non-null    float64
dtypes: float64(30), int64(1), object(1)
memory usage: 142.4+ KB
§ WDBC 資料集欄位說明¶
原始數據沒有包含欄位名稱,說明在另外一個檔案 "wdbc.names" 中。
- 欄位1: 樣本 ID
- 欄位2: 診斷結果,"M" = malignant 惡性,"B" = benign 良性
十個實數值的細胞核特徵由細針抽吸(fine needle aspiration cytology)的細胞病理影像樣本計算而來:
- 半徑 radius (mean of distances from center to points on the perimeter)
- 紋理 texture (standard deviation of gray-scale values)
- 周長 perimeter
- 面積 area
- 形狀平滑度 smoothness (local variation in radius lengths)
- 緊密度 compactness (perimeter^2 / area - 1.0)
- 輪廓凹陷度 concavity (severity of concave portions of the contour)
- 輪廓凹陷點 concave points (number of concave portions of the contour)
- 對稱性 symmetry
- 碎形維度 fractal dimension ("coastline approximation" - 1)
每個影像的這十個特徵都分別計算 mean,standard error,以及 worst(三個最大值的平均),共 30 個特徵欄位。

§ 加上欄位名稱¶
原始數據中沒有包含欄位名稱,帶有欄位名稱的資料表會比較方便處理,與使用固定序號比起來較不容易出錯,程式可讀性也比較高。
★ 原始數據處理準則 ★¶
當然也可以使用 Excel 來手動為原始數據檔案加上欄位名稱,甚至於訓練預測模型之前的很多前處理也可以,但是所有的操作必須遵循以下原則:
- 保留原始檔案,修改的內容另存新檔。
- 記錄所有修改步驟及歷程,說明的內容要可以從原始檔案重現修改的結果。
要符合這樣的原則,使用 Python 程式進行處理還是首選。
# 說明中描述的欄位名稱
column_mean = [
    "radius_mean", "texture_mean", "perimeter_mean", "area_mean", "smoothness_mean",
    "compactness_mean", "concavity_mean", "concave points_mean", "symmetry_mean", "fractal_dimension_mean"
]
column_se = [
    "radius_se", "texture_se", "perimeter_se", "area_se", "smoothness_se",
    "compactness_se", "concavity_se", "concave points_se", "symmetry_se", "fractal_dimension_se"
]
column_worst = [
    "radius_worst", "texture_worst", "perimeter_worst", "area_worst", "smoothness_worst",
    "compactness_worst", "concavity_worst", "concave points_worst", "symmetry_worst", "fractal_dimension_worst"
]

column_names = ["id", "diagnosis"] + column_mean + column_se + column_worst

# 指定欄位名稱
dfWDBC.columns = column_names

# 再一次資料欄位基本檢視
dfWDBC.info()
<class 'pandas.core.frame.DataFrame'>
RangeIndex: 569 entries, 0 to 568
Data columns (total 32 columns):
 #   Column                   Non-Null Count  Dtype
---  ------                   --------------  -----
 0   id                       569 non-null    int64
 1   diagnosis                569 non-null    object
 2   radius_mean              569 non-null    float64
 3   texture_mean             569 non-null    float64
 4   perimeter_mean           569 non-null    float64
 5   area_mean                569 non-null    float64
 6   smoothness_mean          569 non-null    float64
 7   compactness_mean         569 non-null    float64
 8   concavity_mean           569 non-null    float64
 9   concave points_mean      569 non-null    float64
 10  symmetry_mean            569 non-null    float64
 11  fractal_dimension_mean   569 non-null    float64
 12  radius_se                569 non-null    float64
 13  texture_se               569 non-null    float64
 14  perimeter_se             569 non-null    float64
 15  area_se                  569 non-null    float64
 16  smoothness_se            569 non-null    float64
 17  compactness_se           569 non-null    float64
 18  concavity_se             569 non-null    float64
 19  concave points_se        569 non-null    float64
 20  symmetry_se              569 non-null    float64
 21  fractal_dimension_se     569 non-null    float64
 22  radius_worst             569 non-null    float64
 23  texture_worst            569 non-null    float64
 24  perimeter_worst          569 non-null    float64
 25  area_worst               569 non-null    float64
 26  smoothness_worst         569 non-null    float64
 27  compactness_worst        569 non-null    float64
 28  concavity_worst          569 non-null    float64
 29  concave points_worst     569 non-null    float64
 30  symmetry_worst           569 non-null    float64
 31  fractal_dimension_worst  569 non-null    float64
dtypes: float64(30), int64(1), object(1)
memory usage: 142.4+ KB
§ 觀察數據內容¶
雖然機器學習關心的是自動識別數據中隱含的模式,但是目前機器學習的技術還沒發展到可以完全自動的程度,開始訓練模型之前還有很多的前處理工作需要人的介入,不同的模型可能需要不同的數據前處理,所以首先要先觀察手上的資料,並盡可能了解每個欄位的意義以及跟預測目標的關聯,決定要做什麼必要的前處理:
- 哪些是特徵欄位 X? 哪些是目標欄位 Y? 有沒有多餘的不要進入模型訓練的欄位?
- 都是連續數值欄位嗎? 有沒有類別欄位?
- 有沒有漏失數據? 有沒有空值要填補或插補?
- 數值欄位的數值分布狀況? 要怎麼正規化?
- 目標類別分布狀況如何? 數量是否平均?
- 特徵與目標之間是否有線性或其他形式的相關?
- 各特徵之間是否有線性或其他形式的相關?
# 看一下前面幾筆,檢視資料內容
dfWDBC.head(5)
| id | diagnosis | radius_mean | texture_mean | perimeter_mean | area_mean | smoothness_mean | compactness_mean | concavity_mean | concave points_mean | ... | radius_worst | texture_worst | perimeter_worst | area_worst | smoothness_worst | compactness_worst | concavity_worst | concave points_worst | symmetry_worst | fractal_dimension_worst | |
|---|---|---|---|---|---|---|---|---|---|---|---|---|---|---|---|---|---|---|---|---|---|
| 0 | 842302 | M | 17.99 | 10.38 | 122.80 | 1001.0 | 0.11840 | 0.27760 | 0.3001 | 0.14710 | ... | 25.38 | 17.33 | 184.60 | 2019.0 | 0.1622 | 0.6656 | 0.7119 | 0.2654 | 0.4601 | 0.11890 |
| 1 | 842517 | M | 20.57 | 17.77 | 132.90 | 1326.0 | 0.08474 | 0.07864 | 0.0869 | 0.07017 | ... | 24.99 | 23.41 | 158.80 | 1956.0 | 0.1238 | 0.1866 | 0.2416 | 0.1860 | 0.2750 | 0.08902 |
| 2 | 84300903 | M | 19.69 | 21.25 | 130.00 | 1203.0 | 0.10960 | 0.15990 | 0.1974 | 0.12790 | ... | 23.57 | 25.53 | 152.50 | 1709.0 | 0.1444 | 0.4245 | 0.4504 | 0.2430 | 0.3613 | 0.08758 |
| 3 | 84348301 | M | 11.42 | 20.38 | 77.58 | 386.1 | 0.14250 | 0.28390 | 0.2414 | 0.10520 | ... | 14.91 | 26.50 | 98.87 | 567.7 | 0.2098 | 0.8663 | 0.6869 | 0.2575 | 0.6638 | 0.17300 |
| 4 | 84358402 | M | 20.29 | 14.34 | 135.10 | 1297.0 | 0.10030 | 0.13280 | 0.1980 | 0.10430 | ... | 22.54 | 16.67 | 152.20 | 1575.0 | 0.1374 | 0.2050 | 0.4000 | 0.1625 | 0.2364 | 0.07678 |
5 rows × 32 columns
# 丟掉不需要的 "id" 欄位
dfWDBC.drop(columns=['id'], inplace=True)
# 觀察目標類別數量分布狀況
print('\n-- 不同樣本值的出現次數:\n', dfWDBC.loc[:, ('diagnosis')].value_counts())
print('\n-- 所有不是N/A的樣本數:\n', dfWDBC.loc[:, ['diagnosis']].count())

# 也可以用序號存取 diagnosis 欄位
# 注意: id 欄位刪除後, diagnosis 變成第一個欄位
print('\n-- 不同樣本值的出現次數:\n', dfWDBC.iloc[:, 0].value_counts())
print('\n-- 所有不是N/A的樣本數:\n', dfWDBC.iloc[:, 0].count())

# 觀察: 惡性的類別比較少
print('\n-- 良性與惡性的樣本數比例:\n', dfWDBC.loc[:,'diagnosis'].value_counts() / dfWDBC.loc[:,'diagnosis'].count())
-- 不同樣本值的出現次數:
 B    357
M    212
Name: diagnosis, dtype: int64

-- 所有不是N/A的樣本數:
 diagnosis    569
dtype: int64

-- 不同樣本值的出現次數:
 B    357
M    212
Name: diagnosis, dtype: int64

-- 所有不是N/A的樣本數:
 569

-- 良性與惡性的樣本數比例:
 B    0.627417
M    0.372583
Name: diagnosis, dtype: float64
§ 類別資料轉為數值¶
資料集中時常會包含非數值型態的類別數據(Categorical Data),如 WDBC 資料集中"diagnosis"欄位值是"B"或"M"的字元,機器學習的演算法處理的都是數值,需要將類別數據轉成數值型態。
# 將 diagnosis 欄位良性與惡性的類別轉為 0 與 1
dfWDBC.loc[:,'diagnosis'] = dfWDBC.loc[:,'diagnosis'].map({'B':0, 'M':1})

# 檢視幾筆確認轉換結果沒問題
dfWDBC.iloc[-5:, :8]
| diagnosis | radius_mean | texture_mean | perimeter_mean | area_mean | smoothness_mean | compactness_mean | concavity_mean | |
|---|---|---|---|---|---|---|---|---|
| 564 | 1 | 21.56 | 22.39 | 142.00 | 1479.0 | 0.11100 | 0.11590 | 0.24390 |
| 565 | 1 | 20.13 | 28.25 | 131.20 | 1261.0 | 0.09780 | 0.10340 | 0.14400 |
| 566 | 1 | 16.60 | 28.08 | 108.30 | 858.1 | 0.08455 | 0.10230 | 0.09251 |
| 567 | 1 | 20.60 | 29.33 | 140.10 | 1265.0 | 0.11780 | 0.27700 | 0.35140 |
| 568 | 0 | 7.76 | 24.54 | 47.92 | 181.0 | 0.05263 | 0.04362 | 0.00000 |
# 各數值欄位的基本統計分布狀況
display(dfWDBC.loc[:,column_mean].describe())
display(dfWDBC.loc[:,column_se].describe())
display(dfWDBC.loc[:,column_worst].describe())

# 觀察: 數據 scale 差異大
| radius_mean | texture_mean | perimeter_mean | area_mean | smoothness_mean | compactness_mean | concavity_mean | concave points_mean | symmetry_mean | fractal_dimension_mean | |
|---|---|---|---|---|---|---|---|---|---|---|
| count | 569.000000 | 569.000000 | 569.000000 | 569.000000 | 569.000000 | 569.000000 | 569.000000 | 569.000000 | 569.000000 | 569.000000 |
| mean | 14.127292 | 19.289649 | 91.969033 | 654.889104 | 0.096360 | 0.104341 | 0.088799 | 0.048919 | 0.181162 | 0.062798 |
| std | 3.524049 | 4.301036 | 24.298981 | 351.914129 | 0.014064 | 0.052813 | 0.079720 | 0.038803 | 0.027414 | 0.007060 |
| min | 6.981000 | 9.710000 | 43.790000 | 143.500000 | 0.052630 | 0.019380 | 0.000000 | 0.000000 | 0.106000 | 0.049960 |
| 25% | 11.700000 | 16.170000 | 75.170000 | 420.300000 | 0.086370 | 0.064920 | 0.029560 | 0.020310 | 0.161900 | 0.057700 |
| 50% | 13.370000 | 18.840000 | 86.240000 | 551.100000 | 0.095870 | 0.092630 | 0.061540 | 0.033500 | 0.179200 | 0.061540 |
| 75% | 15.780000 | 21.800000 | 104.100000 | 782.700000 | 0.105300 | 0.130400 | 0.130700 | 0.074000 | 0.195700 | 0.066120 |
| max | 28.110000 | 39.280000 | 188.500000 | 2501.000000 | 0.163400 | 0.345400 | 0.426800 | 0.201200 | 0.304000 | 0.097440 |
| radius_se | texture_se | perimeter_se | area_se | smoothness_se | compactness_se | concavity_se | concave points_se | symmetry_se | fractal_dimension_se | |
|---|---|---|---|---|---|---|---|---|---|---|
| count | 569.000000 | 569.000000 | 569.000000 | 569.000000 | 569.000000 | 569.000000 | 569.000000 | 569.000000 | 569.000000 | 569.000000 |
| mean | 0.405172 | 1.216853 | 2.866059 | 40.337079 | 0.007041 | 0.025478 | 0.031894 | 0.011796 | 0.020542 | 0.003795 |
| std | 0.277313 | 0.551648 | 2.021855 | 45.491006 | 0.003003 | 0.017908 | 0.030186 | 0.006170 | 0.008266 | 0.002646 |
| min | 0.111500 | 0.360200 | 0.757000 | 6.802000 | 0.001713 | 0.002252 | 0.000000 | 0.000000 | 0.007882 | 0.000895 |
| 25% | 0.232400 | 0.833900 | 1.606000 | 17.850000 | 0.005169 | 0.013080 | 0.015090 | 0.007638 | 0.015160 | 0.002248 |
| 50% | 0.324200 | 1.108000 | 2.287000 | 24.530000 | 0.006380 | 0.020450 | 0.025890 | 0.010930 | 0.018730 | 0.003187 |
| 75% | 0.478900 | 1.474000 | 3.357000 | 45.190000 | 0.008146 | 0.032450 | 0.042050 | 0.014710 | 0.023480 | 0.004558 |
| max | 2.873000 | 4.885000 | 21.980000 | 542.200000 | 0.031130 | 0.135400 | 0.396000 | 0.052790 | 0.078950 | 0.029840 |
| radius_worst | texture_worst | perimeter_worst | area_worst | smoothness_worst | compactness_worst | concavity_worst | concave points_worst | symmetry_worst | fractal_dimension_worst | |
|---|---|---|---|---|---|---|---|---|---|---|
| count | 569.000000 | 569.000000 | 569.000000 | 569.000000 | 569.000000 | 569.000000 | 569.000000 | 569.000000 | 569.000000 | 569.000000 |
| mean | 16.269190 | 25.677223 | 107.261213 | 880.583128 | 0.132369 | 0.254265 | 0.272188 | 0.114606 | 0.290076 | 0.083946 |
| std | 4.833242 | 6.146258 | 33.602542 | 569.356993 | 0.022832 | 0.157336 | 0.208624 | 0.065732 | 0.061867 | 0.018061 |
| min | 7.930000 | 12.020000 | 50.410000 | 185.200000 | 0.071170 | 0.027290 | 0.000000 | 0.000000 | 0.156500 | 0.055040 |
| 25% | 13.010000 | 21.080000 | 84.110000 | 515.300000 | 0.116600 | 0.147200 | 0.114500 | 0.064930 | 0.250400 | 0.071460 |
| 50% | 14.970000 | 25.410000 | 97.660000 | 686.500000 | 0.131300 | 0.211900 | 0.226700 | 0.099930 | 0.282200 | 0.080040 |
| 75% | 18.790000 | 29.720000 | 125.400000 | 1084.000000 | 0.146000 | 0.339100 | 0.382900 | 0.161400 | 0.317900 | 0.092080 |
| max | 36.040000 | 49.540000 | 251.200000 | 4254.000000 | 0.222600 | 1.058000 | 1.252000 | 0.291000 | 0.663800 | 0.207500 |
§ 將資料集的載入包裝成類別¶
載入資料集以及前處理的工作繁瑣,時常會反覆修改再重新執行訓練。 通常將這部分的工作包裝成一個 class 類別,跟模型的定義與訓練分開處理。
class WdbcDataset:
    def __init__(self):
        # 載入 WDBC (Wisconsin Diagnostic Breast Cancer) 資料集
        wdbc_url = 'https://archive.ics.uci.edu/ml/machine-learning-databases/breast-cancer-wisconsin/wdbc.data'
        self.df = pd.read_csv(wdbc_url, header=None)

        # 說明中描述的欄位名稱
        column_mean = [
            "radius_mean", "texture_mean", "perimeter_mean", "area_mean", "smoothness_mean",
            "compactness_mean", "concavity_mean", "concave points_mean", "symmetry_mean", "fractal_dimension_mean"
        ]
        column_se = [
            "radius_se", "texture_se", "perimeter_se", "area_se", "smoothness_se",
            "compactness_se", "concavity_se", "concave points_se", "symmetry_se", "fractal_dimension_se"
        ]
        column_worst = [
            "radius_worst", "texture_worst", "perimeter_worst", "area_worst", "smoothness_worst",
            "compactness_worst", "concavity_worst", "concave points_worst", "symmetry_worst", "fractal_dimension_worst"
        ]
        column_names = ["id", "diagnosis"] + column_mean + column_se + column_worst

        # 指定欄位名稱
        self.df.columns = column_names
        # 丟掉不需要的 "id" 欄位
        self.df.drop(columns=['id'], inplace=True)
        # 將 diagnosis 欄位良性與惡性的類別轉為 0 與 1
        self.df.loc[:,'diagnosis'] = self.df.loc[:,'diagnosis'].map({'B':0, 'M':1})

    def get_xy(self, standardize=True, transpose=True):
        # 隨機排列樣本順序
        rng = np.random.default_rng(1)
        index_shuffled = rng.permutation(self.df.shape[0])
        # 80% 當訓練集,20% 當測試集
        train_size = int(0.8 * self.df.shape[0])
        # 取 X 的訓練集和測試集,轉成 numpy.ndarray
        X = self.df.drop(columns=['diagnosis'])
        X_train = X.iloc[index_shuffled[:train_size], :].to_numpy()
        X_test = X.iloc[index_shuffled[train_size:], :].to_numpy()
        # 取 Y 的訓練集和測試集,轉成 numpy.ndarray
        Y = self.df.loc[:,'diagnosis']
        Y_train = Y.iloc[index_shuffled[:train_size]].to_numpy()
        Y_test = Y.iloc[index_shuffled[train_size:]].to_numpy()
        # 數據標準化
        if standardize:
            X_mean = X_train.mean(axis=0, keepdims=True)
            X_std = X_train.std(axis=0, keepdims=True)
            X_train = (X_train - X_mean) / X_std
            X_test = (X_test - X_mean) / X_std
        # 將原本的(樣本數,特徵數)形狀轉成(特徵數,樣本數)
        if transpose:
            X_train = X_train.T
            X_test = X_test.T
            Y_train = np.expand_dims(Y_train, axis=0)
            Y_test = np.expand_dims(Y_test, axis=0)
        # 回傳處理後的資料副本
        return X_train.copy(), X_test.copy(), Y_train.copy(), Y_test.copy()
14.3 Logistic Regression 學習模型¶
Logistic Regression 是廣泛運用在許多工程和科學的領域的線性分類模型 p(y|x;w),輸入 x 藉由擬合 logistic 函數(sigmoid 函數)來學習目標 y 正確預測的機率,是對線性可分的資料非常有效而且非常容易實作的分類模型。
Sigmoid function¶
σ(z)=11+e−z=ez1+ezProperties of sigmoid function¶
{for z→∞,σ(z)→1for z→−∞,σ(z)→0import numpy as np
def sigmoid(z):
"""Compute the sigmoid of z
Arguments
---------
z : A scalar or numpy array of any size.
NOTE: 使用 scipy 提供的 expit 函式通常比自己寫的更經得起考驗
from scipy.special import expit
return expit(z)
"""
return 1.0 / (1.0 + np.exp(-z))
# plot sigmoid function
z = np.arange(-6, 6, 0.1)
𝜎_z = sigmoid(z)

_, ax = plt.subplots(figsize=(8, 6))
ax.plot(z, 𝜎_z)
ax.axvline(0.0, color='k')
ax.set_ylim(-0.1, 1.1)
ax.set_xlabel('z', fontsize=16)
ax.set_ylabel('$\sigma$(z)', fontsize=16)
ax.set_yticks([0.0, 0.5, 1.0])
ax.yaxis.grid(True)
ax.xaxis.grid(False)
ax.set_title('sigmoid', fontsize=18, fontweight='bold')

plt.show()

§ Binary Logistic Regression 學習模型¶
Image(filename='images/LogisticRegression.png', width=480)

Given an input example x∈Rn and class label y∈{0,1}, the binary logistic regression is the following model under Bernoulli distribution.
p(y|x;w)=Bernoulli(y|σ(wTx+b))where z=wTx+b is a linear predictor with parameter w∈Rn,b∈R , and σ is the sigmoid function. The corresponding probability mass function is {p(y=1|x;w)=σ(z)p(y=0|x;w)=1−σ(z)
which can be written in a more concise form as p(y|x;w)=σ(z)y(1−σ(z))1−y
We want the model to yield probability ouput a=σ(z),0<a<1 such that ˆy=1 is correct for a>0.5.
ˆy=p(y=1|x;w)=a=σ(z)=11+e−z=11+e−(wTx+b)wTx is the inner product between the weight vector w and the feature vector x. This function defines a linear hyperplane, with normal vecetor w and an offset b from the origin. Supposed a plane in a 3D feature space going through a point x0 with surface normal w. Points on the surface satisfy wT(x−x0)=0. If we define b=−wTx0, we can rewrite this as wTx+b=0. This plane separate 3D space into two half spaces. This linear plane is known as decsion boundary [3].
Maximum likelihood estimation¶
We can estimate the parameters of a logistic regression model using maximum likelihood estimation (MLE), and the estimation can be done by minimize Negative Log Likelihood (NLL) as the objective function. For i=1…m input samples, ai=σ(zi) is the probability of class 1, NLL is given by NLL(w)=−logi∏i=1Bernoulli(yi|ai)=−m∑i=1log[ayii(1−ai)1−yi]=−m∑i=1[yilog(ai)+(1−yi)log(1−ai)]=m∑i=1H(yi,ai)
where H(yi,ai) is the binary cross entropy defined by
H(p,q)=−[plog(q)+(1−p)log(1−q)]H(p,q) measures how much q differs from p. In other words, H(y,a) is the loss function L(w) to measure how much ˆy estimated by a differs from true y. The loss is smaller if the estimation is close to correct.
L(w)=−m∑i=1[yilog(ai)+(1−yi)log(1−ai)]The learning cost J(w) is then computed as
J(w)=−1mm∑i=1[yilog(ai)+(1−yi)log(1−ai)]and we optimize the NLL objective function by minimize the cost function J(w) using gradient descent algorithm.
觀察 Binary Cross Entropy 的不同反應¶
由上述 NLL 的推導結果,我們知道可以透過最小化 binary cross entropy H(y,a) 這樣的 loss function 來達到學習的目標,仔細觀察 H 在不同的 y 和 a 值下的反應,思考一下這些反應與學習目標的關係,這有助於你理解為什麼這個方法可以學到東西。
★ H(y,a)>0¶
由於 0<a=σ(z)<1,取 log(a) 和 log(1−a) 的結果永遠小於 0,所以 H(y,a) 永遠大於 0。
★ H(0,0.5)=H(1,0.5)¶
不管 y 是 0 或是 1,當 a=0.5 時 H(y,a) 都是計算 −log(0.5)。
def binary_cross_entropy(y, a):
    return -(y * np.log(a) + (1 - y) * np.log(1 - a))
# 狀況一: 假設某個樣本 x 對應的標籤 y = 1, 套用目前參數 wx+b 後 a = 0.64
y = 1
a = 0.64

binary_cross_entropy(y, a)
0.4462871026284195
# 狀況二: 假設狀況一的標籤其實是 y = 0
y = 0
a = 0.64

binary_cross_entropy(y, a)
1.0216512475319814
# 狀況三: 假設某個樣本 x 對應的標籤 y = 0, 套用目前參數 wx+b 後 a = (1 - 0.64) = 0.36
y = 0
a = 0.36

binary_cross_entropy(y, a)
0.4462871026284195
# 狀況四: 假設狀況三的標籤其實是 y = 1
y = 1
a = 0.36

binary_cross_entropy(y, a)
1.0216512475319814
# 求出 z 在 [-6, 6] 值域範圍內 a = 𝜎(z) 的反應值
z = np.linspace(-6, 6, num=121)
a = sigmoid(z)

# 分別求出 y = {0, 1} 下的 H(y, a) 反應值
H_y0 = binary_cross_entropy(0, a)
H_y1 = binary_cross_entropy(1, a)

# 將兩條反映曲線分別畫出來
_, ax = plt.subplots(figsize=(8, 6))
ax.plot(a, H_y0, label='H(y=0, a)')
ax.plot(a, H_y1, label='H(y=1, a)')
ax.set_xlabel('a = $\sigma$(z)', fontsize=16)
ax.set_ylabel('loss = H(y, a)', fontsize=16)
ax.set_title('Response of Binary Cross Entropy', fontsize=18, fontweight='bold')
ax.legend()
<matplotlib.legend.Legend at 0x1bcad31b970>

14.4 Gradient Descent 最佳化演算法¶
Image(filename='images/LogisticRegression_GradientDescent.png', width=480)

The idea of gradient descent is just like climbing down a hill. For each iteration t, we take a step in the opposite direction of the gradient until a local or global cost minima is reached. The step size is determined by the value of the learning rate η.
wt+1=wt−η∇J(w)完整使用 gradient descent 最佳化的 logistic regression 步驟("forward" and "backward" propagation)如下:
- 輸入 Xm×n
- 隨機初始化權重參數 w 與 b
- (forward)計算 A=σ(wTx+b)=(a1,a2,...,am)
- 計算損失(成本)函數 J(w)=−1m∑mi=1[yilog(ai)+(1−yi)log(1−ai)]
- 計算當下的梯度 ∇J(w)
- (backward)更新參數 w=w−η∇J(w)
- 重複以上步驟,直到損失收斂到最小,或達到事先設定的迭代次數。
Here are the derived formulas for ∇J(w)
∂J∂w=1mX(A−Y)T# 梯度場圖示
Image(filename='images/GradientField_BumpAndPit.png', width=960)

# Binary Cross Entropy 梯度反向傳播的公式推導
Image(filename='images/BinaryCrossEntropy_BackwardPropagation.jpg', width=960)

14.5 從頭實作 Binary Logistic Regression¶
def accuracy(Y, Y_predict):
  """compute classification accuracy score
  """
  return np.average(Y == Y_predict)
class BinaryLogisticRegression:
    """Logistic Regression binary classification with gradient descent.

    Parameters
    ----------
    learning_rate : float
    n_iteration : int
    """
    def __init__(self, learning_rate=0.01, n_iteration=1000):
        self.eta = learning_rate
        self.n_iter = n_iteration
        # for recording the training history
        self.costs = []

    def initialize(self, n_features):
        """Initialize parameters: weight and bias
        """
        rng = np.random.default_rng()
        self.W = rng.normal(loc=0.0, scale=0.01, size=(n_features,1))
        self.b = rng.normal(loc=0.0, scale=0.01)

    def forward(self, X):
        """Forward propagation

        Parameters
        ----------
        X : np.ndarray, shape = (n_features, n_samples)
        """
        return sigmoid(np.dot(self.W.T, X) + self.b)

    def fit(self, X, Y):
        """Fit training data

        Parameters
        ----------
        X : np.ndarray, shape = (n_features, n_samples)
        Y : np.ndarray, shape = (n_samples,)
        """
        self.initialize(X.shape[0])
        # m is the number of samples
        m = X.shape[1]
        # gradient descent optimization loop
        for i in range(1,self.n_iter+1):
            # forward pass
            A = self.forward(X)
            cost = -np.sum(Y * np.log(A) + (1 - Y) * np.log(1 - A)) / m
            # backward propagation, 事先已推導的梯度公式
            dW = np.dot(X, (A - Y).T) / m
            db = np.sum(A - Y) / m
            # update parameters
            self.W -= self.eta * dW
            self.b -= self.eta * db
            # keep the cost
            self.costs.append(cost)
            if i % 100 == 0:
                acc = accuracy(Y, self.predict(X))
                print('#{} iteration: accuracy = {:.3f}, cost = {:.3f}'.format(i, acc, cost), flush=True)

    def predict(self, X):
        """ Predict 0 or 1 using learned parameters (W, b)

        Parameters
        ----------
        X : np.ndarray, shape = (n_features, n_samples)
        """
        A = self.forward(X)
        Y_predict = np.where(A > 0.5, 1, 0)
        return Y_predict
§ 載入資料集準備訓練¶
# load data
dsWdbc = WdbcDataset()
X_train, X_test, Y_train, Y_test = dsWdbc.get_xy(standardize=True, transpose=True)

print('WDBC data loaded:')
print('\tTraining set shape: X {}, Y {}'.format(X_train.shape, Y_train.shape))
print('\tTesting set shape: X {}, Y {}'.format(X_test.shape, Y_test.shape))
WDBC data loaded:
	Training set shape: X (30, 455), Y (1, 455)
	Testing set shape: X (30, 114), Y (1, 114)
§ 訓練自建的模型¶
# construct logistic regression model
blr = BinaryLogisticRegression(learning_rate=0.005, n_iteration=2000)

# train and watch out for the progress
blr.fit(X_train, Y_train)

# test to validate the performance
Y_predict = blr.predict(X_test)
print('Test accuracy = {:.3f}'.format(accuracy(Y_test, Y_predict)))
#100 iteration: accuracy = 0.943, cost = 0.339
#200 iteration: accuracy = 0.954, cost = 0.255
#300 iteration: accuracy = 0.963, cost = 0.214
#400 iteration: accuracy = 0.965, cost = 0.189
#500 iteration: accuracy = 0.967, cost = 0.172
#600 iteration: accuracy = 0.971, cost = 0.160
#700 iteration: accuracy = 0.971, cost = 0.150
#800 iteration: accuracy = 0.971, cost = 0.143
#900 iteration: accuracy = 0.971, cost = 0.136
#1000 iteration: accuracy = 0.974, cost = 0.131
#1100 iteration: accuracy = 0.974, cost = 0.127
#1200 iteration: accuracy = 0.976, cost = 0.123
#1300 iteration: accuracy = 0.978, cost = 0.119
#1400 iteration: accuracy = 0.978, cost = 0.116
#1500 iteration: accuracy = 0.978, cost = 0.114
#1600 iteration: accuracy = 0.980, cost = 0.111
#1700 iteration: accuracy = 0.980, cost = 0.109
#1800 iteration: accuracy = 0.980, cost = 0.107
#1900 iteration: accuracy = 0.980, cost = 0.105
#2000 iteration: accuracy = 0.980, cost = 0.103
Test accuracy = 0.974
§ 檢視訓練歷程¶
# plot the learning history
_, ax = plt.subplots(figsize=(8, 6))
ax.plot(blr.costs)
ax.set_xlabel('iteration', fontsize=16)
ax.set_ylabel('cost', fontsize=16)
ax.set_title('learning rate = {}'.format(blr.eta), fontsize=16, fontweight='bold')
plt.show()

14.6 使用 Scikit-Learn 的 LogisticRegression¶
# load data
dsWdbc = WdbcDataset()
# 注意: scikit-learn 的模型接受的輸入都是 (n_samples, n_features) 的形狀
X_train, X_test, Y_train, Y_test = dsWdbc.get_xy(standardize=True, transpose=False)

print('WDBC data loaded:')
print('\tTraining set shape: X {}, Y {}'.format(X_train.shape, Y_train.shape))
print('\tTesting set shape: X {}, Y {}'.format(X_test.shape, Y_test.shape))
WDBC data loaded:
	Training set shape: X (455, 30), Y (455,)
	Testing set shape: X (114, 30), Y (114,)
from sklearn.linear_model import LogisticRegression
sklr = LogisticRegression(max_iter=300)

sklr.fit(X_train, Y_train)

# 測試模型的準確度
print('Accuracy = {:.3f}'.format(sklr.score(X_test, Y_test)))
Accuracy = 0.974
References¶
- Andrew Ng, "Neural Networks and Deep Learning", Deep Learning Specialization Couse 1, 2017. [YouTube]
- Sebastian Raschka and Vahid Mirjalili. "Python Machine Learning: Machine Learning and Deep Learning with Python, Scikit-Learn, and TensorFlow". Second edition, Packt Publishing, 2017.
- Murphy, Kevin P. "Machine learning: a probabilistic perspective". MIT press, 2012.