
Brief Introduction 
In this report, I will be using Minnesota Voting Data/Records to show insight on the 2015 Saint Paul city council elections as well to illustrate systemic inequities. As part of the Saint Paul Open-Data Project, the coding will be accessible to everyone. This is only a data report, the qualitative and solution portion was excluded so readers can come up with their own conclusions. To view the full report with analysis. Click here.
- Data Analysis [Informational]: Include voting rate for different elections, Ward analysis, Youth voter rate, and Precinct fragmentation analysis
Disclaimer: I am running for Saint Paul city council for Ward 1 (election on November 5th, 2019). One core feature of the Citizen-First campaign is to educate citizens about current systemic inequities and local issues so we can work on them together. I have decided to create an open data report for all of Saint Paul (not just my Ward), so citizens and candidates throughout the city have discussions on systematic voter suppression, and take active actions in addressing it. Please take the time to read, and be part of the solution. Power to the people. #power2people
Saint Paul Open Data Initiative 
This initiative focuses on taking public information/data from municipalities and organizations to create interactive reports and analysis to better inform and assist community members to take action. This is an open-source project meaning that all coding is accessible to everyone, and thus there is transparency on the results. It is currently all python-based. As always, I encourage other programmers and developers to participate in making this more accessible. You can learn more information on the project Github page as well as accessing documents.
Unlike my previous reports, the Minnesota voting records is not publicly available, but is publicly accessible. I will not provide the raw data on the project page as it contains sensitive personal information, you can contact the Minnesota Secretary of State for the voting records here, which also includes the columns provided.
If you use any material/graphs from the report, please give credit to me and the project
Reader's Note 
There are a few questions that I want you to consider when reviewing the data analysis:
- Why does our local elections matter?
- Who benefits from the current system and who doesn't?
- What can we do about it?
Here are some FACTS (i.e. data results) from the 2015 City Council Elections to get you motivated to read further
- During the last presidential election, registered voter turnout was 78%, while the 2015 city council election ranged from 9% to 18%.
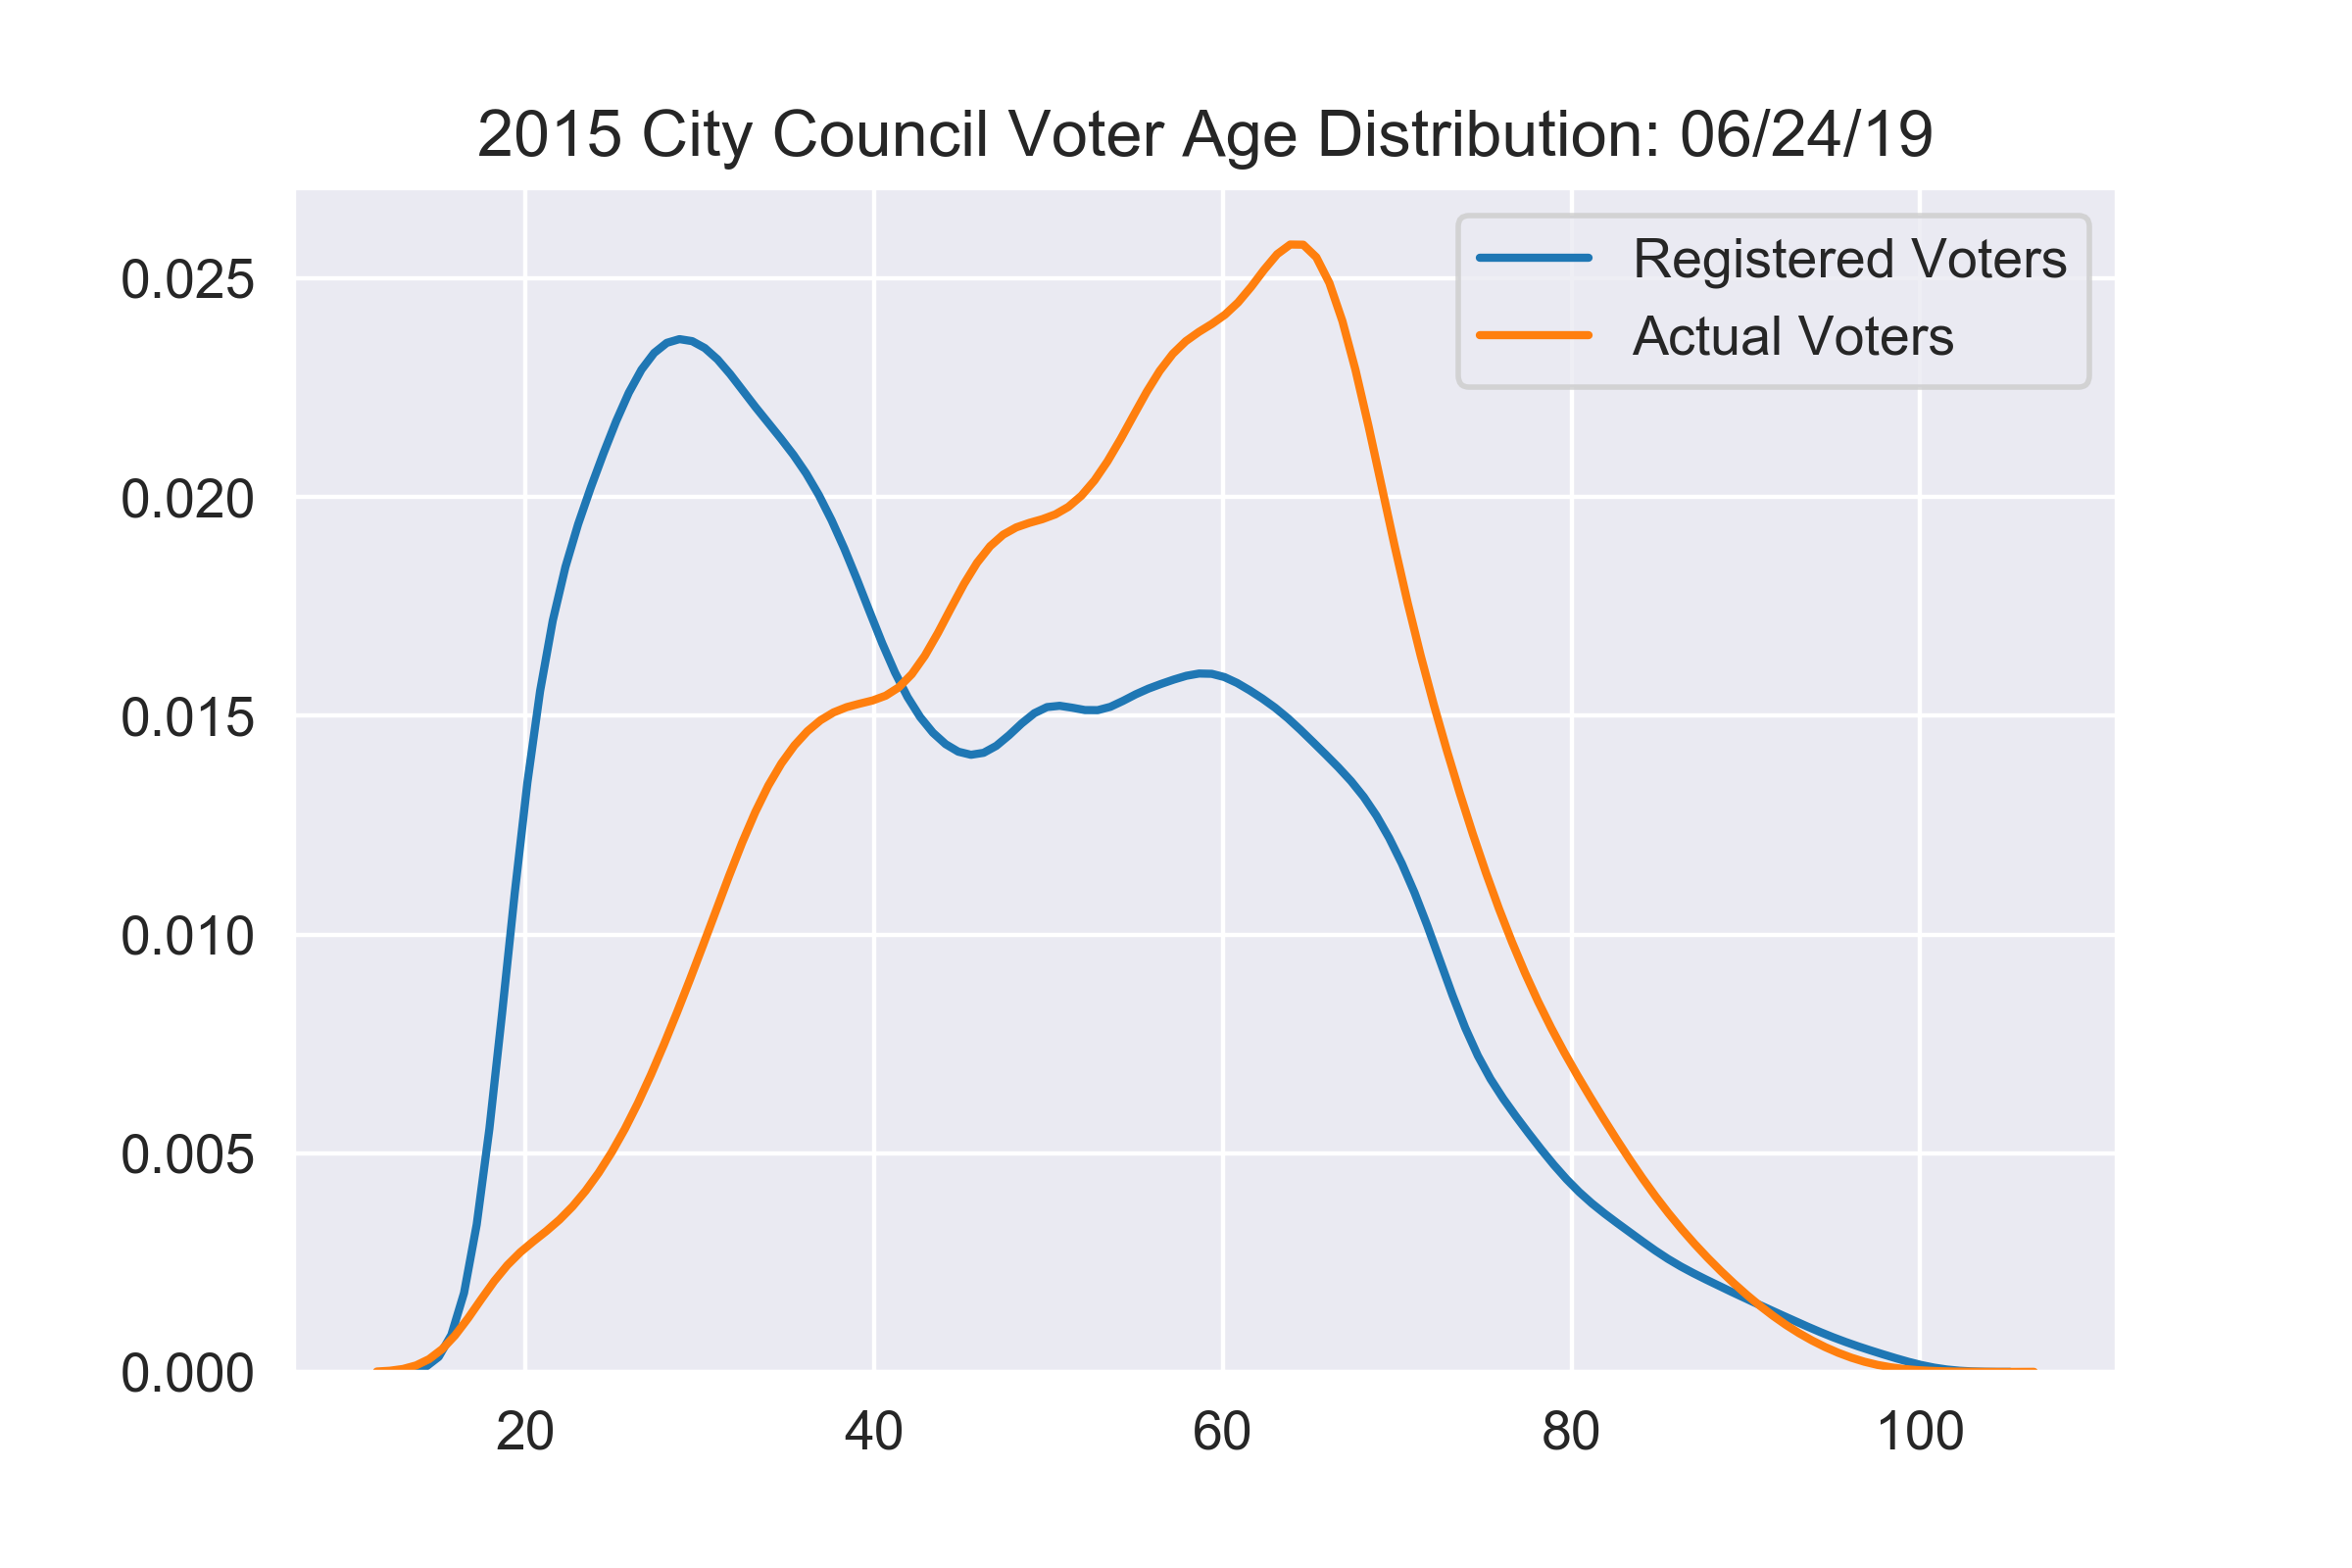
- Despite younger adults being the largest demographic, it is the senior citizens who vote disproportionately more.
- The 18-20 age group voting percentage of the 2015 city council election is 1%
- 18 out of 95 precincts are under-respresentated (greater than 2% points). See Map Below
map_2015_SP_CityCouncilRepresentation_byPrecinct()
Section I: Data Analysis 
About the Data: 
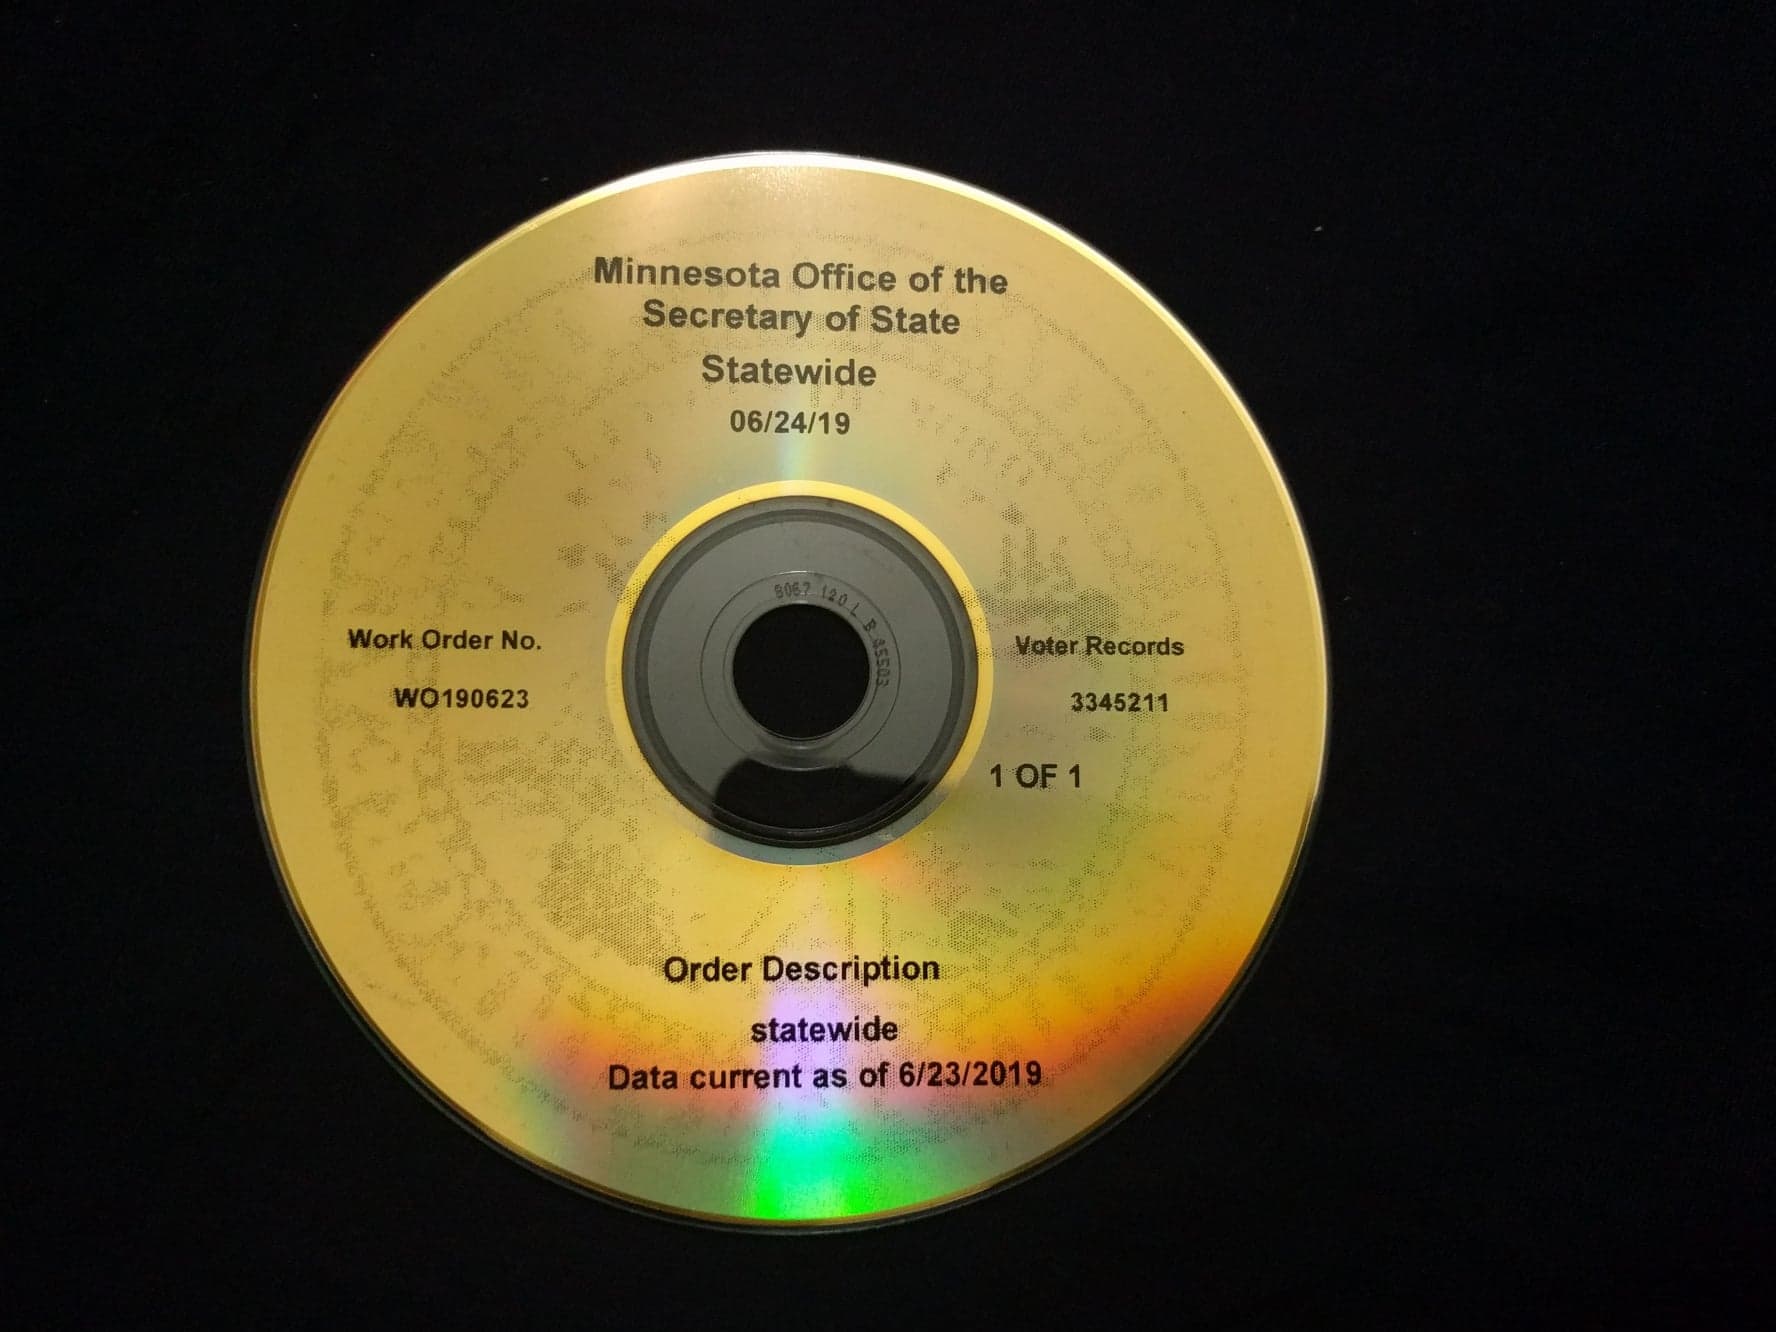
The data is taken from Minnesota voting records and the data was current of 6/24/2019 as indicated in the picture below. There are two datasets in the CD: Voter profile and Voting Records. This is the bare basic voting information obtained from the state that it is utilized by most campaigns. In addition, I got geojson file for my map here
Background:
As a Saint Paul resident, I am represented by different layers of governance, whom I can vote for during an election. The layers of governance can be broken down to four categories: Federal, State, County, and Local. Only the local city election occur during the odd calendar years. The other government roles have the elections on even years and the available open seats are staggered. In Saint Paul, the city council elections shares the staggered term of the school board. The Saint Paul City Council member term is four years and is not staggered. In contrast, the sister city, Minneapolis, has the mayoral and city council election occurs at the same time calendar year, which will be used for comparison.
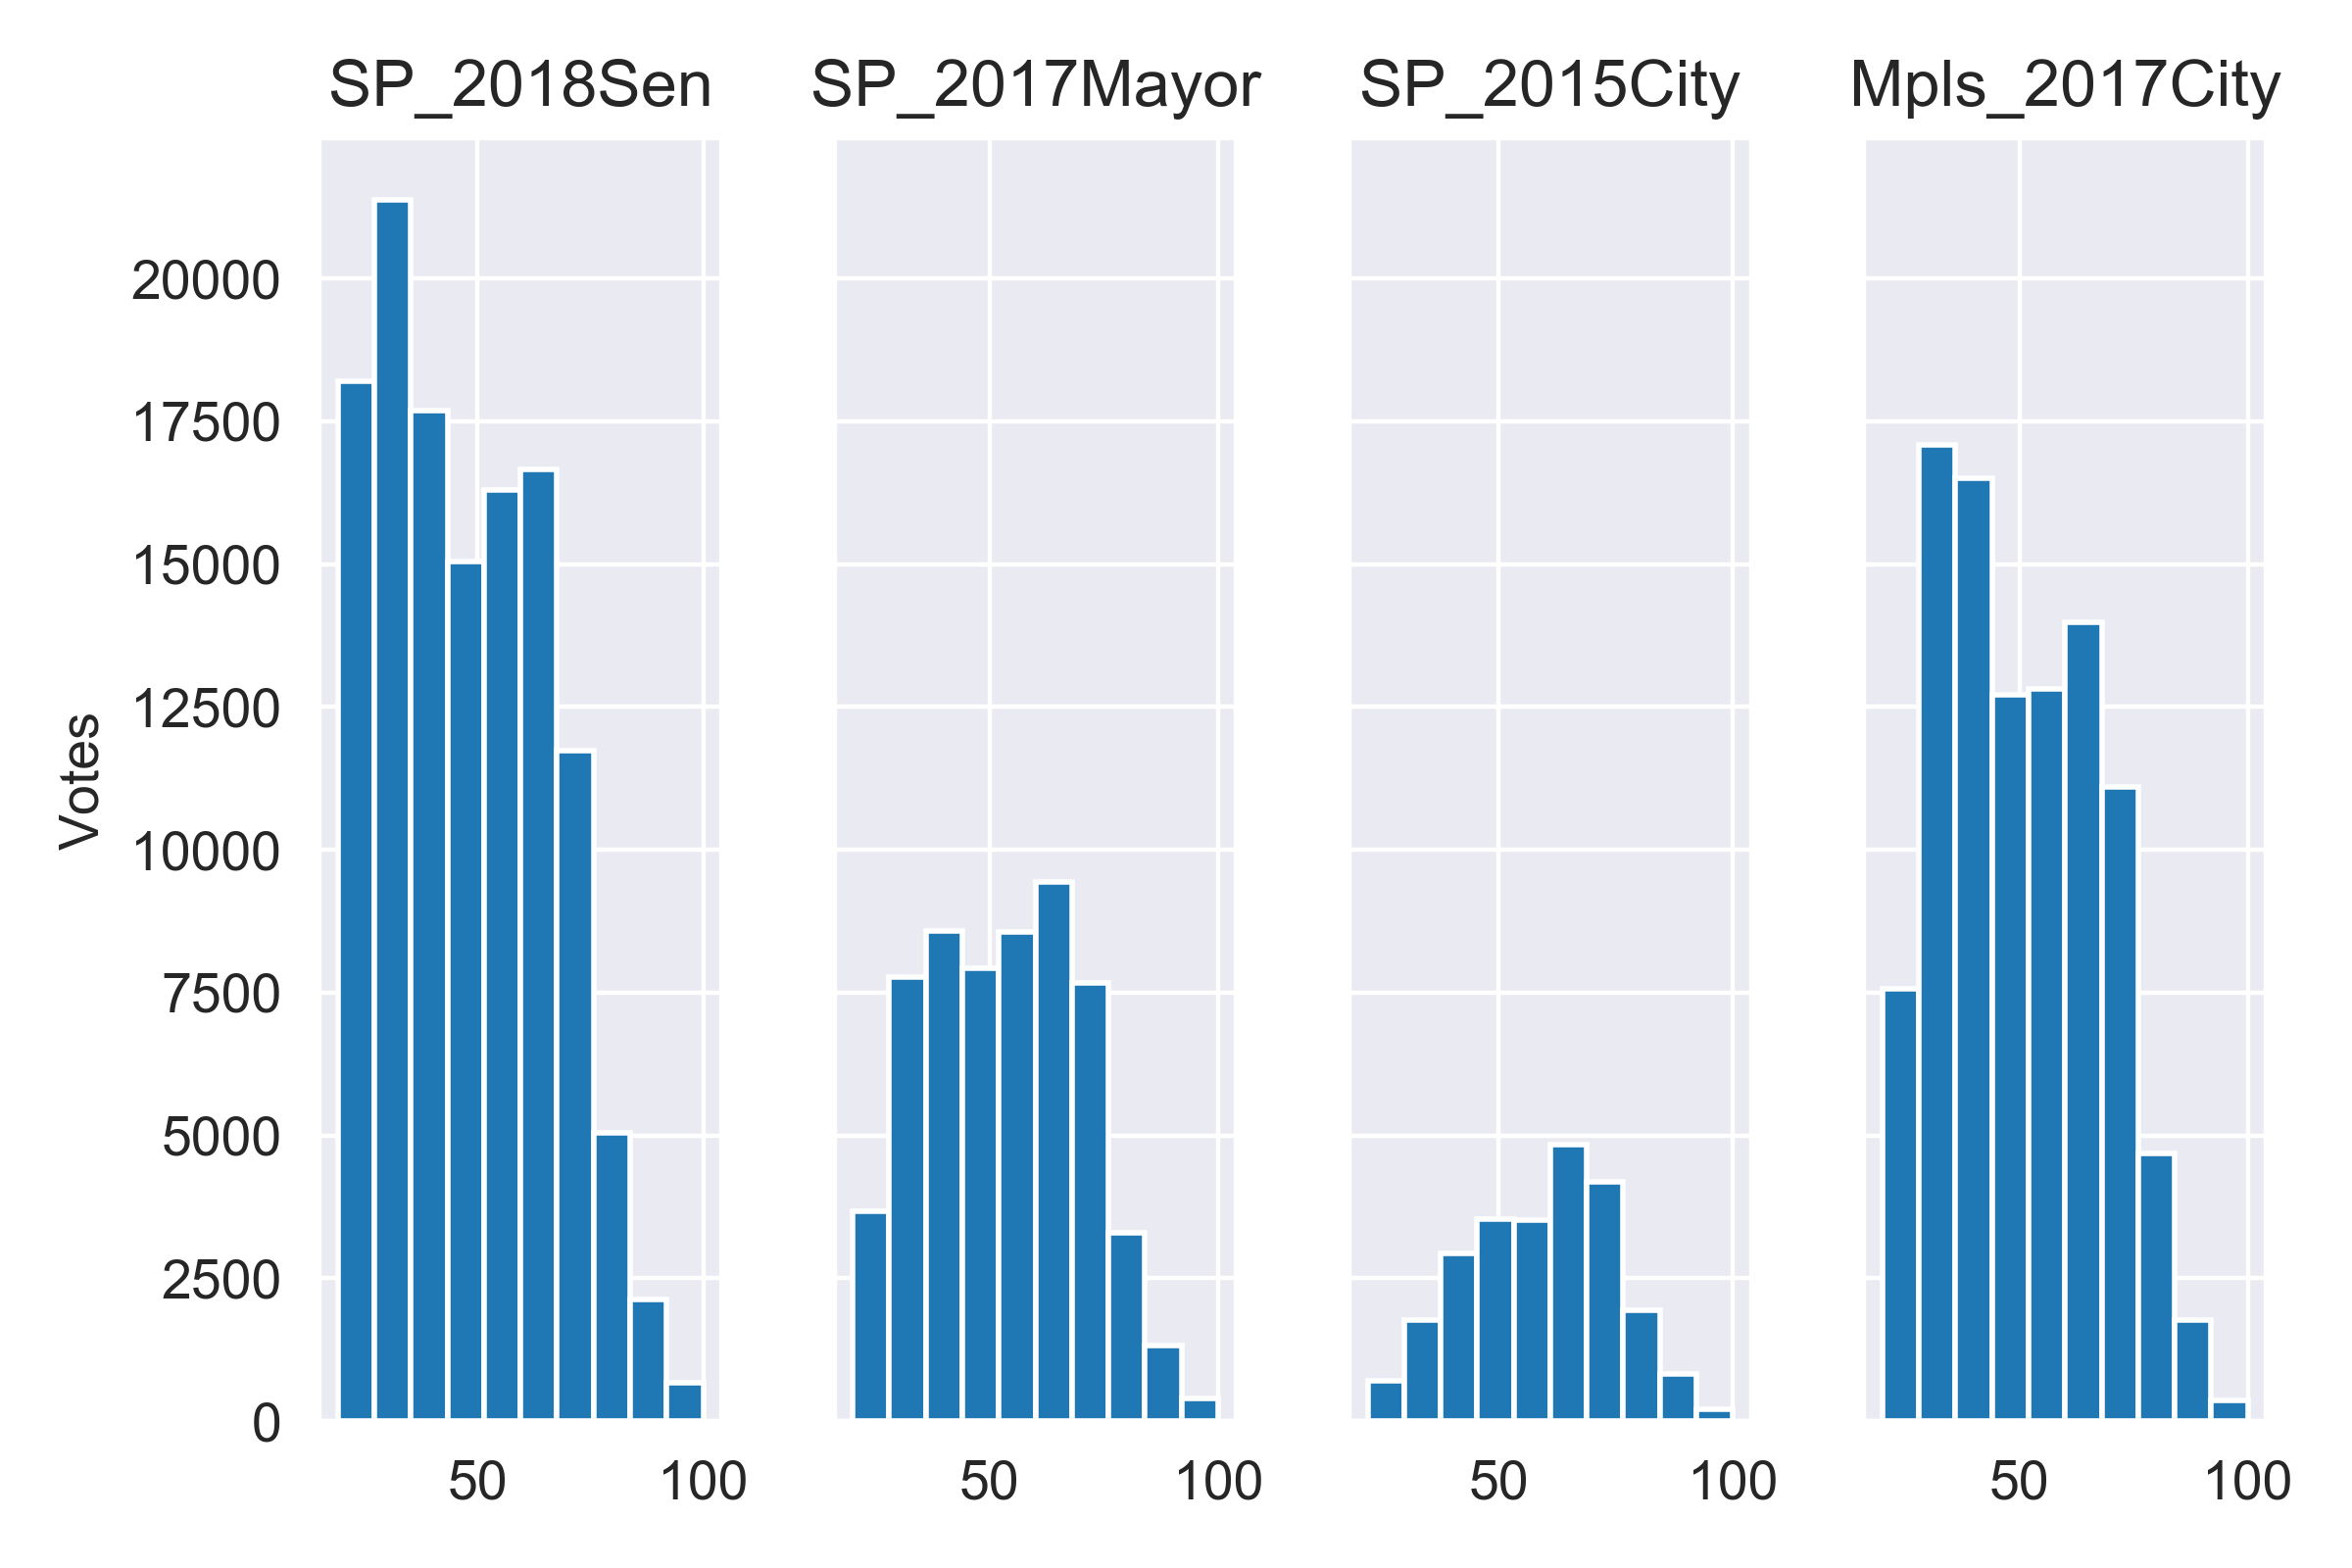
The last four more major elections in Saint Paul:
- 2018: Governor, Senator
- 2017: Mayor
- 2016: Presidential
- 2015: City Council
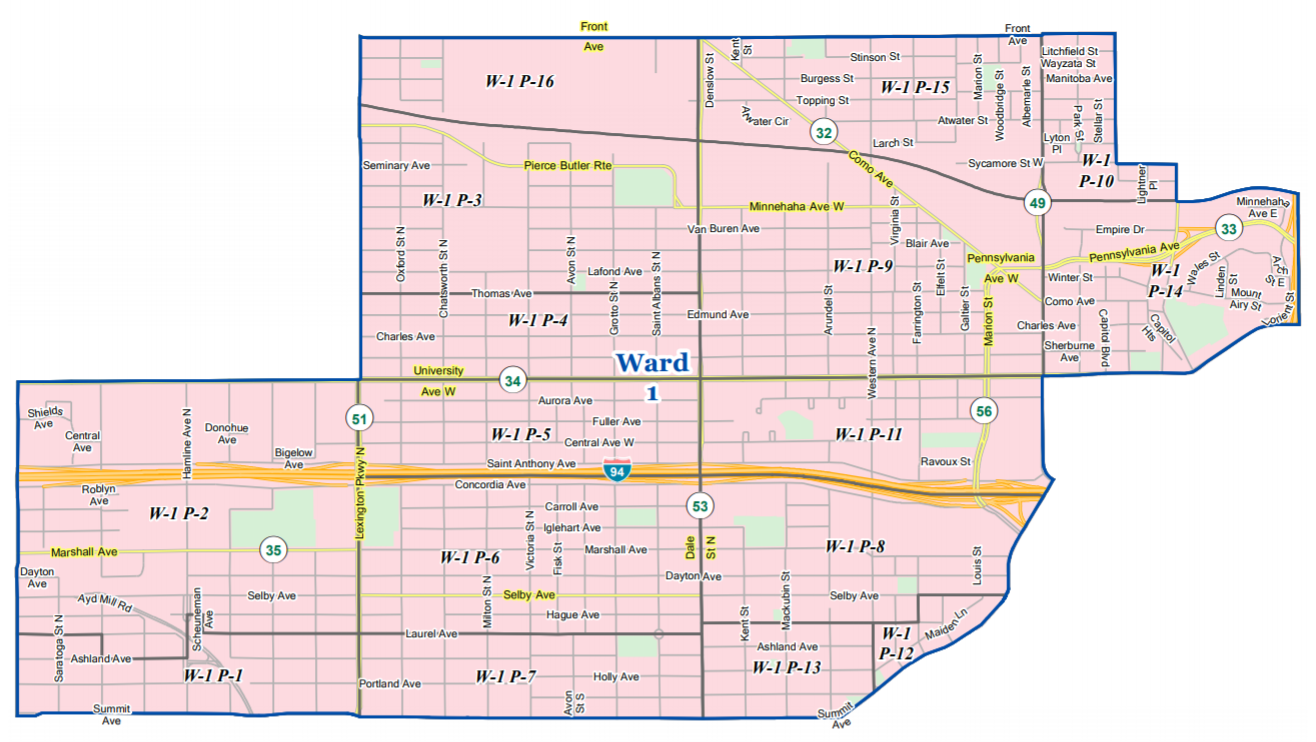
All of these governmental bodies are interconnected providing services/representing citizens directly. Within Saint Paul’s Ward 1, there are 4 state representatives, 3 county commissioners, and 3 state senators. In other words, there is considerable overlap between agencies based on living location. The Saint Paul city council is the legislative board of the city, totaling 7 council members for each Ward, which holds roughly 41,000 people respectively. The ward can be further broken down even further into non-elected district planning councils that represent neighborhoods areas, and serve an essential role for the city's comprehensive development plan.

From the map above, we can see there is potential fragmentation, where certain pockets of a neighborhood may be isolated. I will be implementing a precinct analysis, to find which precincts are under-represented compared to surrounding precincts in the ward.
Data Assumptions: 
Assumptions: The raw data contains the records of registered voters, so there might be some voters whom that have not registered within and/or outside Saint Paul. In addition, some voters may likely be deceased (i.e. there are 120 year olds), and their voter information has not been removed from the records. In both cases, the numbers are negligible and substantial data cleaning is unnecessary for this report.
Methodology:
Time Sensitivity on Registered Voters: It is sensitive to time, especially within the last three years. Time sensitivity is less for older populations as there is numerous years giving accurate number on the total potentional registered voters. It is recommended to do a youth analysis, after at least one major federal/state elections
Finding the approximate age of registered voters: For each registered voter, the year for date of birth was provided, which was used to determine their relative age. The actual age is important for 18 year olds, as they are not able to vote if they turn 18 after a general election, so they have 1/6 less representation
Finding the number of potential registered voters at a given election year: This is done through a post-hoc method where I take the voter registration of succeeding elections to determine the number of people in the age group that could have voted. This is similar to the time sensitivity
Age/Voter Demographics: 
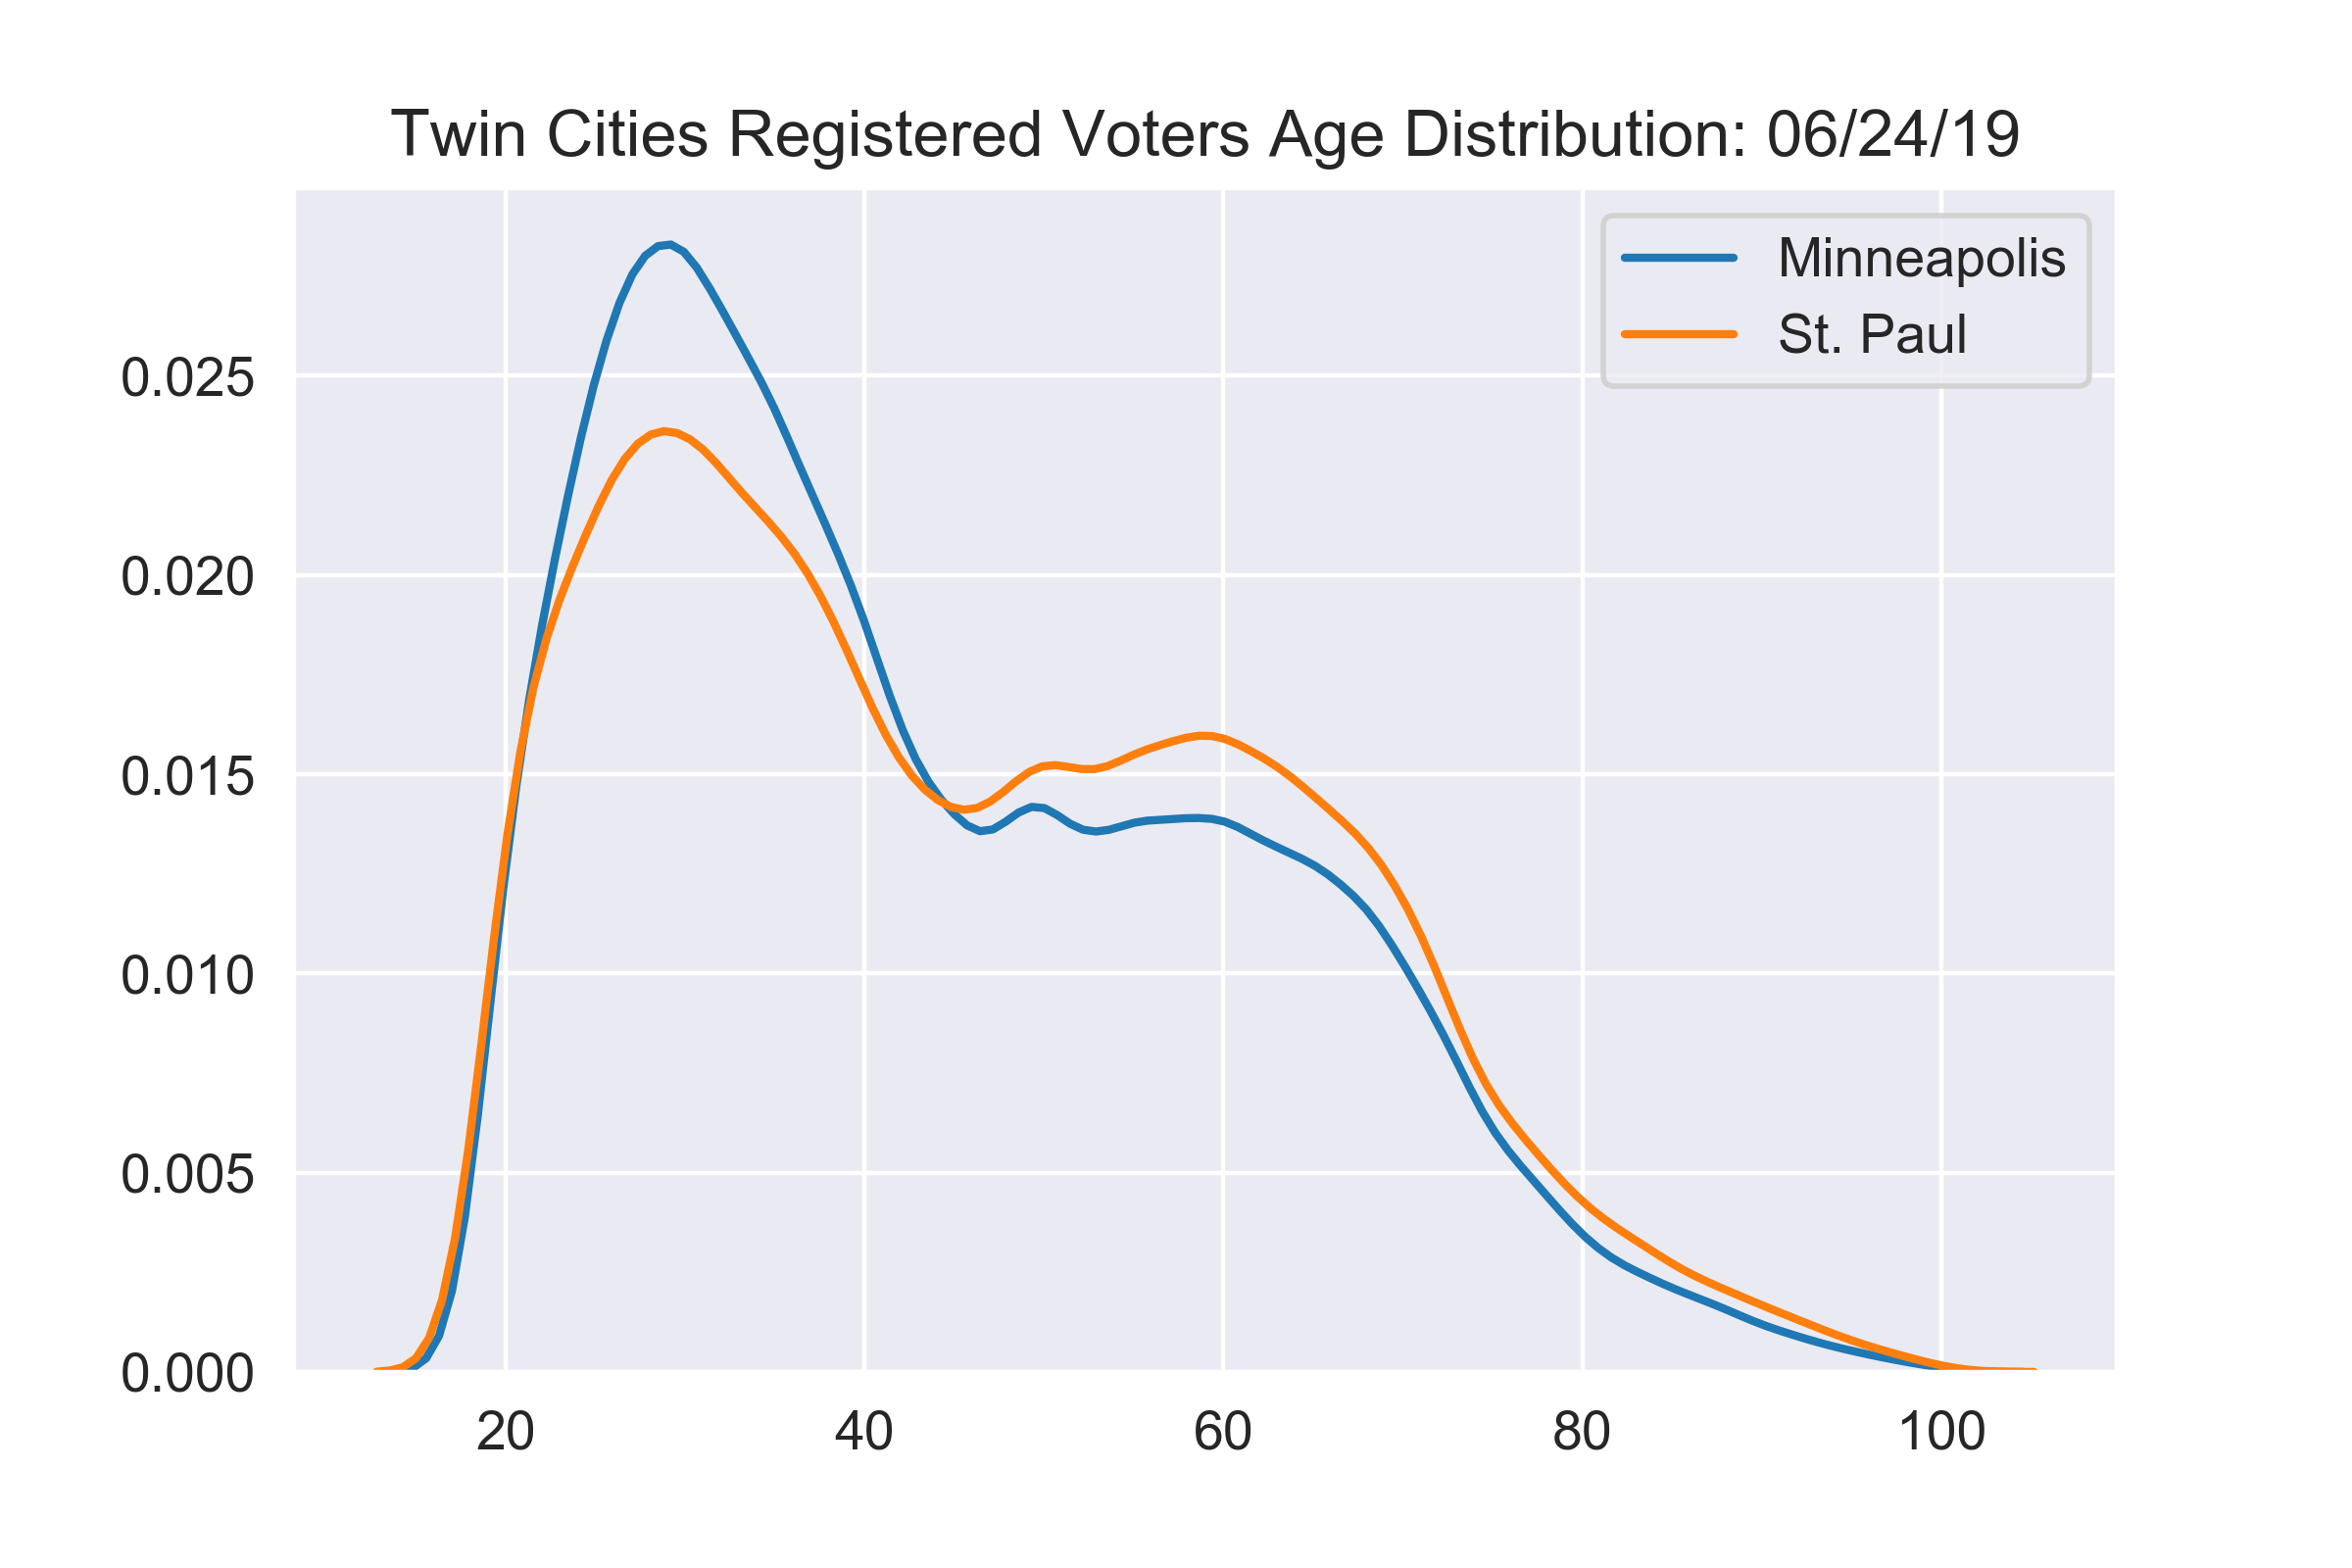
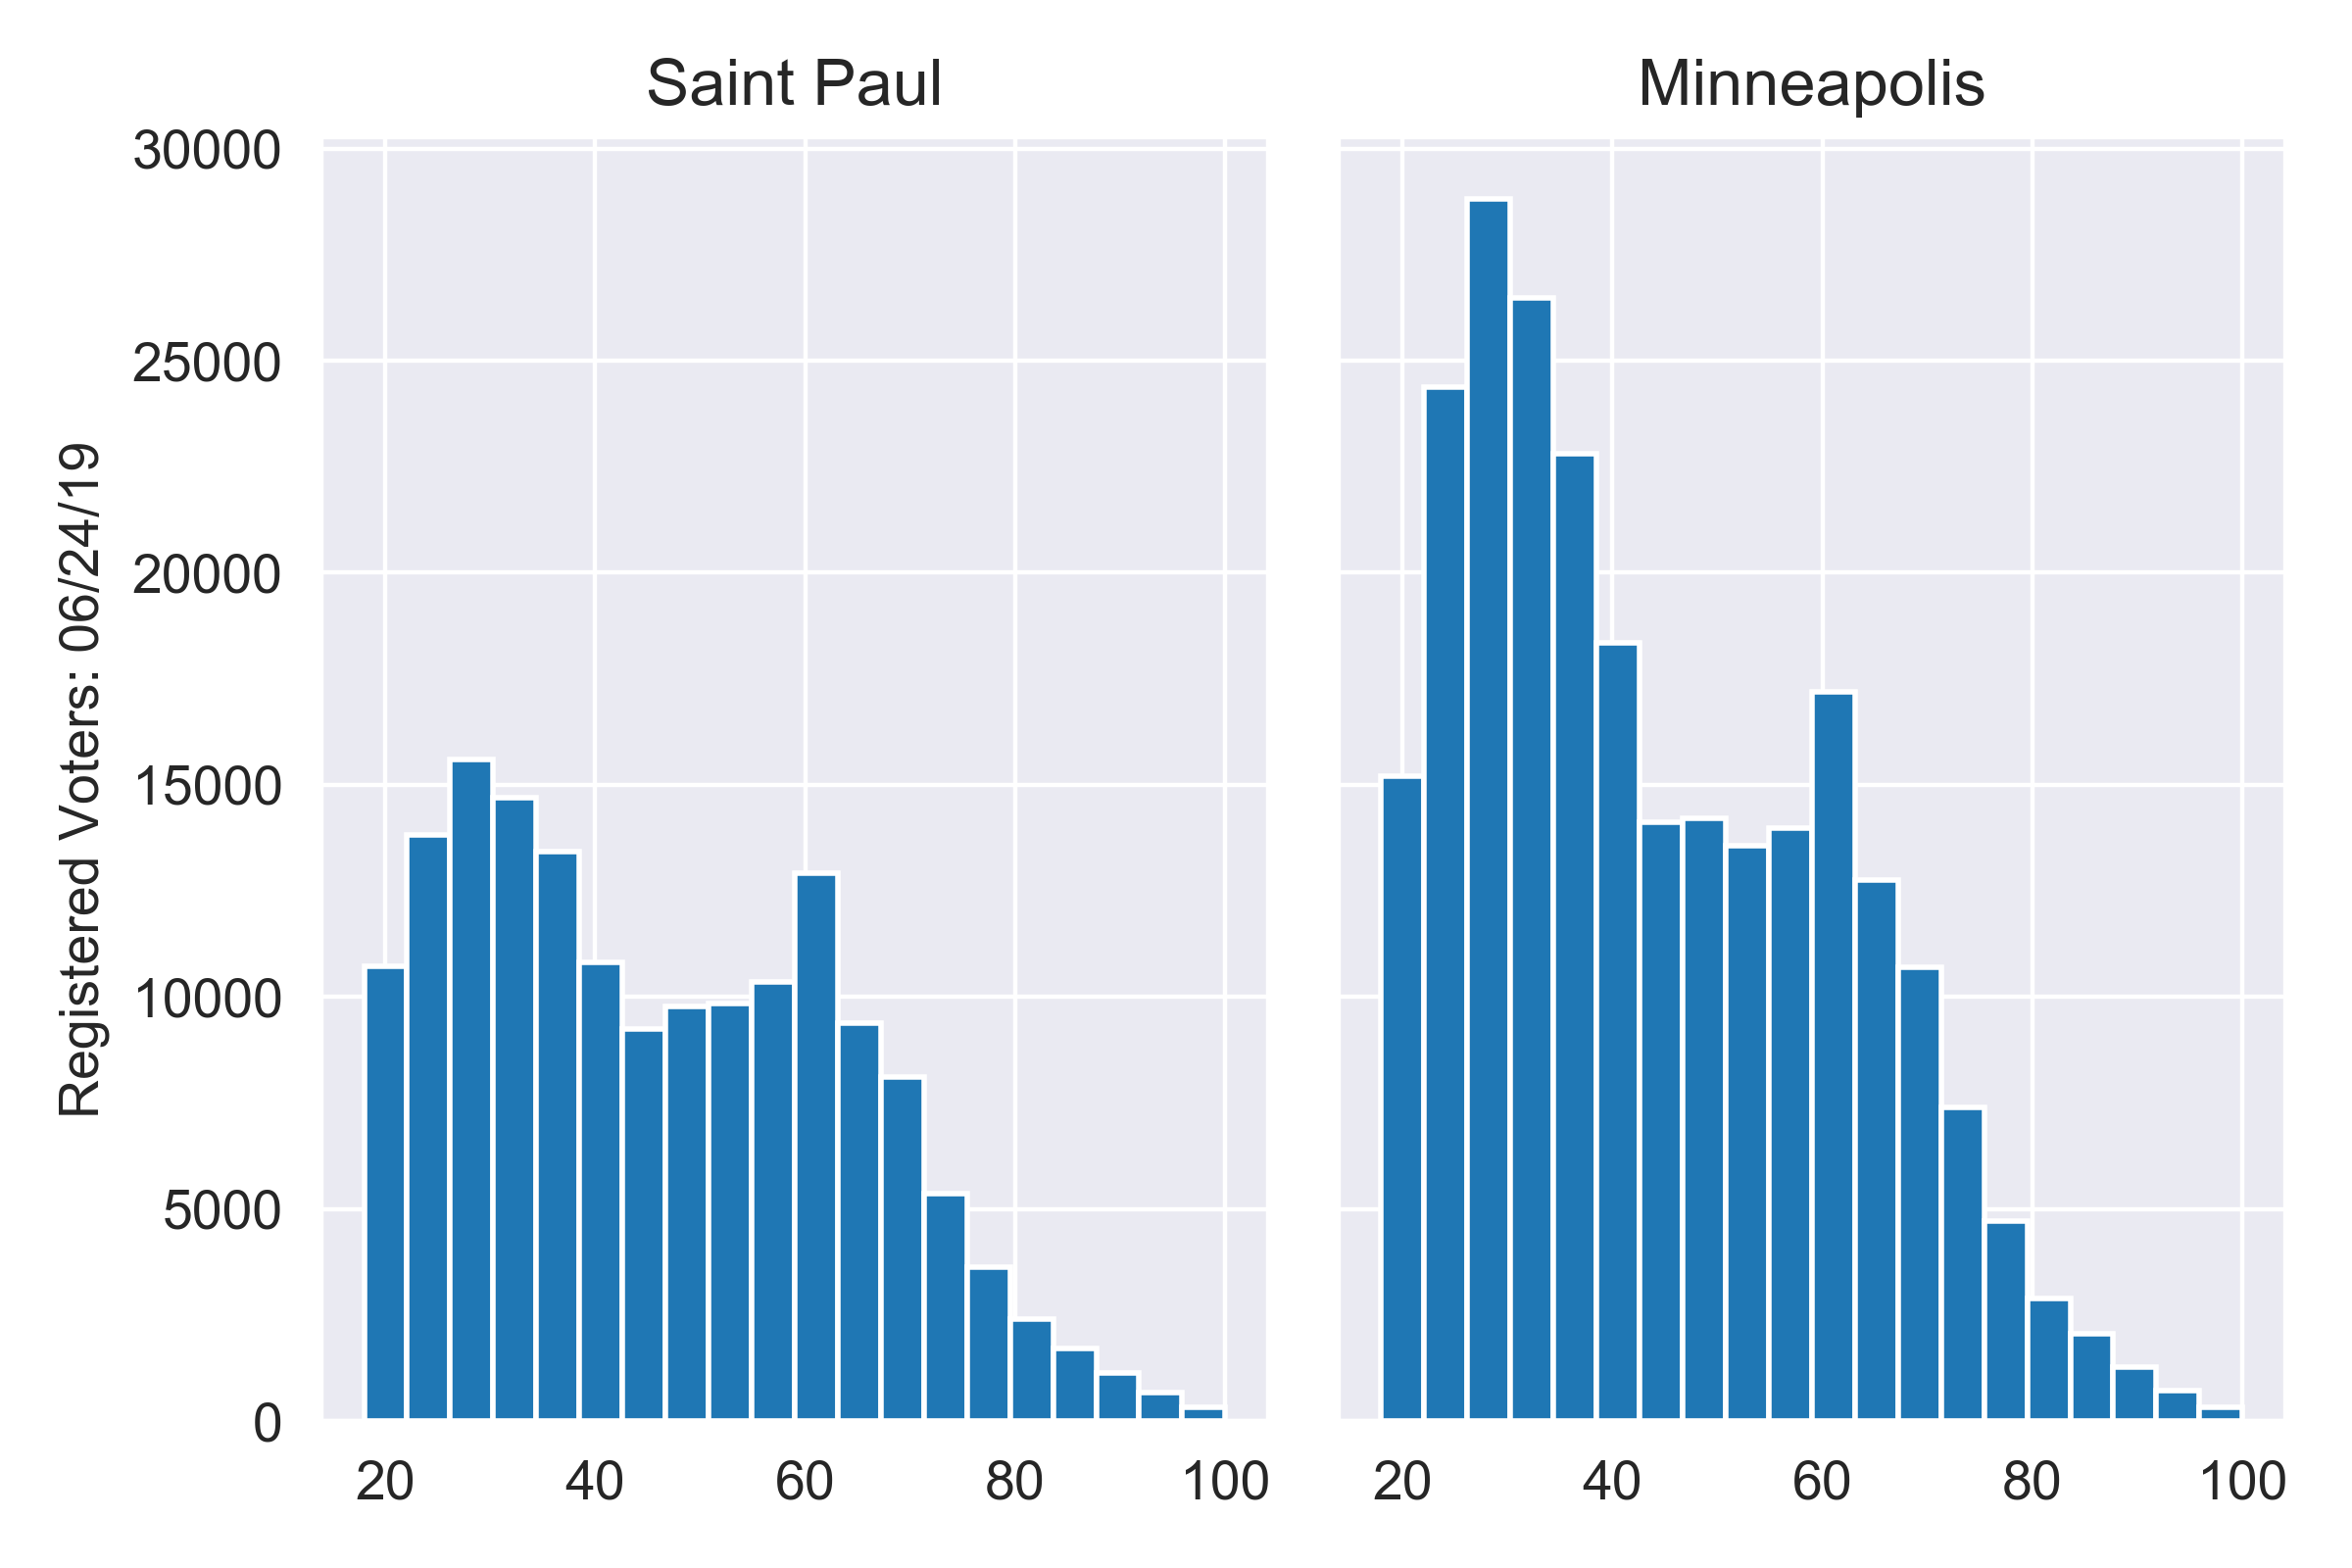
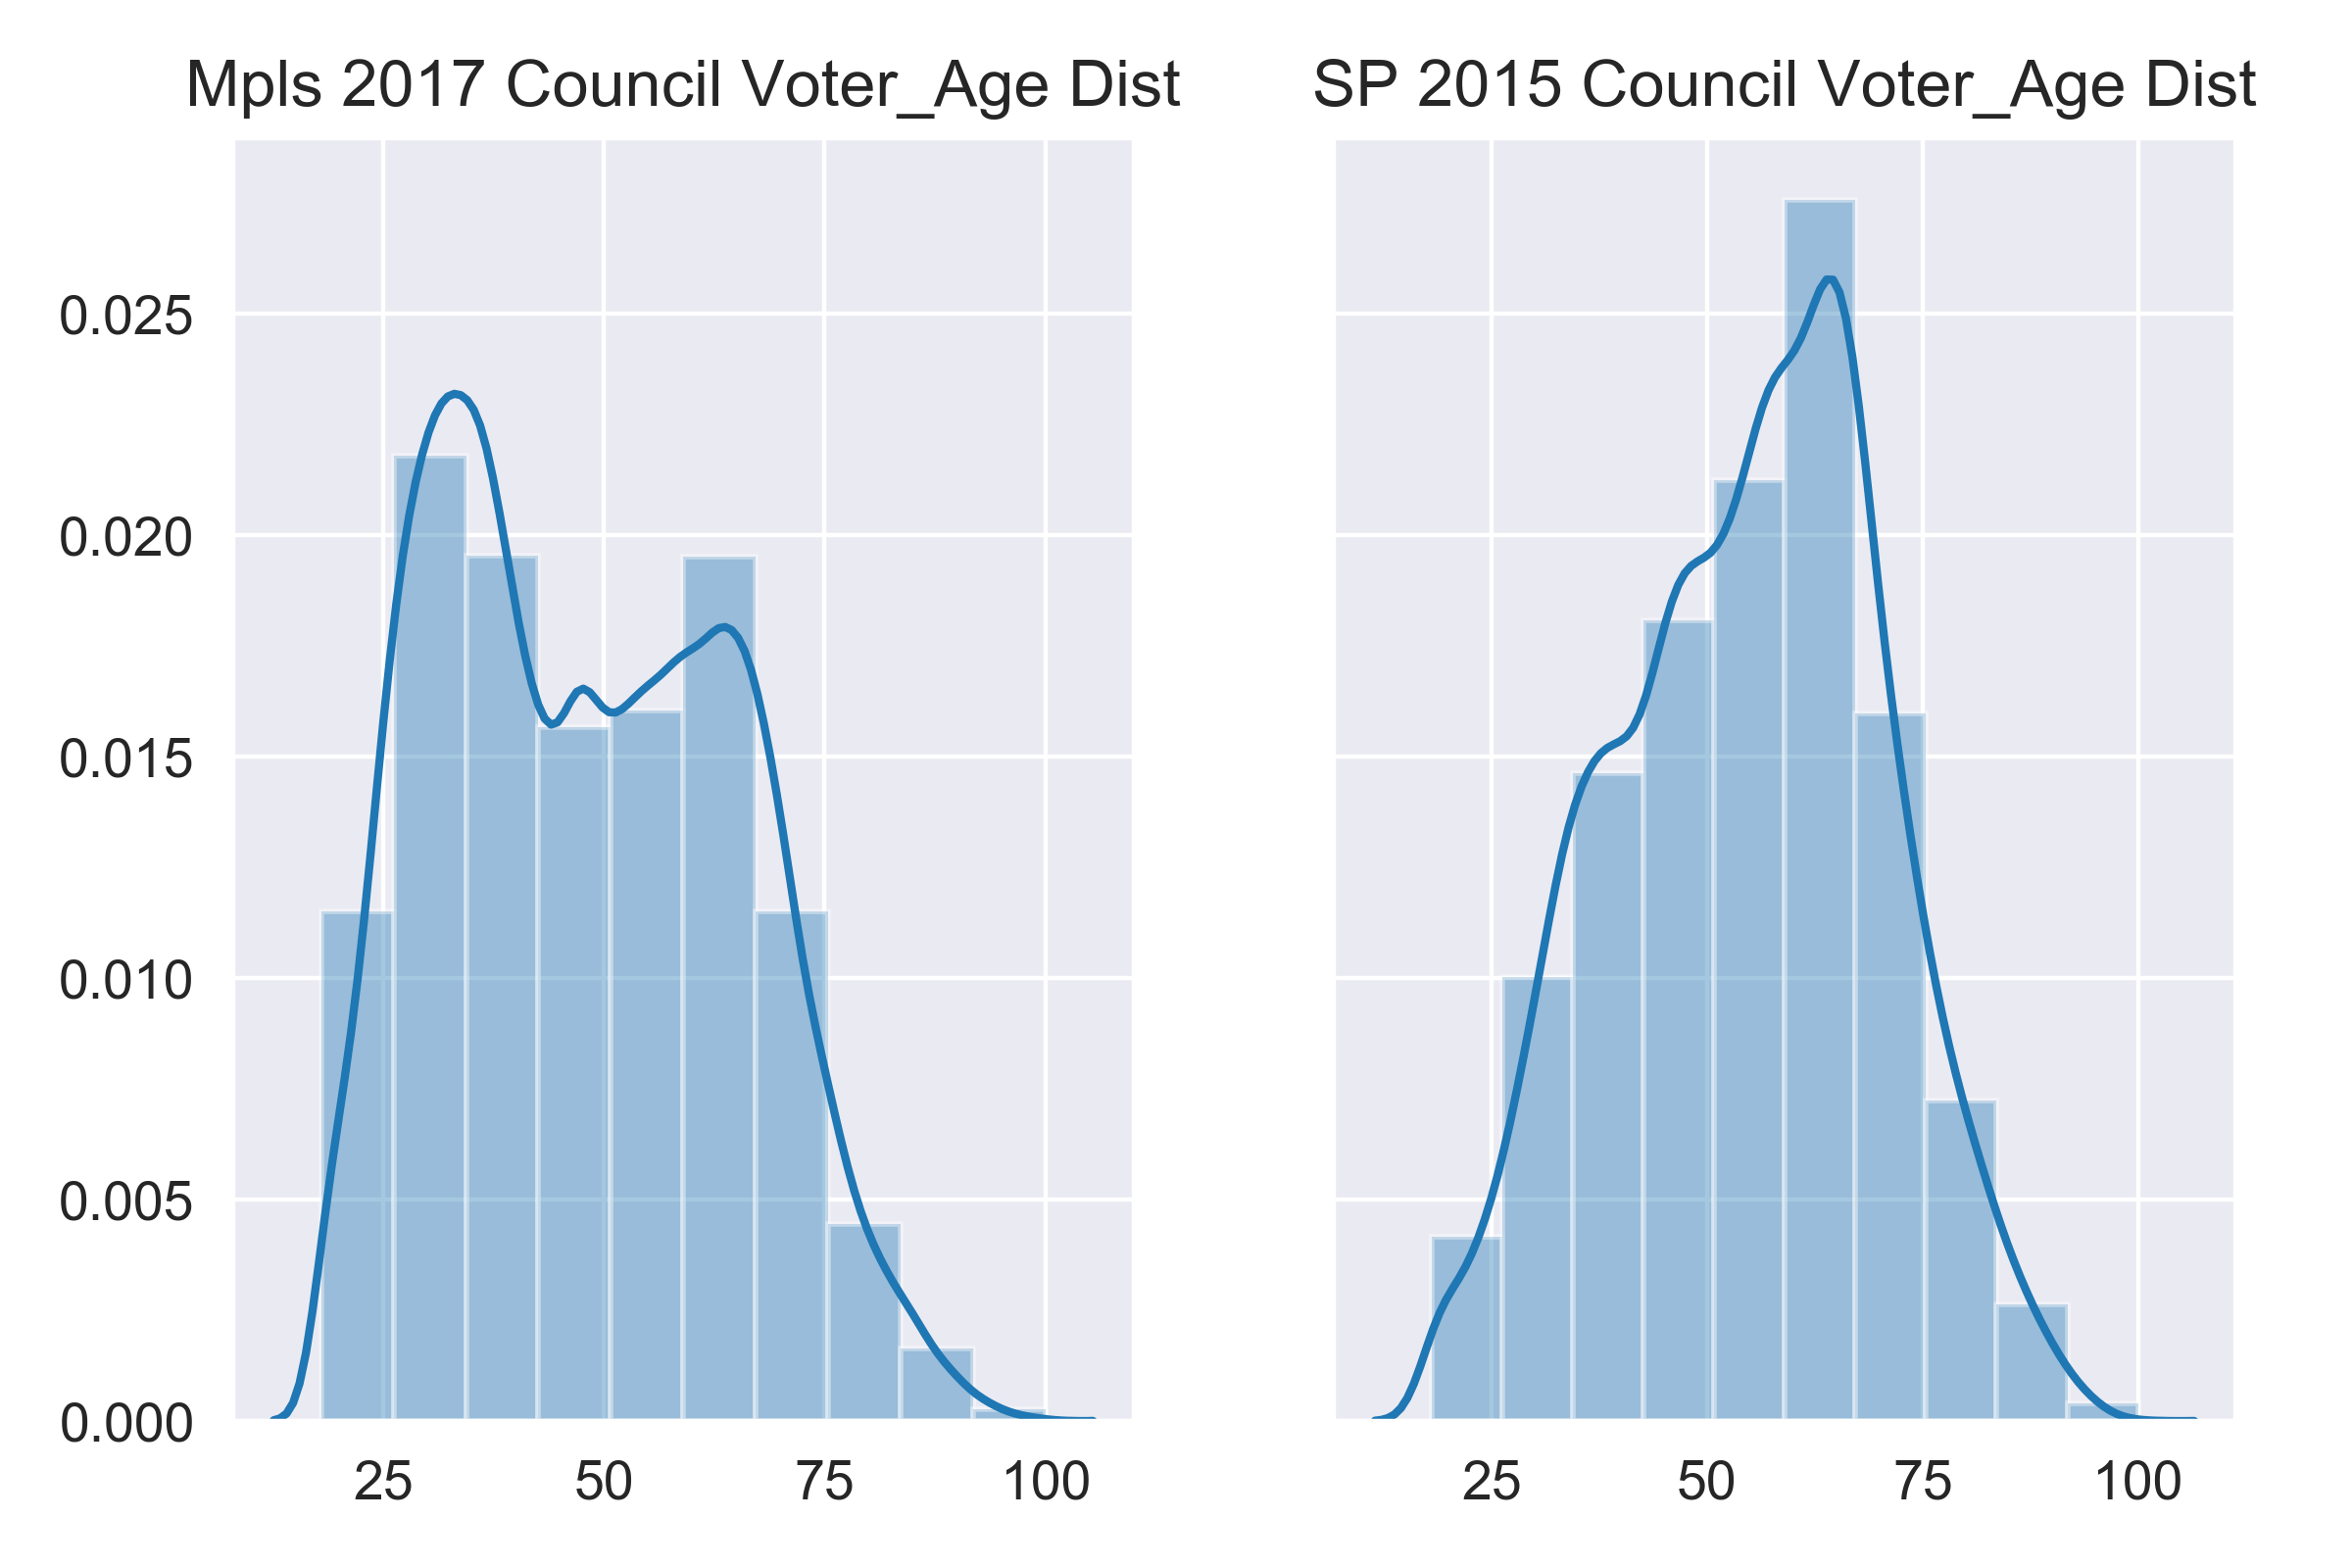
First, let’s explore the age demographic relationship between Saint Paul and Minneapolis as these two cities are closely connected. From the plots below, we see that Minneapolis has greater concentration of younger voters than Saint Paul, and the total number of voters are higher in general. For both cities, the younger adults make up the bulk of voting population.
When plotting the age distribution of each wards in Saint Paul, Ward 3 differed considerably from all the other wards as demonstrated below.
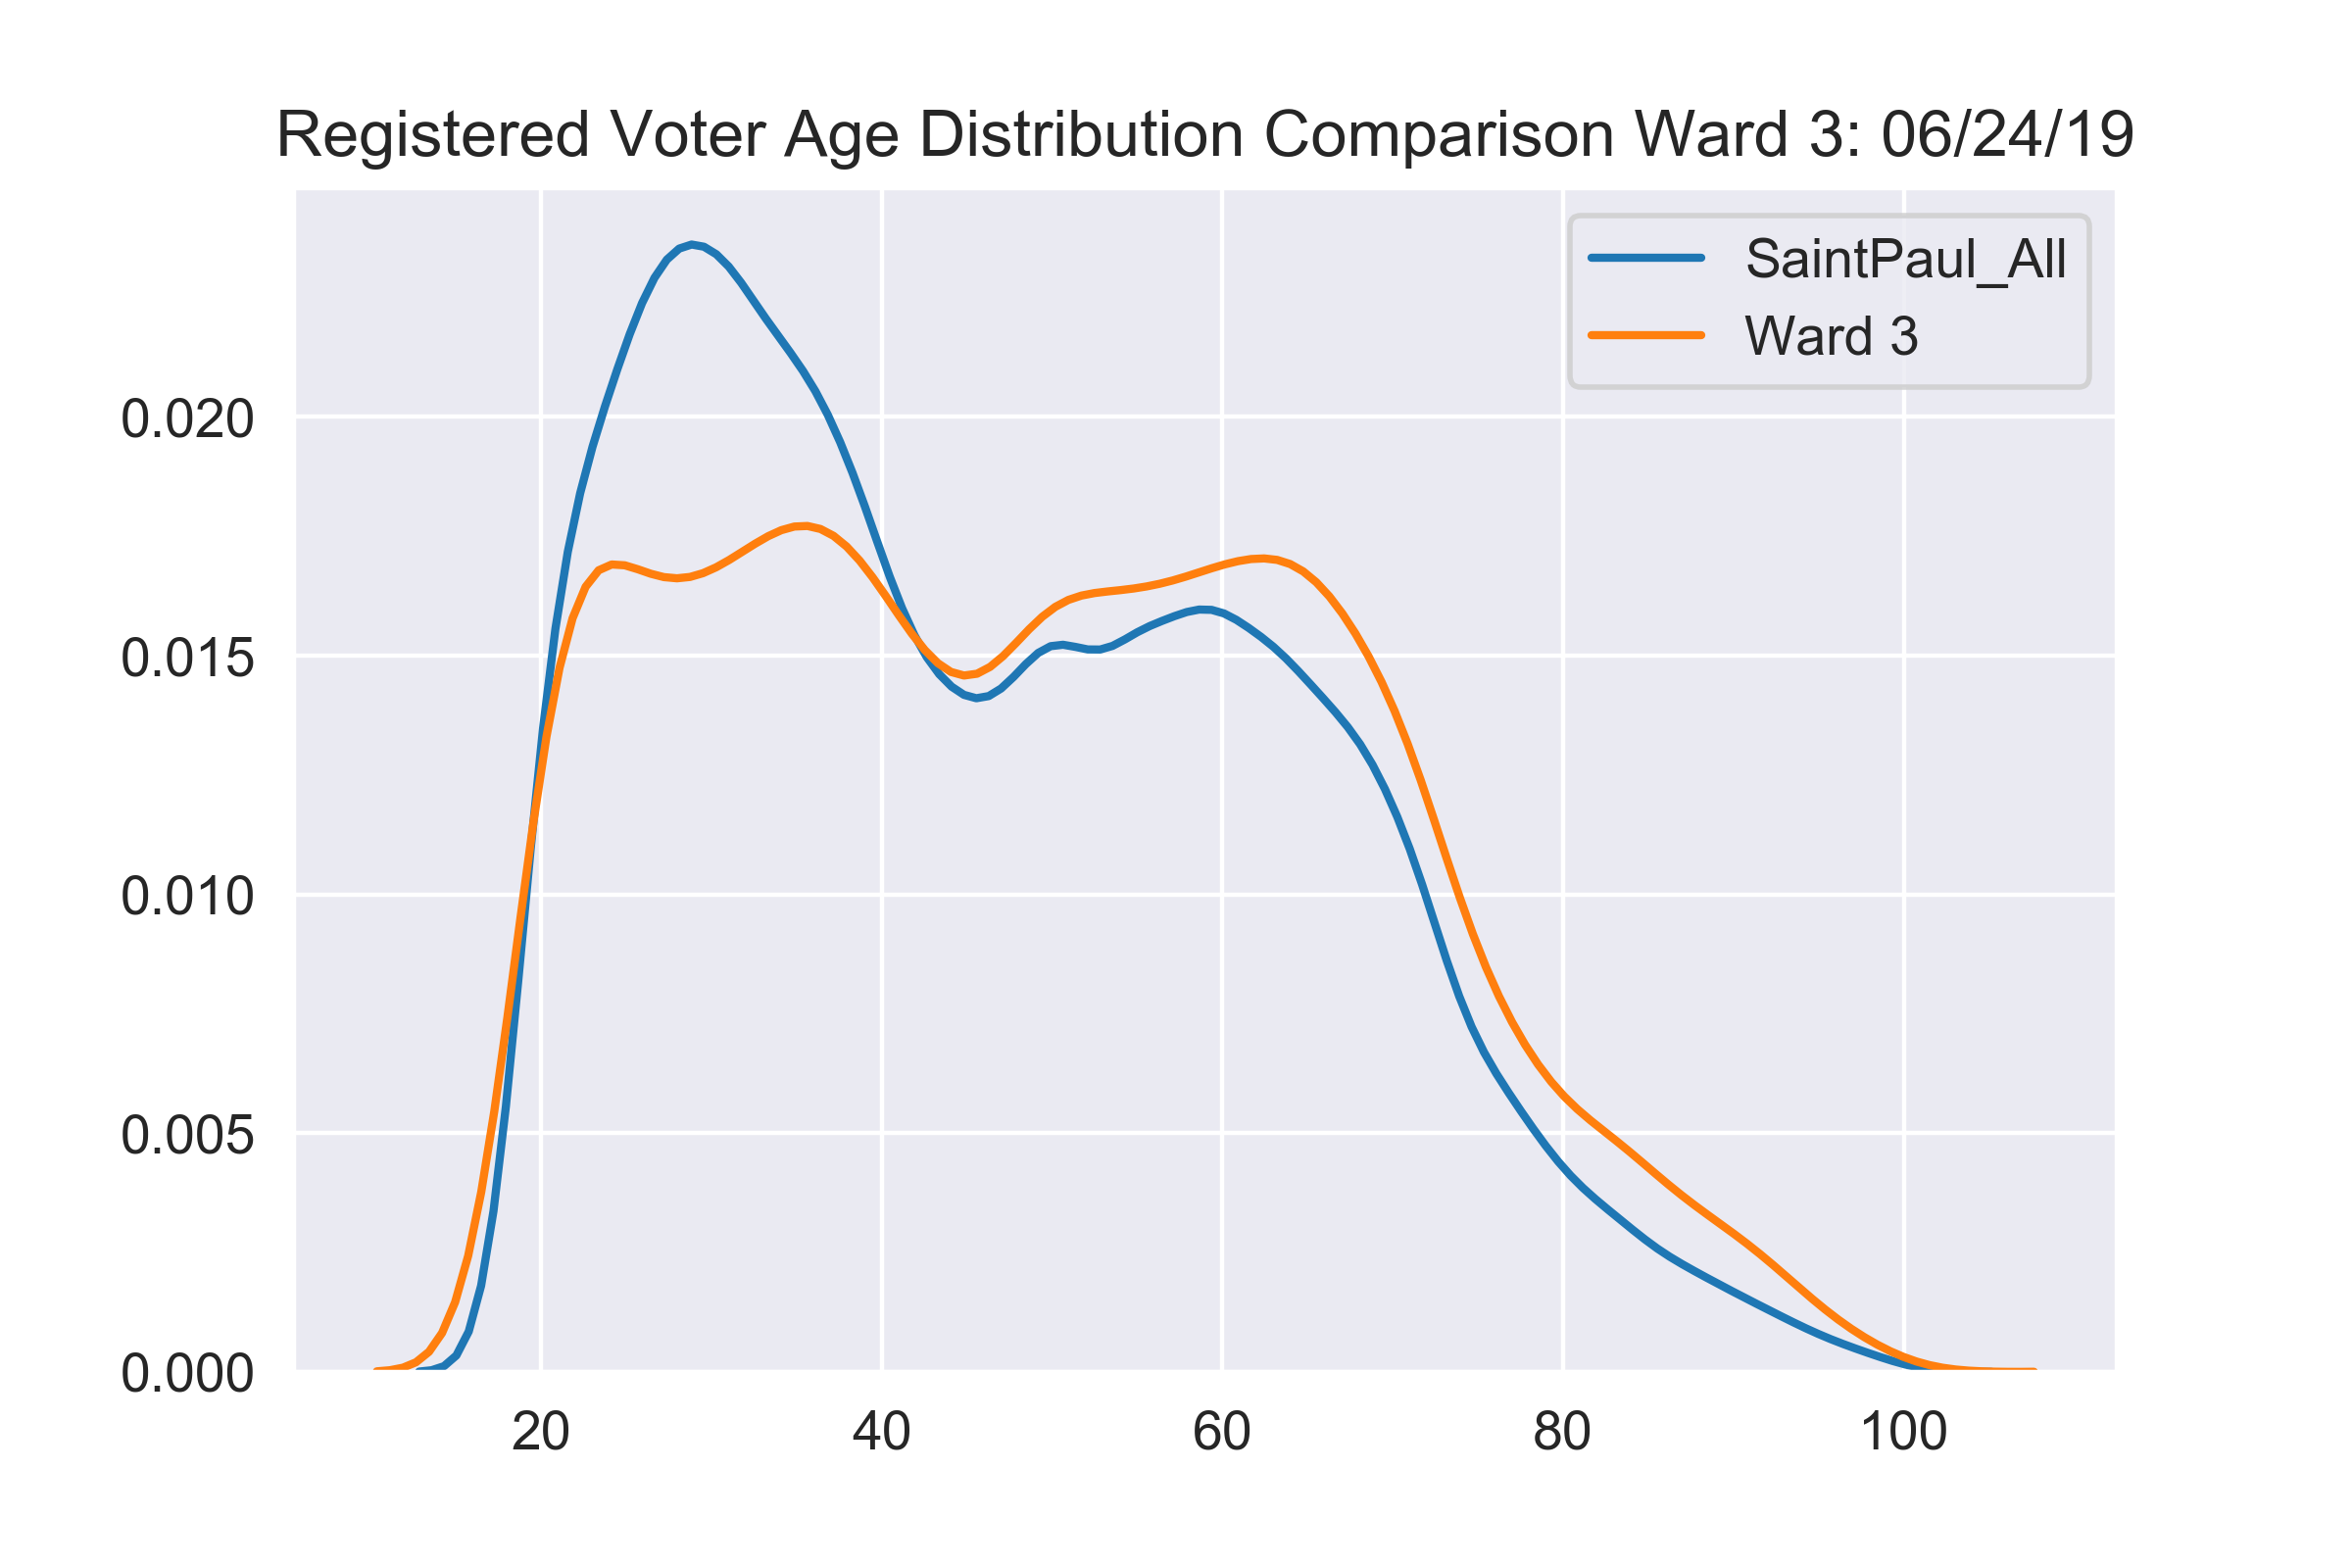
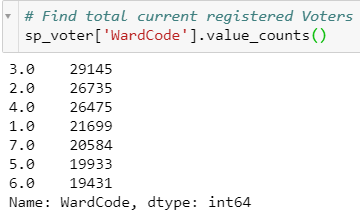
Finally, if we break down voter registration by ward, we see that Ward 3 has the most registered voters with around 50% more registered voters than Ward 5 & 6 respectively. Ward 3 has considerable influence in impacting the mayor election.
Voting Trends: 
As explained in the Background section, local elections are only during the odd years. As many would expect, the turnout is low for local elections
The following graph below compares participation on city council election of Saint Paul and Minneapolis.
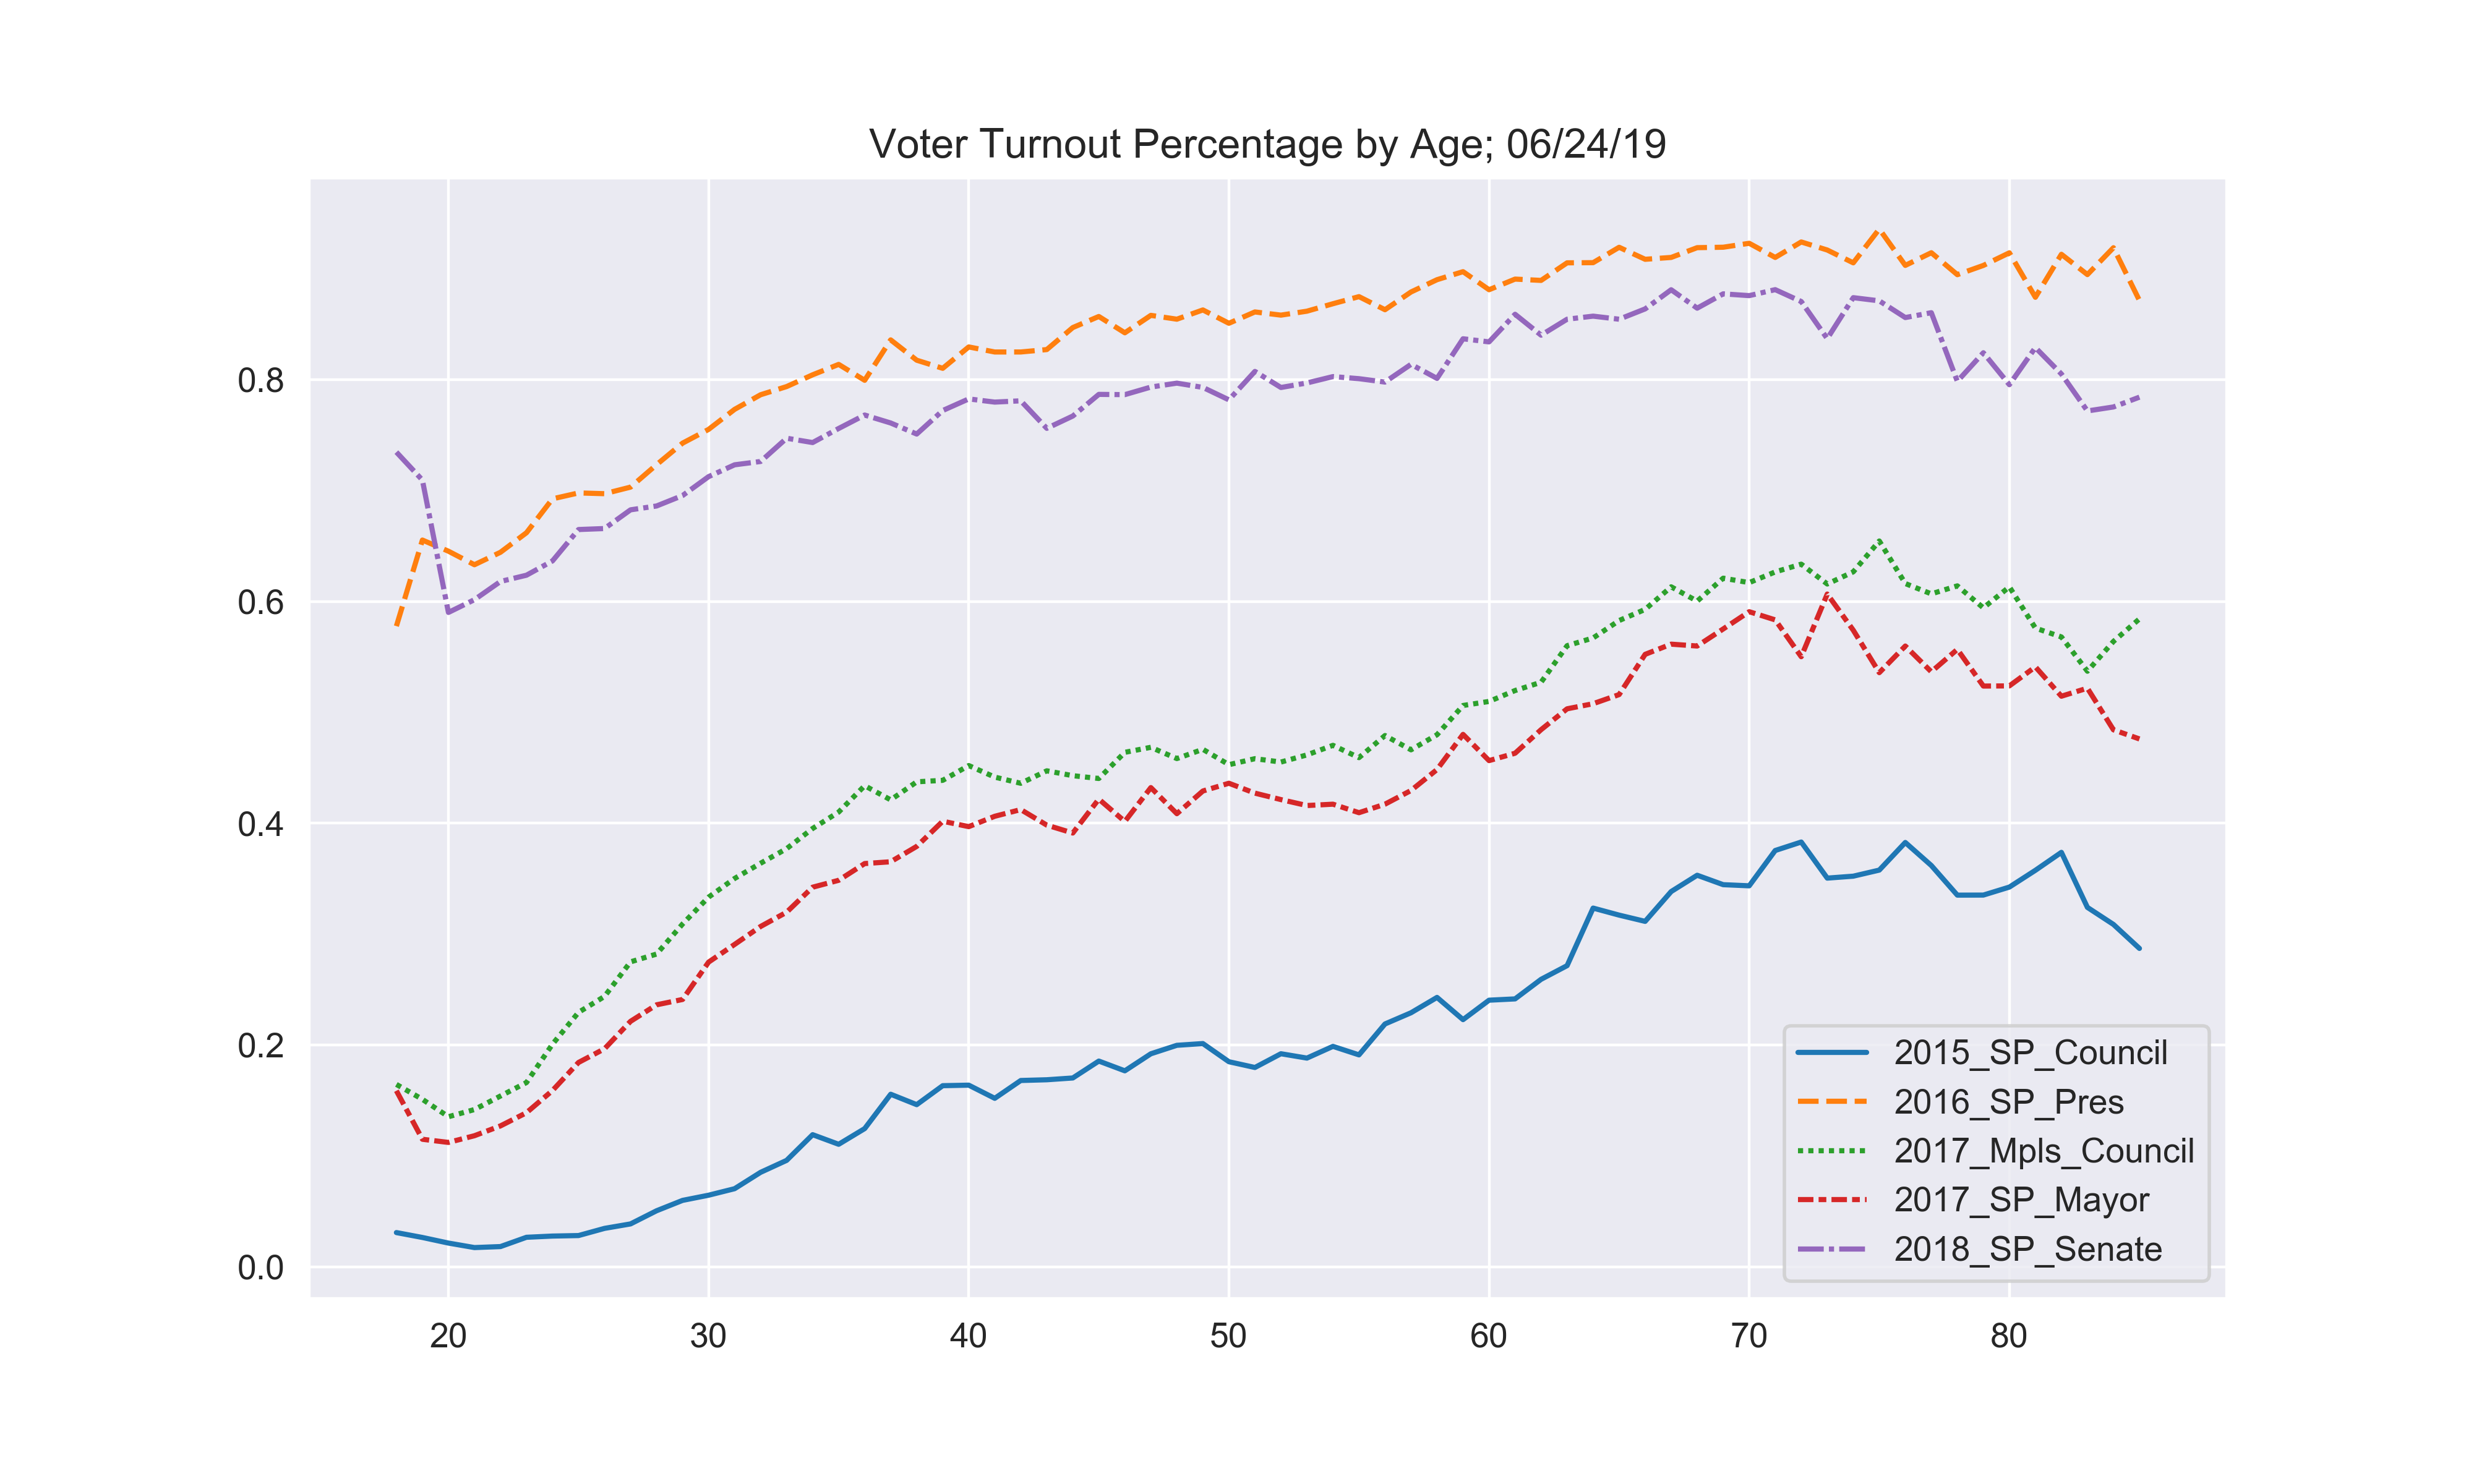
Finally, the graph below plots the voter participation rate by age group. Notice, the Saint Paul young adult participation is low despite being the larger demographic and Minneapolis has considerable voter turnout for their local election, which is probably directly related to having the mayoral and city council election at the same time.
Ward/Youth Vote: 
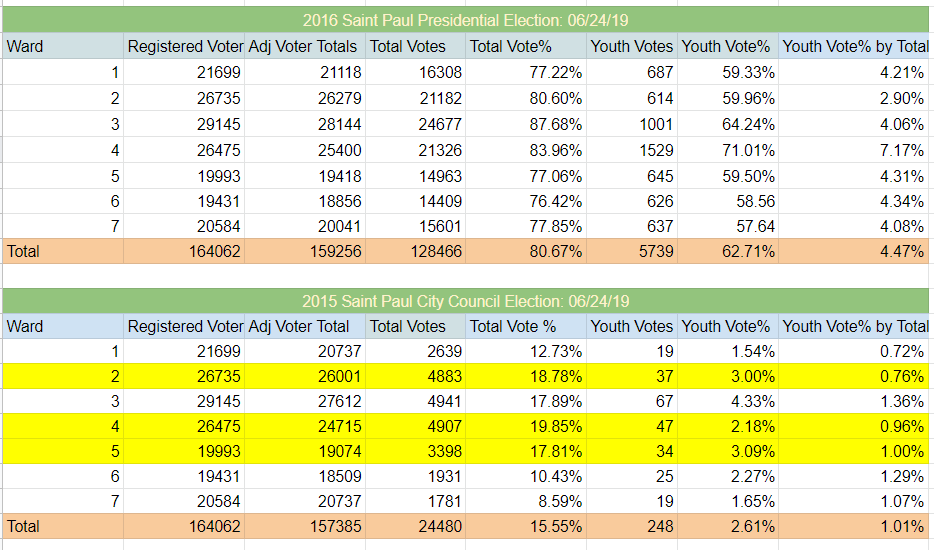
From the following tables below we see the voting and youth participation significantly less for the city council election in comparison to the presidential election. The competitive wards, highlighted in yellow, have greater voter turnout. Though Ward 3 had a moderate turnout despite not being a competitive race. Note: I used Google Sheet because it has conditional color formating.
Precinct Analysis: Fragmentation 
The maps have considerable implications, so I will explain the methodology in more detail. This calculations assumes that each precinct should vote at equal rate in comparison to neighboring precincts. For each precinct, I create three column calculations:
- Projected Weight: (The total registered voters on precinct) / (The total registered voters within Ward)
- Actual Weight: (The total actual votes on precinct) / (The total actual voters within Ward)
- Representation: (Actual Weight) - (Projected Weight)
Ideally, the projected weight and actual weight should be near zero across precincts, so pay attention to the range of participation in the maps below. A precinct can be over-represented because a certain precinct votes in greater frequency than other precincts and/or precincts have been excluded from participation. Finally, there is typically less registered voters in lower-income and immigrant communities. If we incorporate this, the projected weights for those precincts will be greater and the under-representation is higher in those precincts than displayed.
Ward 1 Precinct Analysis 
P_15.query('Ward==1')
| Ward | Precinct | Tot_Vote | Tot_Reg | Vote% | H_Dens% | H_Dens_Vote% | L_Dens_Vote% | Pro_Weight | Act_Weight | Representation | |
|---|---|---|---|---|---|---|---|---|---|---|---|
| 0 | 1.0 | Saint Paul W-1 P-1 | 279.0 | 1126 | 24.78 | 15.54 | 10.29 | 27.44 | 5.43 | 10.58 | 5.15 |
| 1 | 1.0 | Saint Paul W-1 P-10 | 35.0 | 442 | 7.92 | 15.16 | 5.97 | 8.27 | 2.13 | 1.33 | -0.80 |
| 2 | 1.0 | Saint Paul W-1 P-11 | 123.0 | 1067 | 11.53 | 42.36 | 12.83 | 10.57 | 5.15 | 4.66 | -0.49 |
| 3 | 1.0 | Saint Paul W-1 P-12 | 66.0 | 328 | 20.12 | 32.32 | 14.15 | 22.97 | 1.58 | 2.50 | 0.92 |
| 4 | 1.0 | Saint Paul W-1 P-13 | 175.0 | 1135 | 15.42 | 27.05 | 10.10 | 17.39 | 5.47 | 6.64 | 1.17 |
| 5 | 1.0 | Saint Paul W-1 P-14 | 126.0 | 925 | 13.62 | 28.65 | 24.91 | 9.09 | 4.46 | 4.78 | 0.32 |
| 6 | 1.0 | Saint Paul W-1 P-15 | 37.0 | 700 | 5.29 | 11.57 | 6.17 | 5.17 | 3.38 | 1.40 | -1.98 |
| 7 | 1.0 | Saint Paul W-1 P-16 | 31.0 | 235 | 13.19 | 8.51 | 0.00 | 14.42 | 1.13 | 1.18 | 0.05 |
| 8 | 1.0 | Saint Paul W-1 P-2 | 268.0 | 2046 | 13.10 | 32.70 | 6.43 | 16.34 | 9.87 | 10.16 | 0.29 |
| 9 | 1.0 | Saint Paul W-1 P-3 | 174.0 | 1792 | 9.71 | 9.88 | 1.69 | 10.59 | 8.64 | 6.60 | -2.04 |
| 10 | 1.0 | Saint Paul W-1 P-4 | 137.0 | 1296 | 10.57 | 1.39 | 5.56 | 10.64 | 6.25 | 5.20 | -1.05 |
| 11 | 1.0 | Saint Paul W-1 P-5 | 144.0 | 1275 | 11.29 | 6.67 | 4.71 | 11.76 | 6.15 | 5.46 | -0.69 |
| 12 | 1.0 | Saint Paul W-1 P-6 | 331.0 | 2645 | 12.51 | 9.72 | 8.17 | 12.98 | 12.75 | 12.55 | -0.20 |
| 13 | 1.0 | Saint Paul W-1 P-7 | 264.0 | 1444 | 18.28 | 15.72 | 3.96 | 20.95 | 6.96 | 10.01 | 3.05 |
| 14 | 1.0 | Saint Paul W-1 P-8 | 269.0 | 2104 | 12.79 | 53.99 | 10.48 | 15.50 | 10.15 | 10.20 | 0.05 |
| 15 | 1.0 | Saint Paul W-1 P-9 | 178.0 | 2177 | 8.18 | 12.17 | 4.53 | 8.68 | 10.50 | 6.75 | -3.75 |
map_2015_SP_CityCouncilRepresentation_byPrecinct(1)
P_15.query('Ward==2')
| Ward | Precinct | Tot_Vote | Tot_Reg | Vote% | H_Dens% | H_Dens_Vote% | L_Dens_Vote% | Pro_Weight | Act_Weight | Representation | |
|---|---|---|---|---|---|---|---|---|---|---|---|
| 16 | 2.0 | Saint Paul W-2 P-1 | 434.0 | 1571 | 27.63 | 18.97 | 6.71 | 32.52 | 6.04 | 8.89 | 2.85 |
| 17 | 2.0 | Saint Paul W-2 P-11 | 351.0 | 2841 | 12.35 | 99.16 | 12.21 | 29.17 | 10.93 | 7.19 | -3.74 |
| 18 | 2.0 | Saint Paul W-2 P-13 | 347.0 | 1500 | 23.13 | 23.67 | 15.77 | 25.41 | 5.77 | 7.10 | 1.33 |
| 19 | 2.0 | Saint Paul W-2 P-14 | 304.0 | 1669 | 18.21 | 5.03 | 5.95 | 18.86 | 6.42 | 6.22 | -0.20 |
| 20 | 2.0 | Saint Paul W-2 P-15 | 290.0 | 2574 | 11.27 | 12.74 | 8.23 | 11.71 | 9.90 | 5.94 | -3.96 |
| 21 | 2.0 | Saint Paul W-2 P-2 | 450.0 | 1653 | 27.22 | 16.82 | 11.15 | 30.47 | 6.36 | 9.21 | 2.85 |
| 22 | 2.0 | Saint Paul W-2 P-3 | 446.0 | 2571 | 17.35 | 22.36 | 5.04 | 20.89 | 9.89 | 9.13 | -0.76 |
| 23 | 2.0 | Saint Paul W-2 P-4 | 298.0 | 1519 | 19.62 | 30.48 | 8.86 | 24.34 | 5.84 | 6.10 | 0.26 |
| 24 | 2.0 | Saint Paul W-2 P-5 | 524.0 | 2323 | 22.56 | 15.80 | 10.35 | 24.85 | 8.93 | 10.73 | 1.80 |
| 25 | 2.0 | Saint Paul W-2 P-6 | 104.0 | 603 | 17.25 | 73.80 | 15.73 | 21.52 | 2.32 | 2.13 | -0.19 |
| 26 | 2.0 | Saint Paul W-2 P-7 | 375.0 | 2194 | 17.09 | 50.96 | 10.20 | 24.26 | 8.44 | 7.68 | -0.76 |
| 27 | 2.0 | Saint Paul W-2 P-8 | 157.0 | 1211 | 12.96 | 83.24 | 12.00 | 17.73 | 4.66 | 3.21 | -1.45 |
| 28 | 2.0 | Saint Paul W-2 P-9 | 367.0 | 1998 | 18.37 | 95.80 | 18.55 | 14.29 | 7.68 | 7.51 | -0.17 |
map_2015_SP_CityCouncilRepresentation_byPrecinct(2)
Ward 3 Precinct Analysis 

P_15.query('Ward==3')
| Ward | Precinct | Tot_Vote | Tot_Reg | Vote% | H_Dens% | H_Dens_Vote% | L_Dens_Vote% | Pro_Weight | Act_Weight | Representation | |
|---|---|---|---|---|---|---|---|---|---|---|---|
| 29 | 3.0 | Saint Paul W-3 P-1 | 399.0 | 1986 | 20.09 | 3.37 | 5.97 | 20.58 | 7.19 | 8.08 | 0.89 |
| 30 | 3.0 | Saint Paul W-3 P-10 | 257.0 | 1446 | 17.77 | 4.98 | 2.78 | 18.56 | 5.24 | 5.20 | -0.04 |
| 31 | 3.0 | Saint Paul W-3 P-11 | 157.0 | 1909 | 8.22 | 70.46 | 9.96 | 4.08 | 6.91 | 3.18 | -3.73 |
| 32 | 3.0 | Saint Paul W-3 P-12 | 330.0 | 1745 | 18.91 | 12.66 | 2.26 | 21.33 | 6.32 | 6.68 | 0.36 |
| 33 | 3.0 | Saint Paul W-3 P-13 | 389.0 | 1812 | 21.47 | 19.92 | 19.67 | 21.92 | 6.56 | 7.88 | 1.32 |
| 34 | 3.0 | Saint Paul W-3 P-14 | 656.0 | 3516 | 18.66 | 6.14 | 24.07 | 18.30 | 12.73 | 13.28 | 0.55 |
| 35 | 3.0 | Saint Paul W-3 P-2 | 522.0 | 2411 | 21.65 | 7.18 | 5.78 | 22.88 | 8.73 | 10.57 | 1.84 |
| 36 | 3.0 | Saint Paul W-3 P-3 | 413.0 | 2655 | 15.56 | 23.05 | 9.64 | 17.33 | 9.62 | 8.36 | -1.26 |
| 37 | 3.0 | Saint Paul W-3 P-4 | 281.0 | 1216 | 23.11 | 36.92 | 21.60 | 23.99 | 4.40 | 5.69 | 1.29 |
| 38 | 3.0 | Saint Paul W-3 P-5 | 261.0 | 1901 | 13.73 | 55.44 | 12.71 | 14.99 | 6.88 | 5.28 | -1.60 |
| 39 | 3.0 | Saint Paul W-3 P-6 | 339.0 | 2093 | 16.20 | 9.56 | 7.00 | 17.17 | 7.58 | 6.86 | -0.72 |
| 40 | 3.0 | Saint Paul W-3 P-7 | 178.0 | 933 | 19.08 | 31.83 | 8.42 | 24.06 | 3.38 | 3.60 | 0.22 |
| 41 | 3.0 | Saint Paul W-3 P-8 | 319.0 | 1546 | 20.63 | 5.37 | 1.20 | 21.74 | 5.60 | 6.46 | 0.86 |
| 42 | 3.0 | Saint Paul W-3 P-9 | 438.0 | 2443 | 17.93 | 15.23 | 9.68 | 19.41 | 8.85 | 8.87 | 0.02 |
map_2015_SP_CityCouncilRepresentation_byPrecinct(3)
Ward 4 Precinct Analysis (Competitive) 
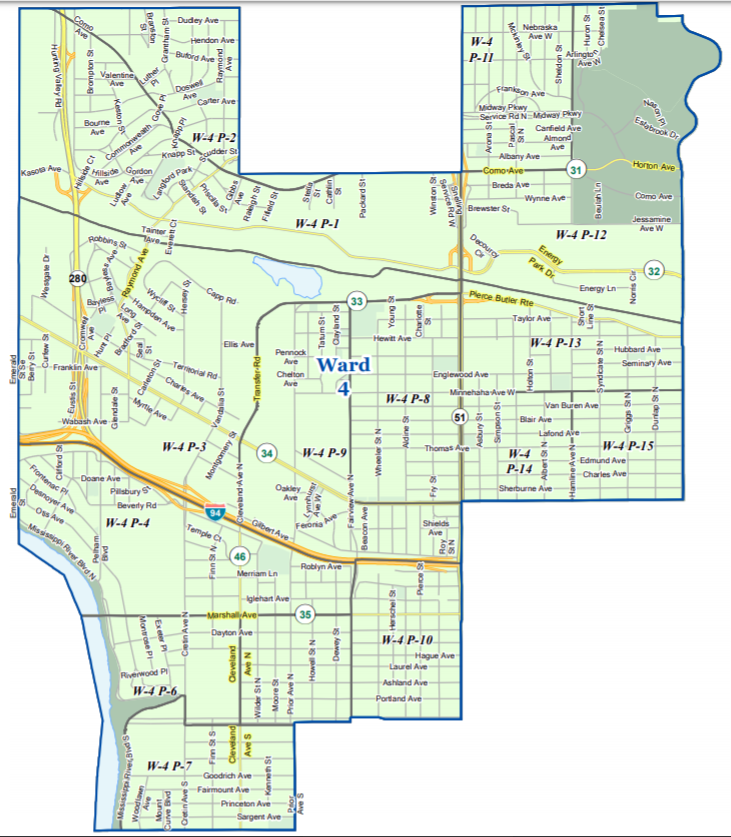
P_15.query('Ward==4')
| Ward | Precinct | Tot_Vote | Tot_Reg | Vote% | H_Dens% | H_Dens_Vote% | L_Dens_Vote% | Pro_Weight | Act_Weight | Representation | |
|---|---|---|---|---|---|---|---|---|---|---|---|
| 43 | 4.0 | Saint Paul W-4 P-1 | 417.0 | 1582 | 26.36 | 17.64 | 8.60 | 30.16 | 6.40 | 8.50 | 2.10 |
| 44 | 4.0 | Saint Paul W-4 P-10 | 447.0 | 1961 | 22.79 | 8.26 | 7.41 | 24.18 | 7.93 | 9.11 | 1.18 |
| 45 | 4.0 | Saint Paul W-4 P-11 | 492.0 | 2128 | 23.12 | 15.74 | 14.63 | 24.71 | 8.61 | 10.03 | 1.42 |
| 46 | 4.0 | Saint Paul W-4 P-12 | 185.0 | 1679 | 11.02 | 59.02 | 4.74 | 20.06 | 6.79 | 3.77 | -3.02 |
| 47 | 4.0 | Saint Paul W-4 P-13 | 258.0 | 1336 | 19.31 | 17.44 | 20.60 | 19.04 | 5.41 | 5.26 | -0.15 |
| 48 | 4.0 | Saint Paul W-4 P-14 | 291.0 | 1395 | 20.86 | 4.23 | 0.00 | 21.78 | 5.64 | 5.93 | 0.29 |
| 49 | 4.0 | Saint Paul W-4 P-15 | 292.0 | 1500 | 19.47 | 8.13 | 2.46 | 20.97 | 6.07 | 5.95 | -0.12 |
| 50 | 4.0 | Saint Paul W-4 P-2 | 478.0 | 1264 | 37.82 | 8.31 | 40.00 | 37.62 | 5.11 | 9.75 | 4.64 |
| 51 | 4.0 | Saint Paul W-4 P-3 | 182.0 | 2281 | 7.98 | 73.70 | 5.12 | 16.00 | 9.23 | 3.71 | -5.52 |
| 52 | 4.0 | Saint Paul W-4 P-4 | 362.0 | 1752 | 20.66 | 7.13 | 7.20 | 21.70 | 7.09 | 7.38 | 0.29 |
| 53 | 4.0 | Saint Paul W-4 P-5 | 278.0 | 1253 | 22.19 | 9.10 | 4.39 | 23.97 | 5.07 | 5.67 | 0.60 |
| 54 | 4.0 | Saint Paul W-4 P-6 | 147.0 | 1102 | 13.34 | 43.56 | 2.50 | 21.70 | 4.46 | 3.00 | -1.46 |
| 55 | 4.0 | Saint Paul W-4 P-7 | 405.0 | 1714 | 23.63 | 15.34 | 4.56 | 27.08 | 6.94 | 8.26 | 1.32 |
| 56 | 4.0 | Saint Paul W-4 P-8 | 401.0 | 2129 | 18.84 | 13.34 | 4.23 | 21.08 | 8.61 | 8.18 | -0.43 |
| 57 | 4.0 | Saint Paul W-4 P-9 | 270.0 | 1639 | 16.47 | 33.44 | 21.53 | 13.93 | 6.63 | 5.50 | -1.13 |
map_2015_SP_CityCouncilRepresentation_byPrecinct(4)
Ward 5 Precinct Analysis (Competitive) 
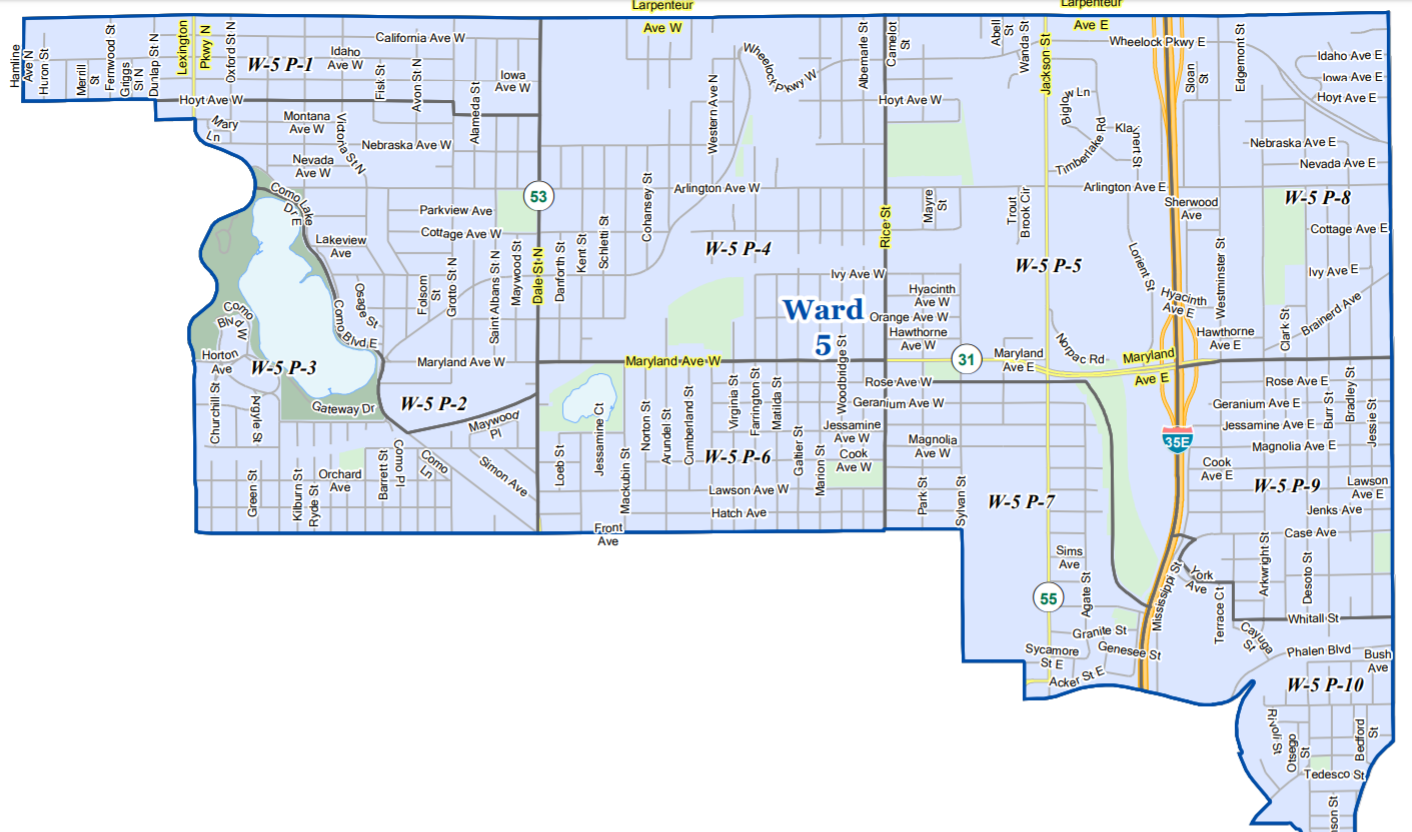
P_15.query('Ward==5')
| Ward | Precinct | Tot_Vote | Tot_Reg | Vote% | H_Dens% | H_Dens_Vote% | L_Dens_Vote% | Pro_Weight | Act_Weight | Representation | |
|---|---|---|---|---|---|---|---|---|---|---|---|
| 58 | 5.0 | Saint Paul W-5 P-1 | 485.0 | 1989 | 24.38 | 11.16 | 8.56 | 26.37 | 10.43 | 14.28 | 3.85 |
| 59 | 5.0 | Saint Paul W-5 P-10 | 47.0 | 619 | 7.59 | 12.76 | 20.25 | 5.74 | 3.25 | 1.38 | -1.87 |
| 60 | 5.0 | Saint Paul W-5 P-2 | 916.0 | 2411 | 37.99 | 7.18 | 21.97 | 39.23 | 12.64 | 26.97 | 14.33 |
| 61 | 5.0 | Saint Paul W-5 P-3 | 627.0 | 2003 | 31.30 | 12.63 | 13.44 | 33.89 | 10.50 | 18.46 | 7.96 |
| 62 | 5.0 | Saint Paul W-5 P-4 | 466.0 | 3426 | 13.60 | 28.20 | 4.55 | 17.15 | 17.96 | 13.72 | -4.24 |
| 63 | 5.0 | Saint Paul W-5 P-5 | 181.0 | 1775 | 10.20 | 27.77 | 11.16 | 9.83 | 9.31 | 5.33 | -3.98 |
| 64 | 5.0 | Saint Paul W-5 P-6 | 195.0 | 1783 | 10.94 | 4.82 | 2.33 | 11.37 | 9.35 | 5.74 | -3.61 |
| 65 | 5.0 | Saint Paul W-5 P-7 | 112.0 | 1119 | 10.01 | 3.49 | 17.95 | 9.72 | 5.87 | 3.30 | -2.57 |
| 66 | 5.0 | Saint Paul W-5 P-8 | 219.0 | 2297 | 9.53 | 20.55 | 2.75 | 11.29 | 12.04 | 6.45 | -5.59 |
| 67 | 5.0 | Saint Paul W-5 P-9 | 148.0 | 1652 | 8.96 | 2.66 | 4.55 | 9.08 | 8.66 | 4.36 | -4.30 |
map_2015_SP_CityCouncilRepresentation_byPrecinct(5)
Ward 6 Precinct Analysis 
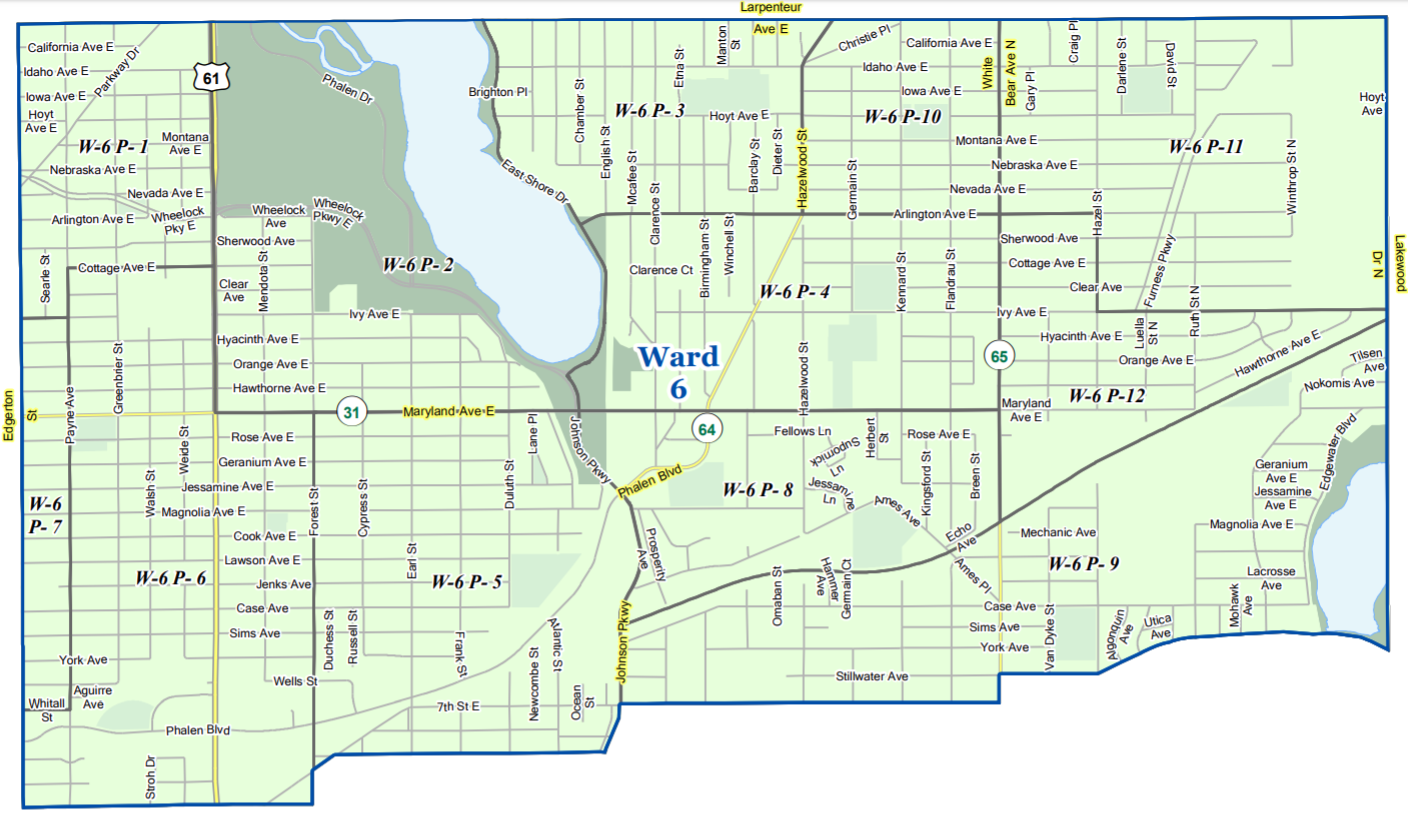
P_15.query('Ward==6')
| Ward | Precinct | Tot_Vote | Tot_Reg | Vote% | H_Dens% | H_Dens_Vote% | L_Dens_Vote% | Pro_Weight | Act_Weight | Representation | |
|---|---|---|---|---|---|---|---|---|---|---|---|
| 68 | 6.0 | Saint Paul W-6 P-1 | 165.0 | 1370 | 12.04 | 4.23 | 5.17 | 12.35 | 7.40 | 8.54 | 1.14 |
| 69 | 6.0 | Saint Paul W-6 P-10 | 115.0 | 977 | 11.77 | 13.92 | 21.32 | 10.23 | 5.28 | 5.96 | 0.68 |
| 70 | 6.0 | Saint Paul W-6 P-11 | 192.0 | 1627 | 11.80 | 1.84 | 13.33 | 11.77 | 8.79 | 9.94 | 1.15 |
| 71 | 6.0 | Saint Paul W-6 P-2 | 244.0 | 1236 | 19.74 | 4.85 | 11.67 | 20.15 | 6.68 | 12.64 | 5.96 |
| 72 | 6.0 | Saint Paul W-6 P-3 | 195.0 | 1493 | 13.06 | 2.41 | 2.78 | 13.32 | 8.07 | 10.10 | 2.03 |
| 73 | 6.0 | Saint Paul W-6 P-4 | 169.0 | 1867 | 9.05 | 15.43 | 3.12 | 10.13 | 10.09 | 8.75 | -1.34 |
| 74 | 6.0 | Saint Paul W-6 P-5 | 200.0 | 2052 | 9.75 | 3.31 | 0.00 | 10.08 | 11.09 | 10.36 | -0.73 |
| 75 | 6.0 | Saint Paul W-6 P-6 | 186.0 | 2391 | 7.78 | 4.56 | 3.67 | 7.98 | 12.92 | 9.63 | -3.29 |
| 76 | 6.0 | Saint Paul W-6 P-7 | 70.0 | 623 | 11.24 | 26.16 | 25.77 | 6.09 | 3.37 | 3.63 | 0.26 |
| 77 | 6.0 | Saint Paul W-6 P-8 | 129.0 | 1511 | 8.54 | 18.66 | 14.89 | 7.08 | 8.16 | 6.68 | -1.48 |
| 78 | 6.0 | Saint Paul W-6 P-9 | 163.0 | 2239 | 7.28 | 10.14 | 1.32 | 7.95 | 12.10 | 8.44 | -3.66 |
map_2015_SP_CityCouncilRepresentation_byPrecinct(6)
Ward 7 Precinct Analysis 
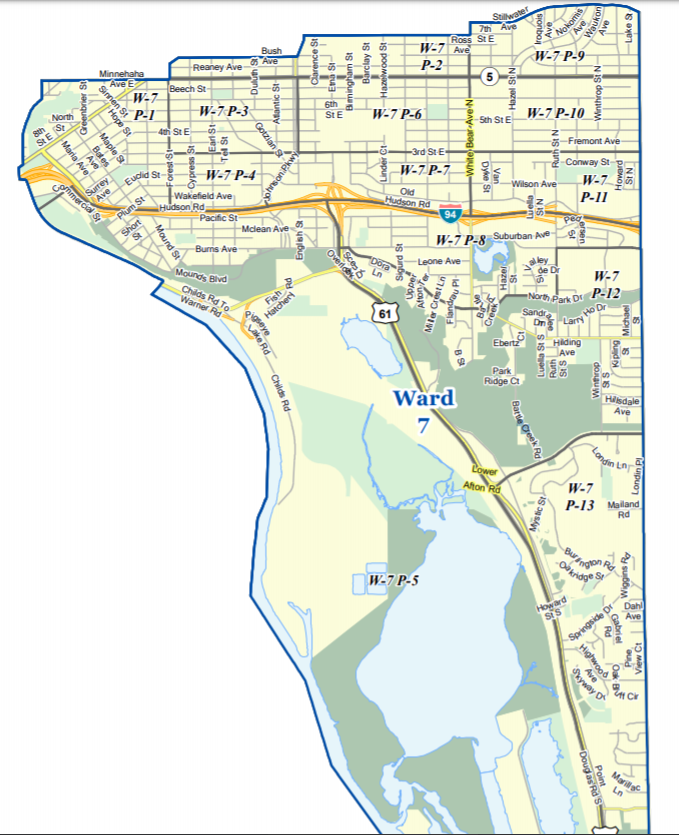
P_15.query('Ward==7')
| Ward | Precinct | Tot_Vote | Tot_Reg | Vote% | H_Dens% | H_Dens_Vote% | L_Dens_Vote% | Pro_Weight | Act_Weight | Representation | |
|---|---|---|---|---|---|---|---|---|---|---|---|
| 79 | 7.0 | Saint Paul W-7 P-1 | 191.0 | 2050 | 9.32 | 11.07 | 6.17 | 9.71 | 10.41 | 10.73 | 0.32 |
| 80 | 7.0 | Saint Paul W-7 P-10 | 106.0 | 1376 | 7.70 | 2.33 | 18.75 | 7.44 | 6.99 | 5.96 | -1.03 |
| 81 | 7.0 | Saint Paul W-7 P-11 | 63.0 | 1205 | 5.23 | 61.91 | 3.75 | 7.63 | 6.12 | 3.54 | -2.58 |
| 82 | 7.0 | Saint Paul W-7 P-12 | 266.0 | 2565 | 10.37 | 32.51 | 5.76 | 12.59 | 13.02 | 14.94 | 1.92 |
| 83 | 7.0 | Saint Paul W-7 P-13 | 244.0 | 1862 | 13.10 | 21.43 | 11.03 | 13.67 | 9.46 | 13.71 | 4.25 |
| 84 | 7.0 | Saint Paul W-7 P-2 | 71.0 | 1247 | 5.69 | 1.68 | 4.76 | 5.71 | 6.33 | 3.99 | -2.34 |
| 85 | 7.0 | Saint Paul W-7 P-3 | 96.0 | 1420 | 6.76 | 1.27 | 0.00 | 6.85 | 7.21 | 5.39 | -1.82 |
| 86 | 7.0 | Saint Paul W-7 P-4 | 75.0 | 894 | 8.39 | 12.98 | 12.93 | 7.71 | 4.54 | 4.21 | -0.33 |
| 87 | 7.0 | Saint Paul W-7 P-5 | 253.0 | 1348 | 18.77 | 19.88 | 21.64 | 18.06 | 6.85 | 14.21 | 7.36 |
| 88 | 7.0 | Saint Paul W-7 P-7 | 93.0 | 1190 | 7.82 | 22.69 | 11.85 | 6.63 | 6.04 | 5.22 | -0.82 |
| 89 | 7.0 | Saint Paul W-7 P-8 | 137.0 | 1672 | 8.19 | 12.68 | 1.42 | 9.18 | 8.49 | 7.70 | -0.79 |
| 90 | 7.0 | Saint Paul W-7 P-9 | 103.0 | 1508 | 6.83 | 5.90 | 0.00 | 7.26 | 7.66 | 5.79 | -1.87 |
map_2015_SP_CityCouncilRepresentation_byPrecinct(7)
Next Steps 
Hopefully, you have enjoyed reading this report and you are ready to take action. Here are some ways that you can make a difference and make this vision into a reality not in Saint Paul, but in your city/town:
Steps for everyone anywhere in the country (this is the point of the Open Data Project)
If your city has upcoming elections and filing date is still open. Run for political office now!
Share this report to other data experts and python programmer. Replicate the aforementioned analysis in your city/town. Use this information to hold your local officials accountable. [I can also do the analysis for discounted price]
Create a list of local community leaders/ experts in the different category groups. These people have already have built years of trust, and you seek to activate them in an intentional manner.
Be creative and engaging!

Steps for people in Saint Paul
If your neighborhood/ community is under-represented, run for city council. The filing date ends at August 13th! You can get more information here
If you are running for office, take the pledge of the Citizen-First Campaign, and let's support each other in getting citizens engaged. Let us work together in creating a more equitable Saint Paul
Please support my campaign! I'm currently looking for volunteers, community leaders, and core campaign members
- You can follow me in my candidate Facebook page, I will be setting up a donation page soon
- If you are in Ward 1, please join my Ward 1 community page
- Share my report to your network and friends EVEN if not in Saint Paul. Discuss the topics presented. The time for organizing is now.
Run Code (Prior to running report) 
#Run Code
import pandas as pd
import numpy as np
import warnings
warnings.filterwarnings('ignore')
import matplotlib as mpl
import matplotlib.pyplot as plt
%matplotlib inline
import requests # library to handle requests
import folium
import seaborn as sns
import scipy.stats as stats #used to get correlation coefficient


#load Data
P_15= pd.read_csv('Data/SaintPaul_PrecinctAnalysis_06-24-19.csv')
P_15.columns= ['Ward', 'Precinct', 'Tot_Vote', 'Tot_Reg','Vote%', 'Total_WardVotes', 'Total_WardRegistered','Pro_Weight', 'Act_Weight', 'Representation', 'HDensity_Register', 'H_Vote17', 'H_Dens_Vote%', 'L_Registered','L_Vote17', 'L_Dens_Vote%', 'H_Dens%']
Features= ['Ward','Precinct', 'Tot_Vote', 'Tot_Reg','Vote%','H_Dens%', 'H_Dens_Vote%', 'L_Dens_Vote%','Pro_Weight', 'Act_Weight', 'Representation']
P_15= P_15[Features]


def map_2015_SP_CityCouncilRepresentation_byPrecinct(Ward=0):
    #setup
    sp_geo = r'Shapefiles/SaintPaul_VotingPrecincts.json'

    if Ward==0:
        B=P_15
        A='City Council'
        zo= 12
    else:
        B= P_15[(P_15['WardCode'] == Ward)]
        A= 'Ward ' + str(Ward) +' '
        zo=13

    #Set up Variable Zoom Locations
    data = [[0, [44.948530, -93.096058]], [1, [44.958326, -93.122926]], [2, [44.933159, -93.115535]], [3, [44.918270, -93.176131]], [4, [44.961494, -93.176991]], [5, [44.978117, -93.106602]], [6, [44.978945, -93.047281]], [7, [44.942040, -93.033178]]]

    #44.951655, -93.096323

    # Create the pandas DataFrame
    Loc = pd.DataFrame(data, columns = ['Ward', 'Location'])
    Loc.iloc[Ward,1:]


    # generate a new map
    SP_map = folium.Map(location=Loc.iloc[Ward,1], zoom_start=zo,tiles='Stamen Terrain') #tiles="OpenStreetMap")

    SP_map.choropleth(
        geo_data=sp_geo,
        data=B,
        columns=['PrecinctName','Representation'],
        key_on="feature.properties.Precinct",
        fill_color='YlOrRd',
        fill_opacity=0.7,
        line_opacity=0.2,
        legend_name='2015 Saint Paul ' + A +' Precinct Representation: 06/24/19',
        highlight= True
    )
    folium.LayerControl().add_to(SP_map)

    # display map
    return SP_map
#map_2015_SP_CityCouncilRepresentation_byPrecinct()
P_15= pd.read_csv('Data/SaintPaul_PrecinctAnalysis_06-24-19.csv')
P_15.columns
Index(['WardCode', 'PrecinctName', 'Precinct_Vote', 'Precinct_Register',
       'Voting%', 'Total_WardVotes', 'Total_WardRegistered',
       'Projected_Weight', 'Actual_Weight', 'Representation', 'H_Registered',
       'H_Vote15', 'H_Density_Vote%', 'L_Registered', 'L_Vote15',
       'L_Density_Vote%', 'H_Density%'],
      dtype='object')