
Table of contents 
Note: The Elementary School groups are arranged in the following order; it id displayed right under the table of contents

Brief Introduction 
In this report, I will be primarily using state assessment data obtained from the Minnesota Department of Education (MDE) to assess how Saint Paul Public Schools (SPPS) is performing respect to the state, and identify achievement gaps and larger trends. Due to data privacy restriction, this is a diagnostic/exploratory report and not an instructional report, which should be provided by the SPPS district.
Prior to writing this report, I have looked through the SPPS website, and even though they have a meager sized Research, Evaluation, and Assessment (REA) department, I found that most of the material assessing state testing was inadequate and/or not updated. There is no documents that can help citizens understand what is happening in the school district as a whole and with individual schools. To their defense, as a former employee at an REA department, it is strongly discouraged for qualified staff to share information to the general public. There may be some concerns of data privacy; though the primary concerns is that with greater transparency, there is more accountability and scrutiny toward upper management by educators, parents, and residents alike. The dilemma mentioned above is the perfect example on why an Open Data Initiative is strongly encouraged for any city/township. It can be used to inform the public, hold the district accountable, more objective analysis, and not subjected by the influence/responsibility of working with an institution.
The report is primarily structured as the following:
- A broad overview of Minnesota standardized testing data to understand general state trends and the report itself
- A district level breakdown for all subject matter; including several achievement gaps.
- District level proficiency Maps with ranking based on Demographics [Excludes high school]
- Conclusion
- Supplement Reports: Individual school demographics/ assessment data broken down by grade. In addition, the schools groups are paired by proximity to percentage of students that receive free and/or reduced lunch.
Saint Paul Open Data Initiative 
This initiative focuses on taking public information/data from municipalities and organizations to create interactive reports and analysis to better inform and assist community members to take action. This is an open-source project meaning that all coding is accessible to everyone, and thus there is transparency on the results. It is currently all python-based. As always, I encourage other programmers and developers to participate in making this more accessible. You can learn more information on the project Github page as well as accessing documents. The supporting data workbook for this report can be accessed here
About Me: Opinion from a former Education Data Analyst 
In 2015, I was the Education Data Analyst for South Washington County Schools for over two years, and it was the third largest school district in the state. I have some knowledge on assessment and standardized testing, and in my personal opinion MDE places too much emphasis on standardized testing. I can list several reasons on how standardized testing is inequitable and how the state evaluation methods is systematically unjust, though it can still be a valuable tool. State testing matters as it can influence people's decision in choosing schools, determine how state funding and resources are distributed, and can place additional burden on educators. For this reason, it is worth informing you about the trends in Saint Paul Public Schools. I'll be replicating some of the diagnostic reports that I have implemented in the past for South Washington County schools. Sadly, my analysis will only provides a static picture of student assessment, which is not conducive is creating proactive change, and better accountability tools. I'll share some of my recommendations.
Here are several things to keep in mind when processing the data as it may be alarming and encourage the reader to be curious:
- How can we address the challenges right NOW? Investing only on early childhood programs (albeit easier to do) does not address the systemic challenges now?
- If standardized testing is not working for our city/communities, what are some existing alternatives? Or do we create, inclusively, a different curriculum/ academic standard that is aligned to community needs
- How does charter schools influence SPPS? (I will not evaluate this)
- What is the role of citizens in influencing SPPS policies, and state/federal policies?
- What is the role of parents/students influencing SPPS?
- What do local educators have to say about this?
- Where are we spending our money, and how do we spend it on things that matter?
About the Data 
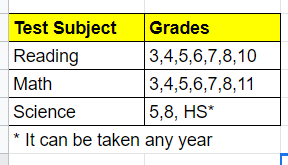
The primary datasets are retrieved from MDE Data Center Data Reporting Web Portal I selected the following specifications "All accountability tests, which lists the three files for each respective subjects: Math, Reading, and Science. These reports combine both the Minnesota Comprehensive Assessment (MCA) and Minnesota Test of Academic Skills (MTAS). The MCA is the standardized test of Minnesota and has to follow both federal and state guidelines. The MTAS is an alternate assessment based on alternate achievement standards for students with the most significant cognitive disabilities. The subject testing grade breakdown is below, notice Science MCA is given in staggered years, and high school testing for all subjects has a gap from 8th grade.
Personally, I would not give much weight on the high school tests because it is not mandatory to pass to graduate high school, and high schoolers will place more effort on college entrance examinations such as the American College Testing (ACT). On the SPPS website, you can view the ACT results through an interactive report. The testing itself is evaluated into four categories: Does Not Meet, Partially Meet, Meet, and Exceed Standards. Proficiency is the percentage of Meet and Exceed standard students. This analysis with only be concerned with Proficiency. Upon recently, parents and students can option out from taking the MCA (this may have some consequences). The Enrollment dataset is also from the MDE website. Enrollment is taken at October 1st.
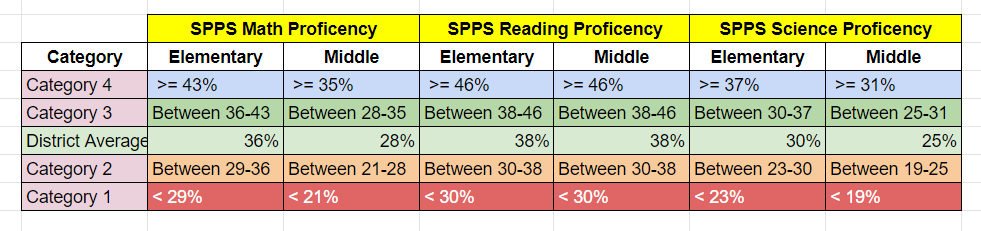
Furthermore, the state of Minnesota is concerned with several achievement gaps, the achievement gaps categories are below with the areas of interest highlighted.
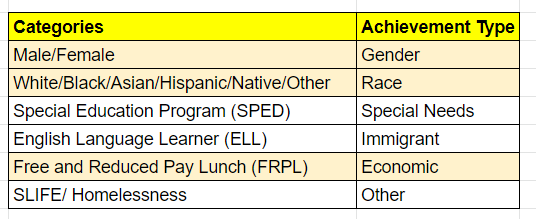
For SPED and ELL standardized testing might not be the best metric for progress, and doesn't m. It's worth nothing that Minnesota performs fairly well in standardized testing among other states; however it has a large racial equity gap (White vs Black) in academic testing performance ranging within the bottom five states. I will go over this under the in-depth achievement gap section.
Interpretation Disclaimer: The MCA data only provides a static picture of student assessment, and does not consider the respective cohorts. We can use the state trend to determine if SPPS is considerably different compared to the peers.
Saint Paul Public School District Data
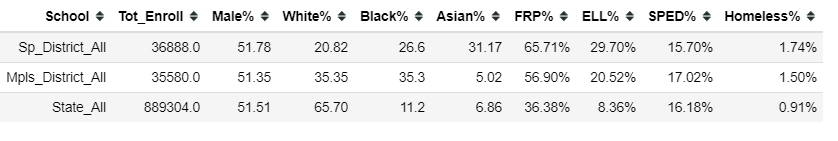
Saint Paul Public Schools (SPPS) is the largest school district, based on total enrollment, in Minnesota with 36,844 students enrolled and with over 44 elementary schools, 6 intermediate schools, and 5 high schools. This is roughly 4.14% of total enrollment of the entire state, while Minneapolis has 4% enrollment. Due to the vast number of schools, and inadequate software it is hard to evaluate the individual schools in respect to achievement gaps. I will be comparing SPSS district data with state data, and the Minneapolis Public Schools (MPS). Note: The participation rate for MPS is around 91.3% and for Saint Paul it is 96.3%, which is near the state participation rate. The enrollment data is below. Notice there is more black and white students in Minneapolis, while there is more asian students and ELL students in Saint Paul. In comparison to state level, there is more poverty and people of color (POC) in the twin-cities.
Saint Paul District Analysis
Standardized Testing Math 
NOTE: there is no Math MCA testing for 9th and 10th grade.
Proficiency
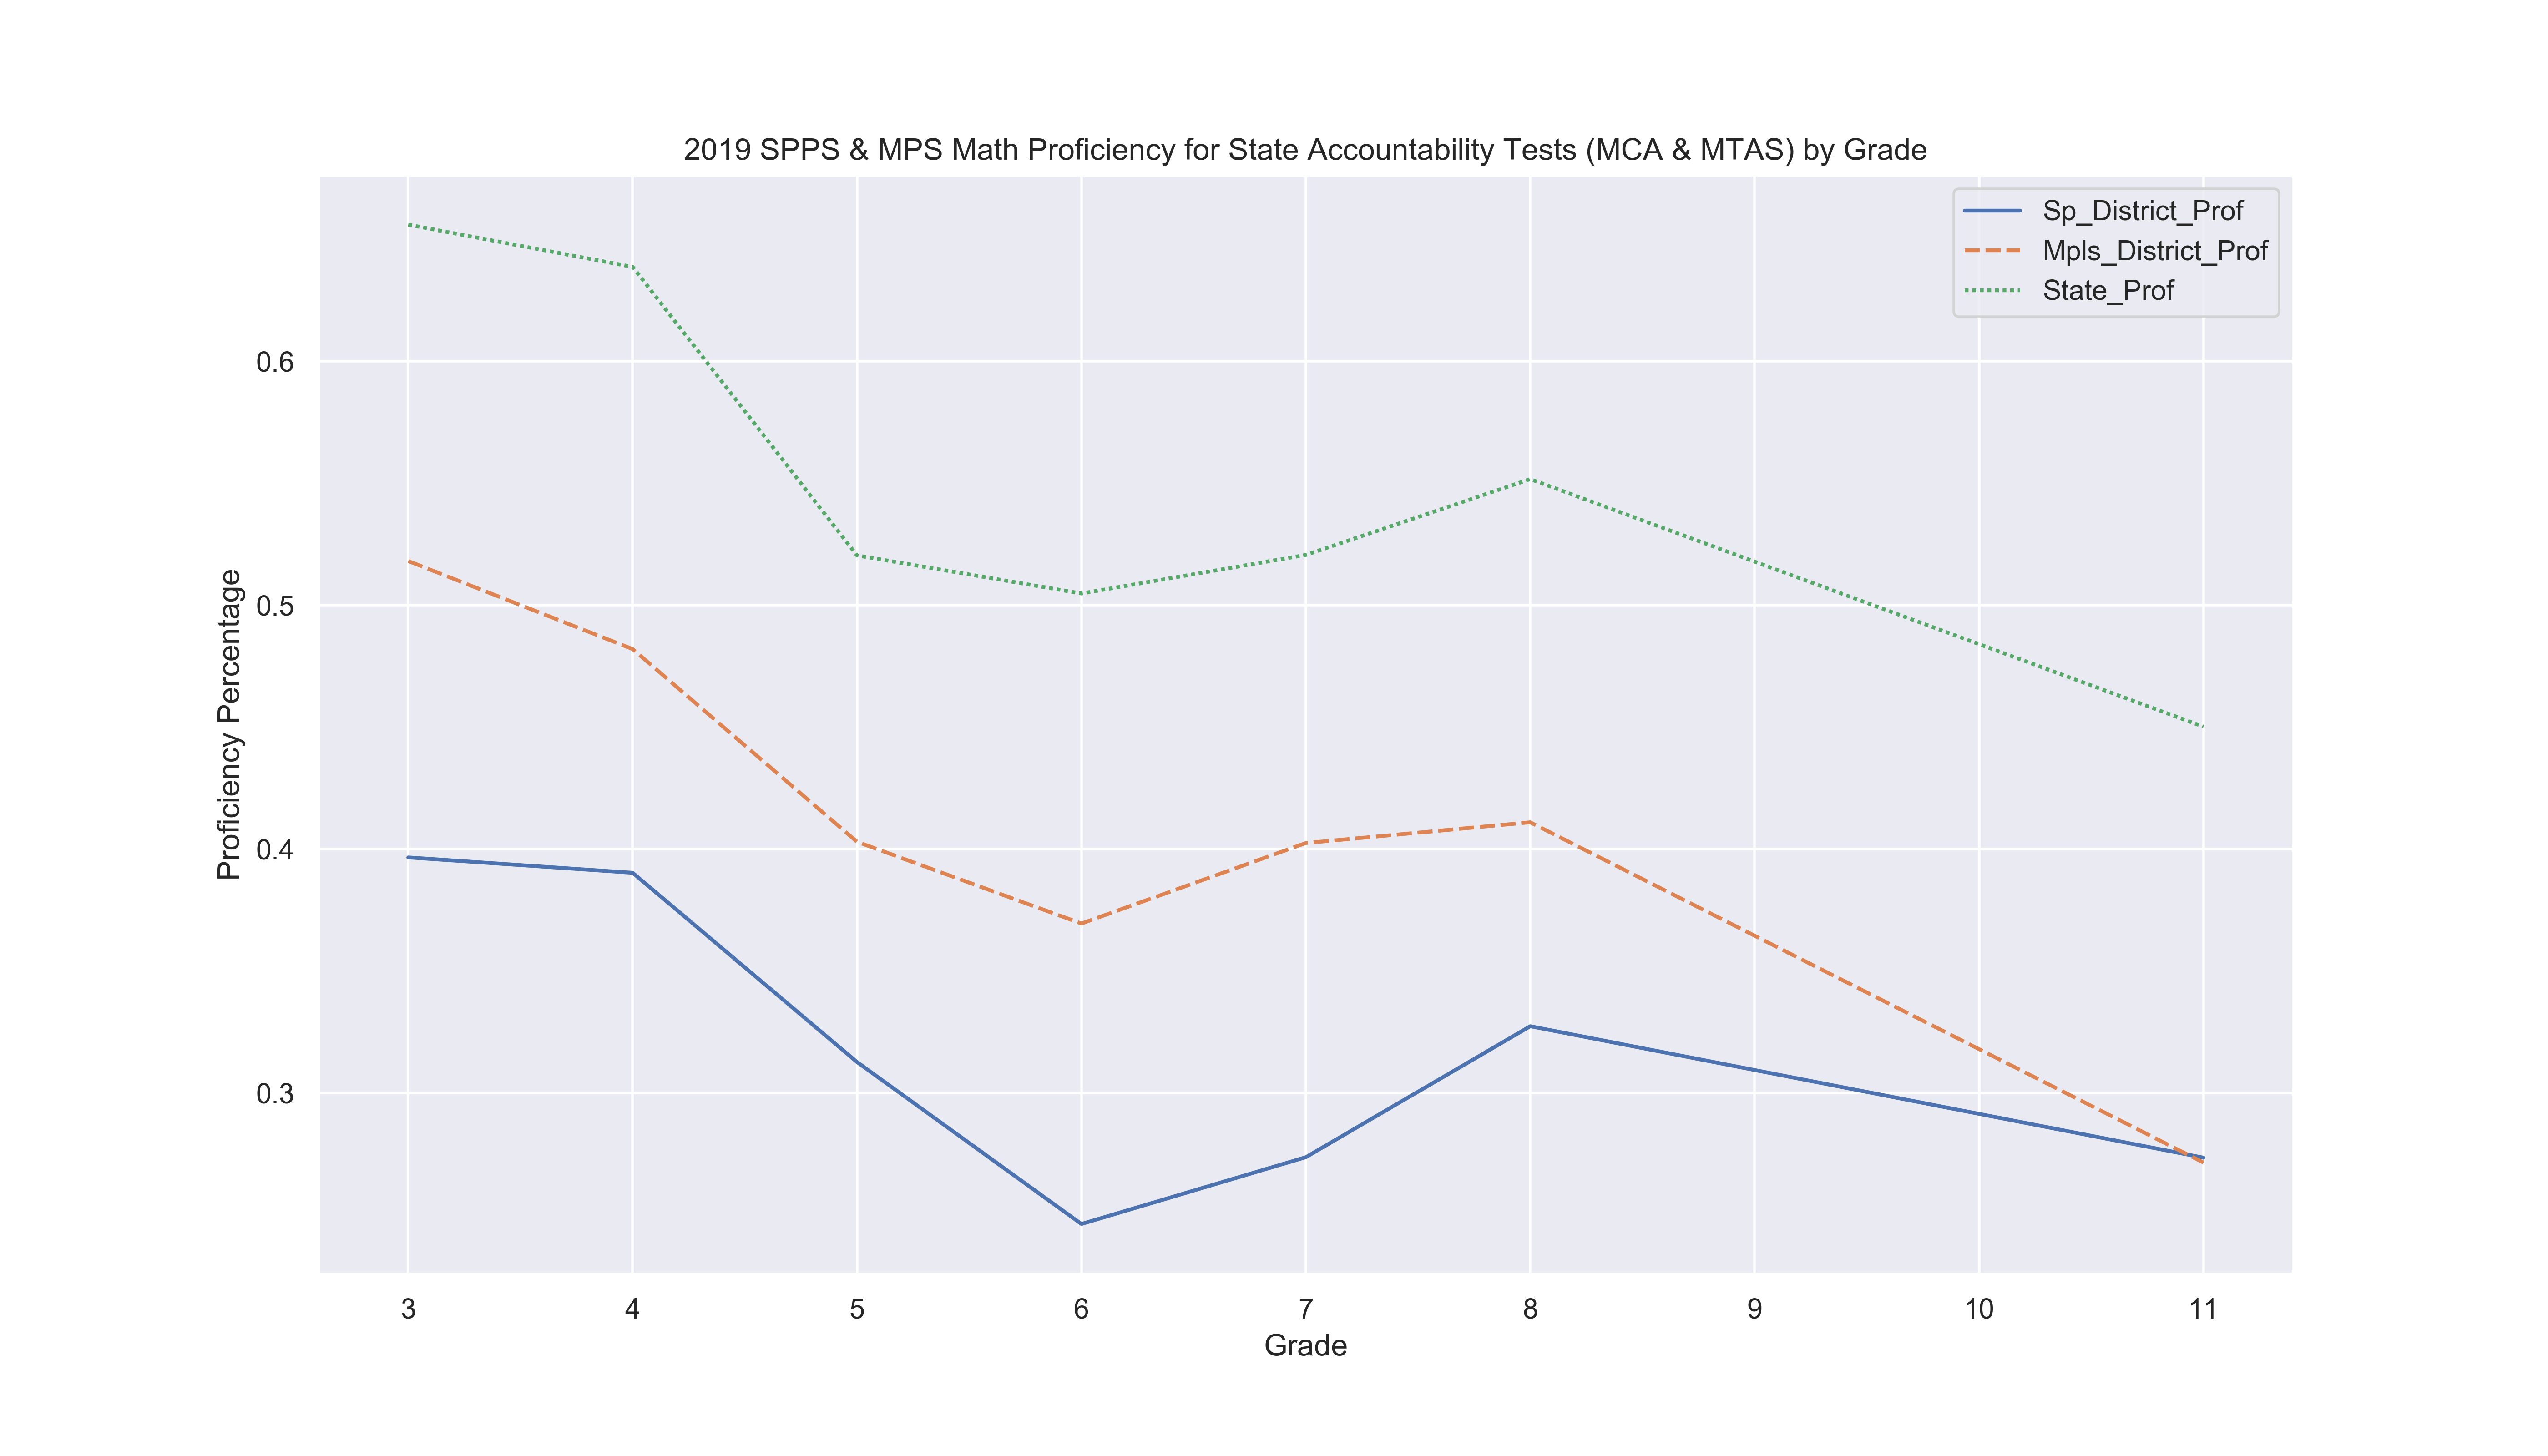
From the data, we see there is a steep decline in proficiency in 5th-6th grade, and at high school. It is hard for students to transition into middle school as instruction and environment is different. Both MPS and SPPS is far below the state average. At 11th grade, MPS and SPPS intersect, and this is more likely to do with the participation rate of each district. For SPPS, the participation rate is 76.8%, for MPS its 46.4%, and for state it's 88%. The discussion around high school testing is that well-off students are more likely not to take the exam, negatively impacting overall efficiency
Gender Gap
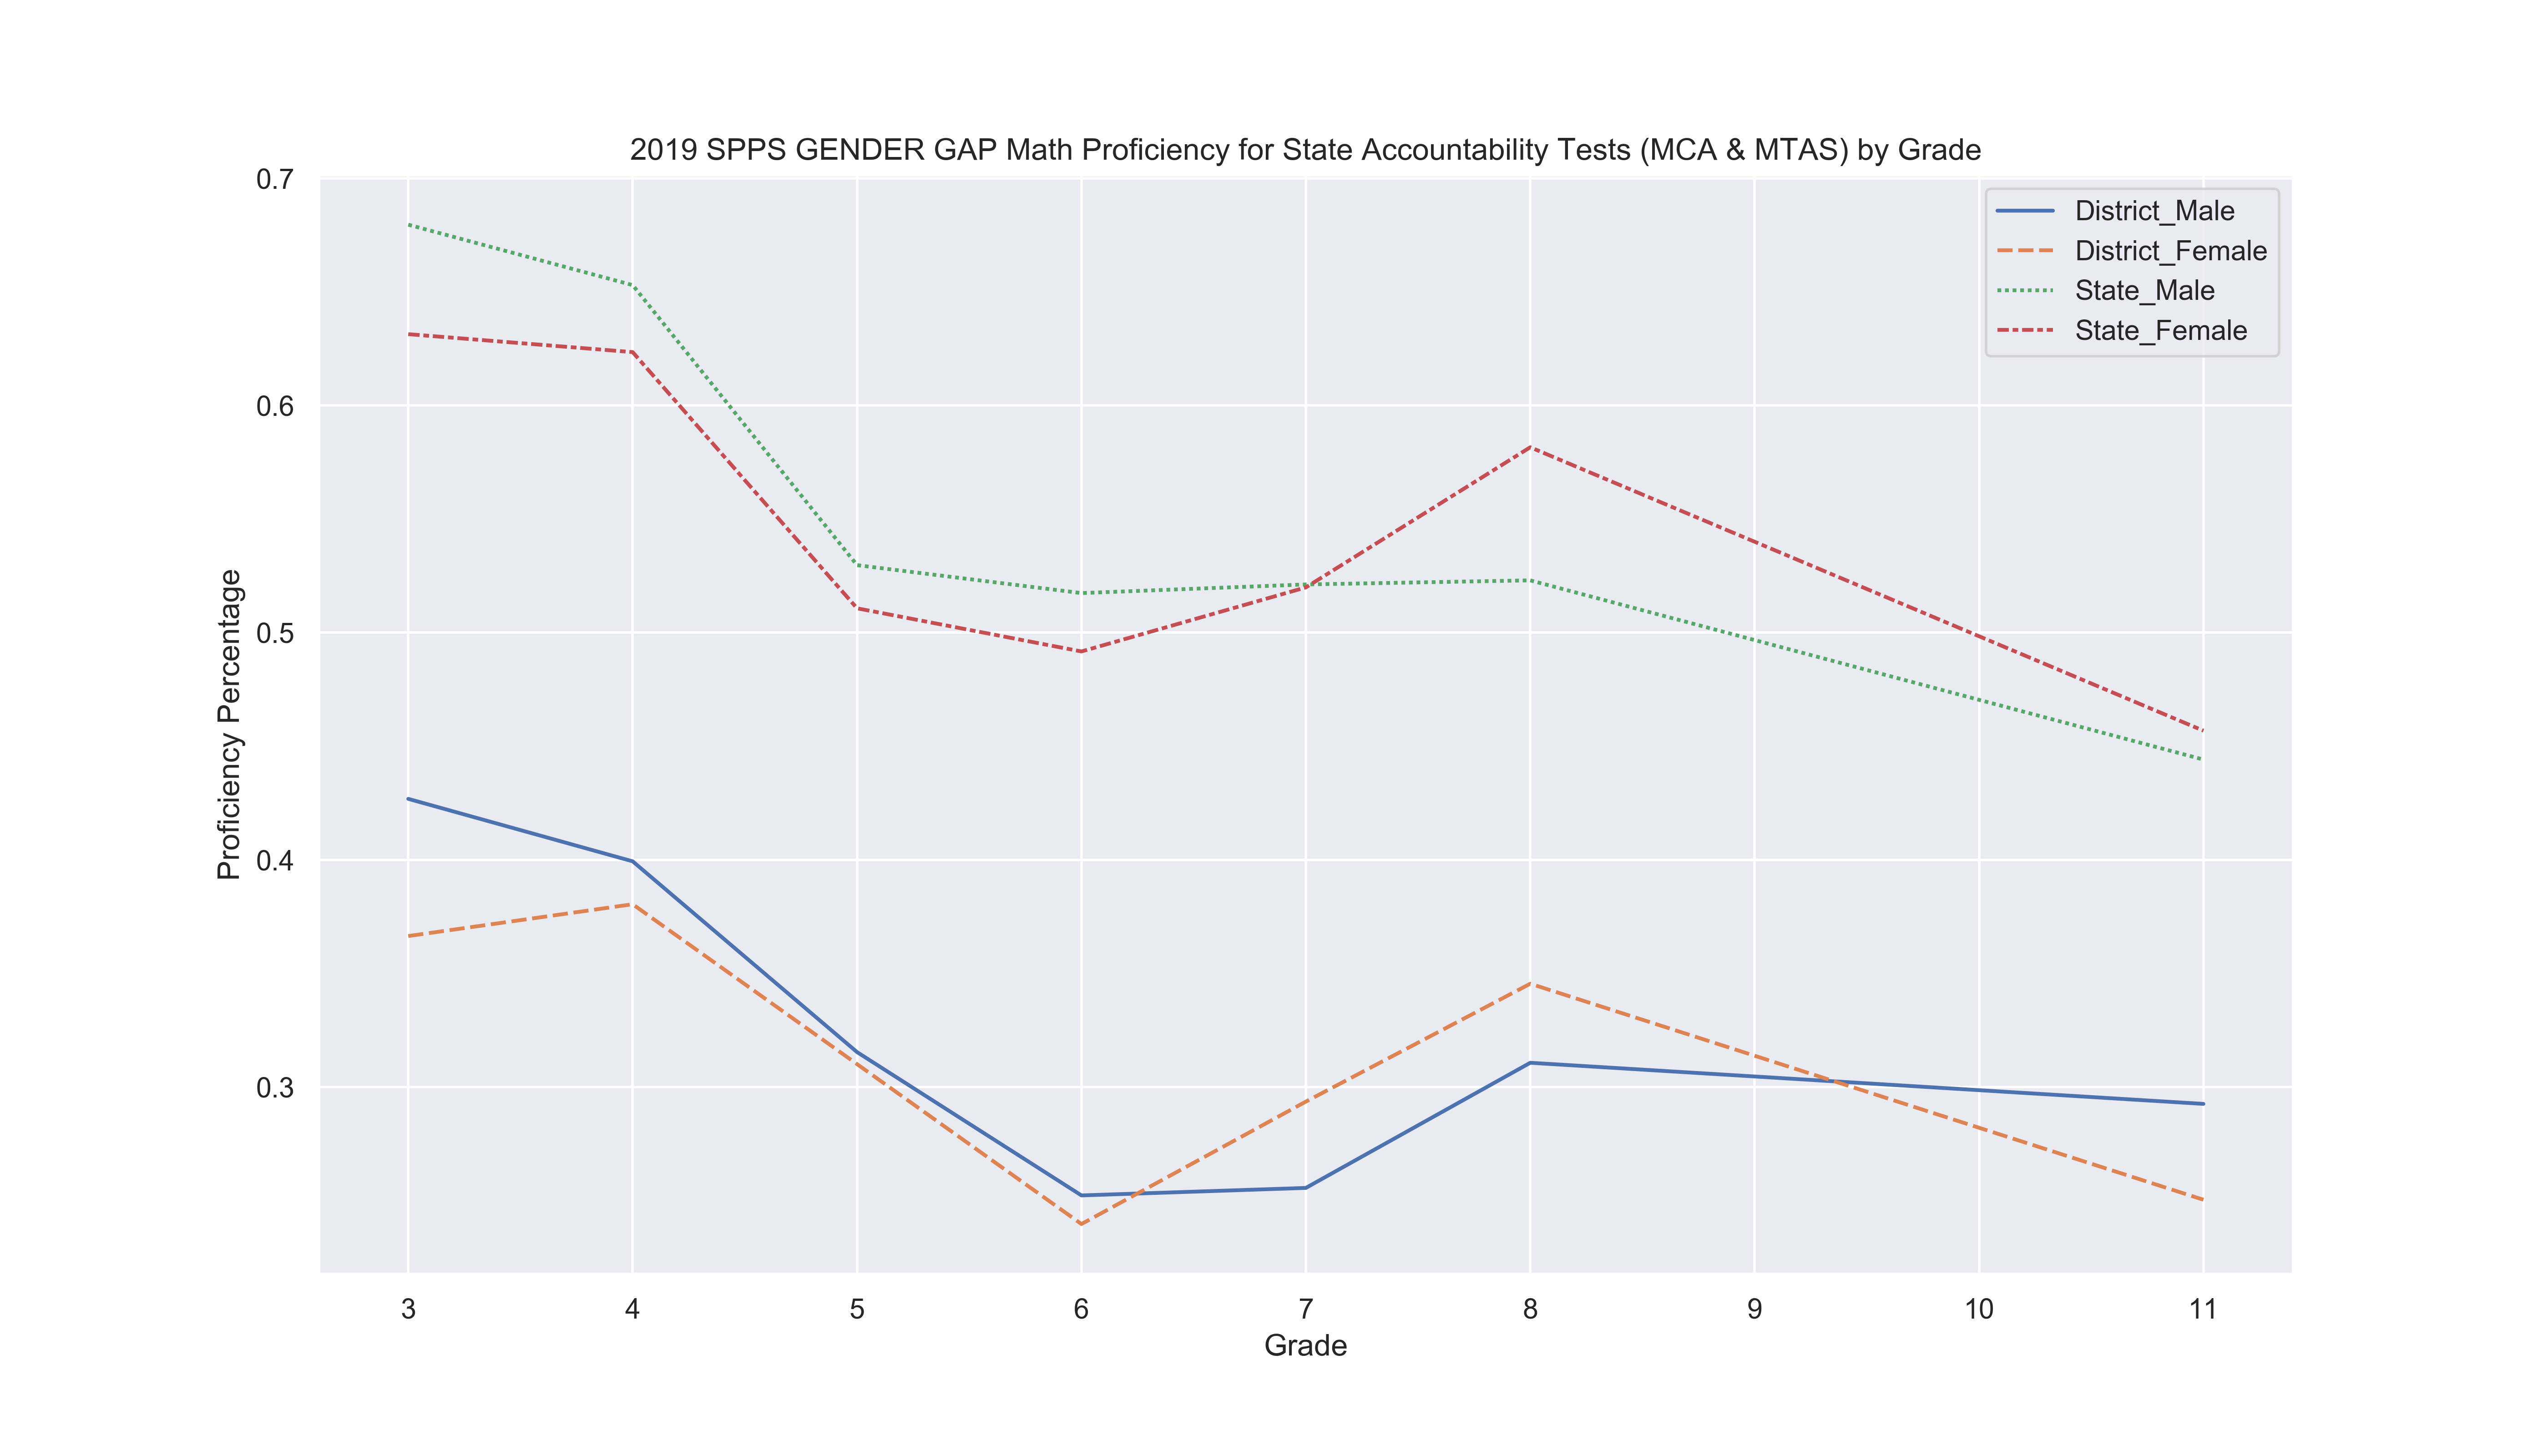
The stereotype is that boys are better in math than girls, as the graphs show that they are fairly equal (though research have shown that boys assessment has more fatter tails, where as there is greater concentration of boys that excel in math and boys that do poorly in math.) Girls do better than boys by 8th grade.
Racial Gap
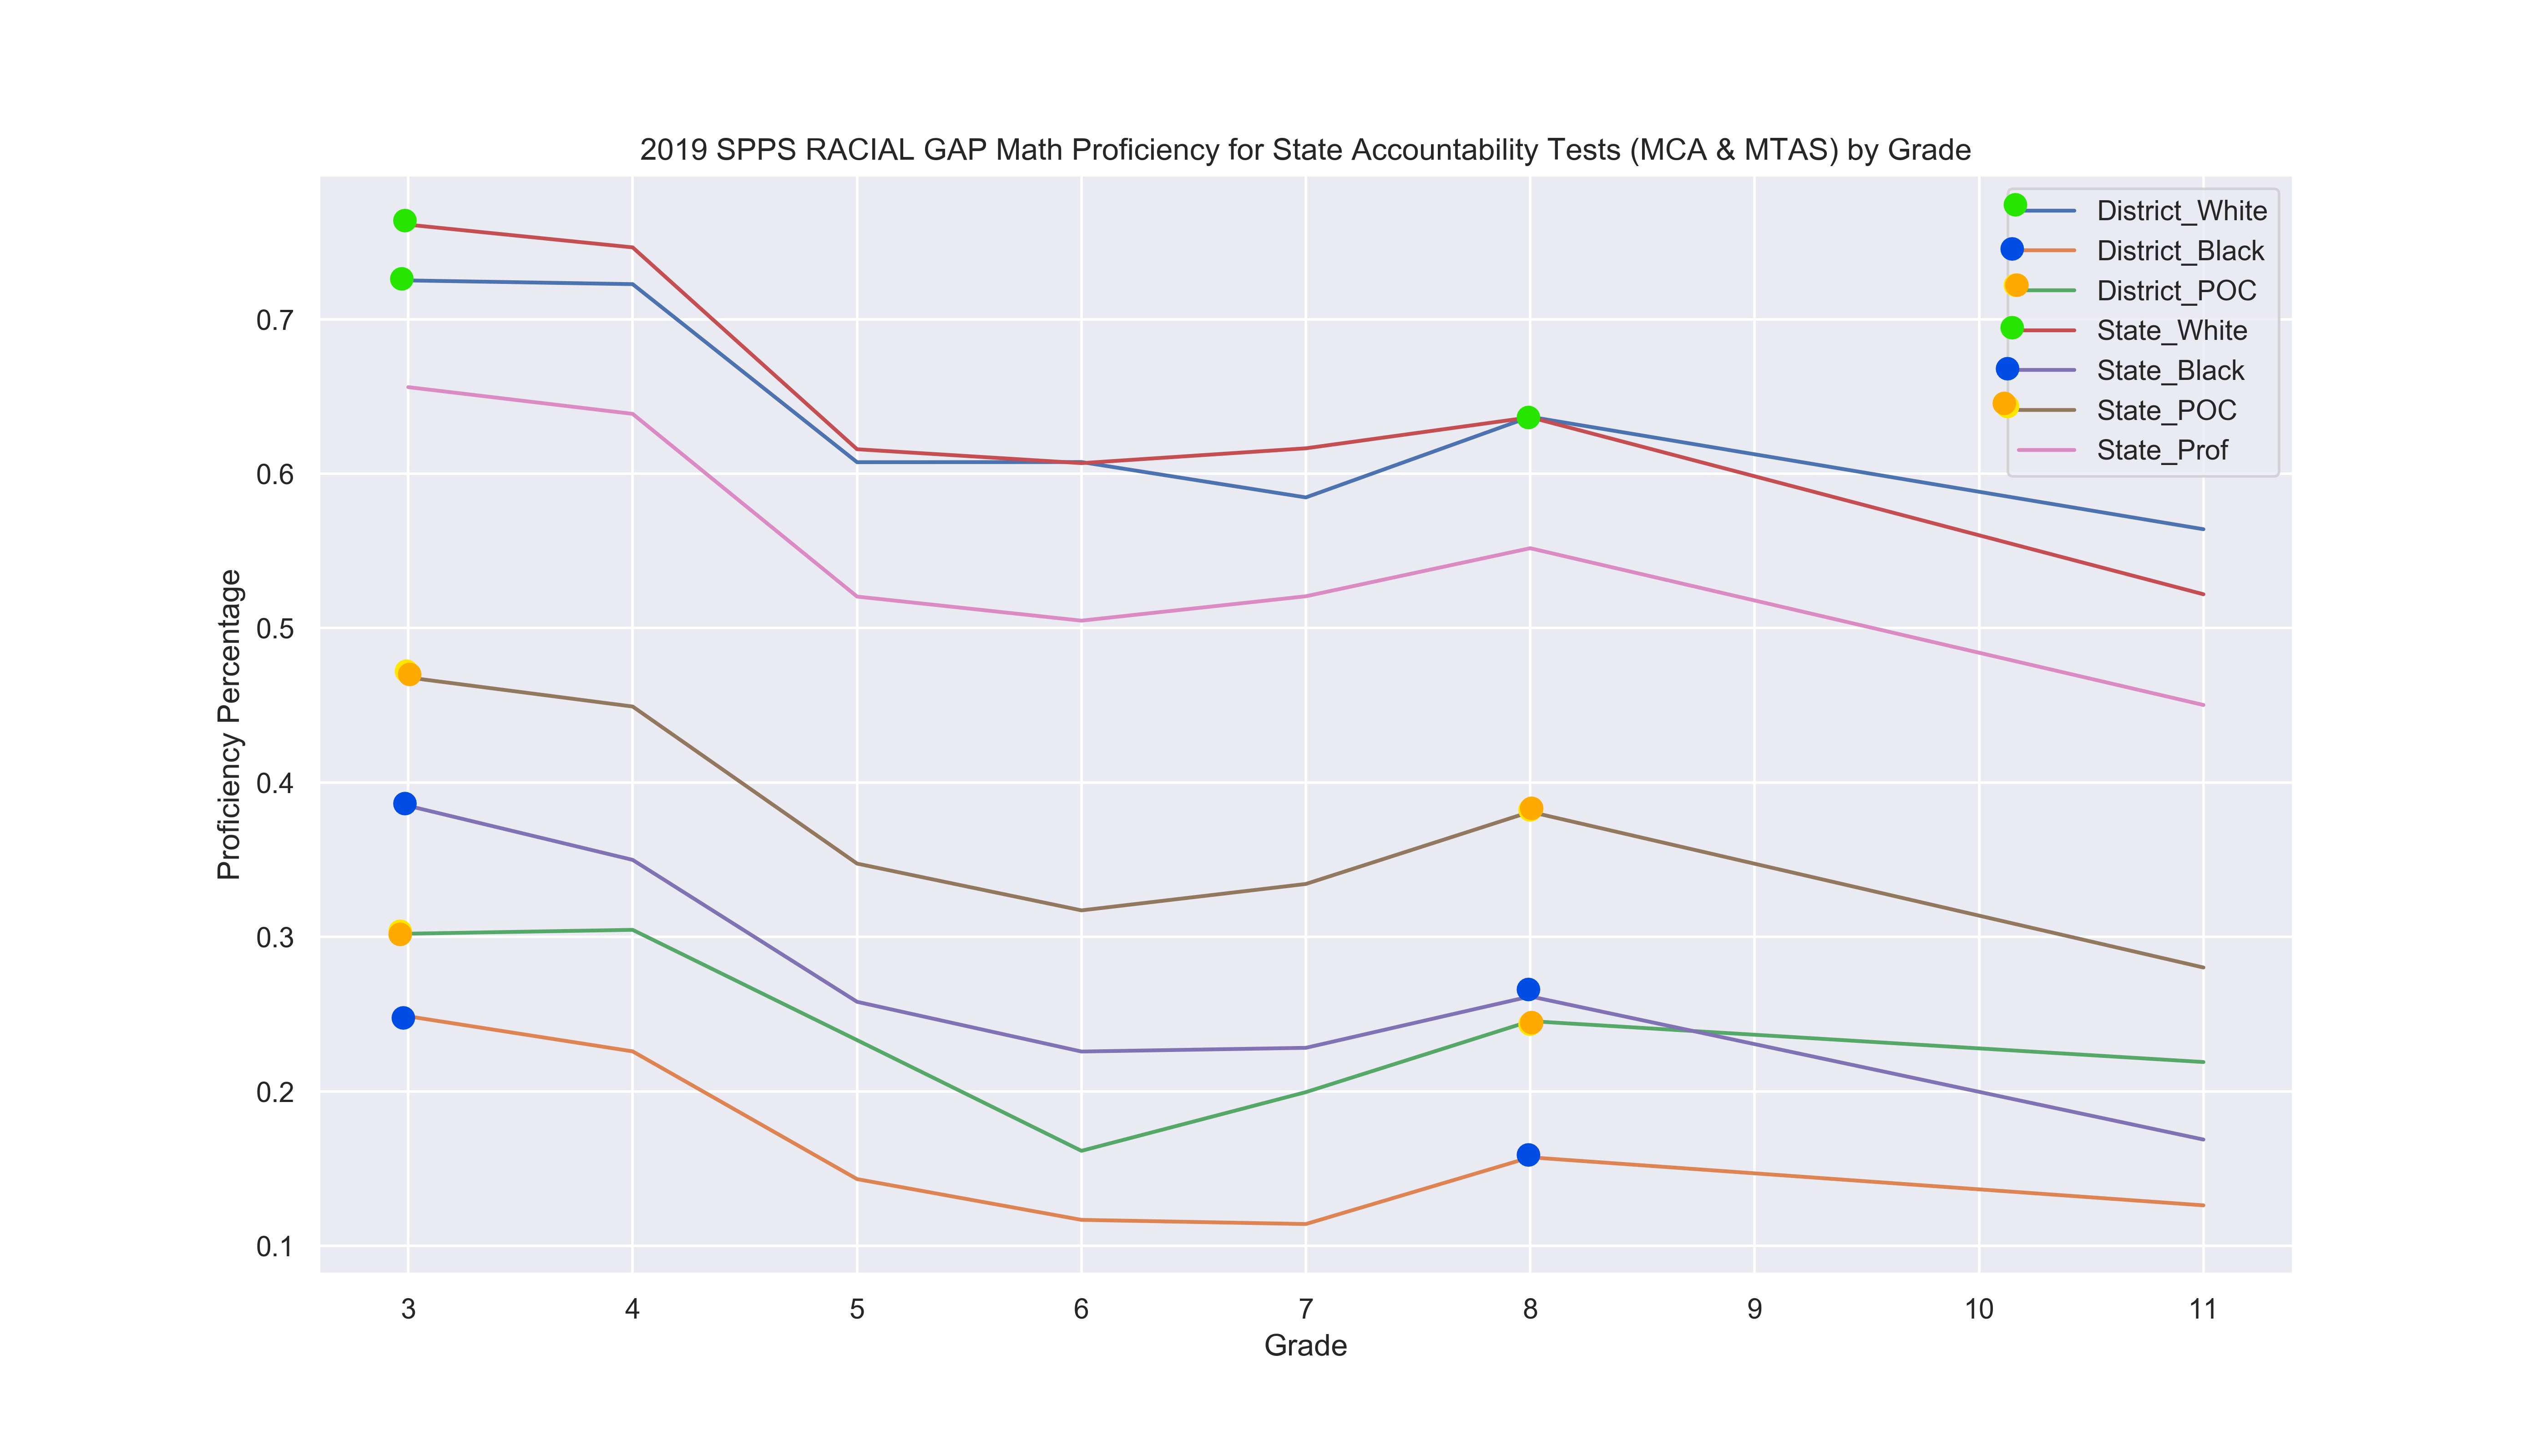
I've created the category of people of color (POC) to capture all non-White people. I've color coded the endpoints to make the comparison easier to spot visually. First, we find that white student perform better than state average, and there is no gap between the state and SPSS. In comparison, the other racial groups are below the state proficiency, and the gap between the state and SPSS is steady at 10% points. By 8th grade, in SPPS, white students perform 50% points greater than black students.
Economic Gap
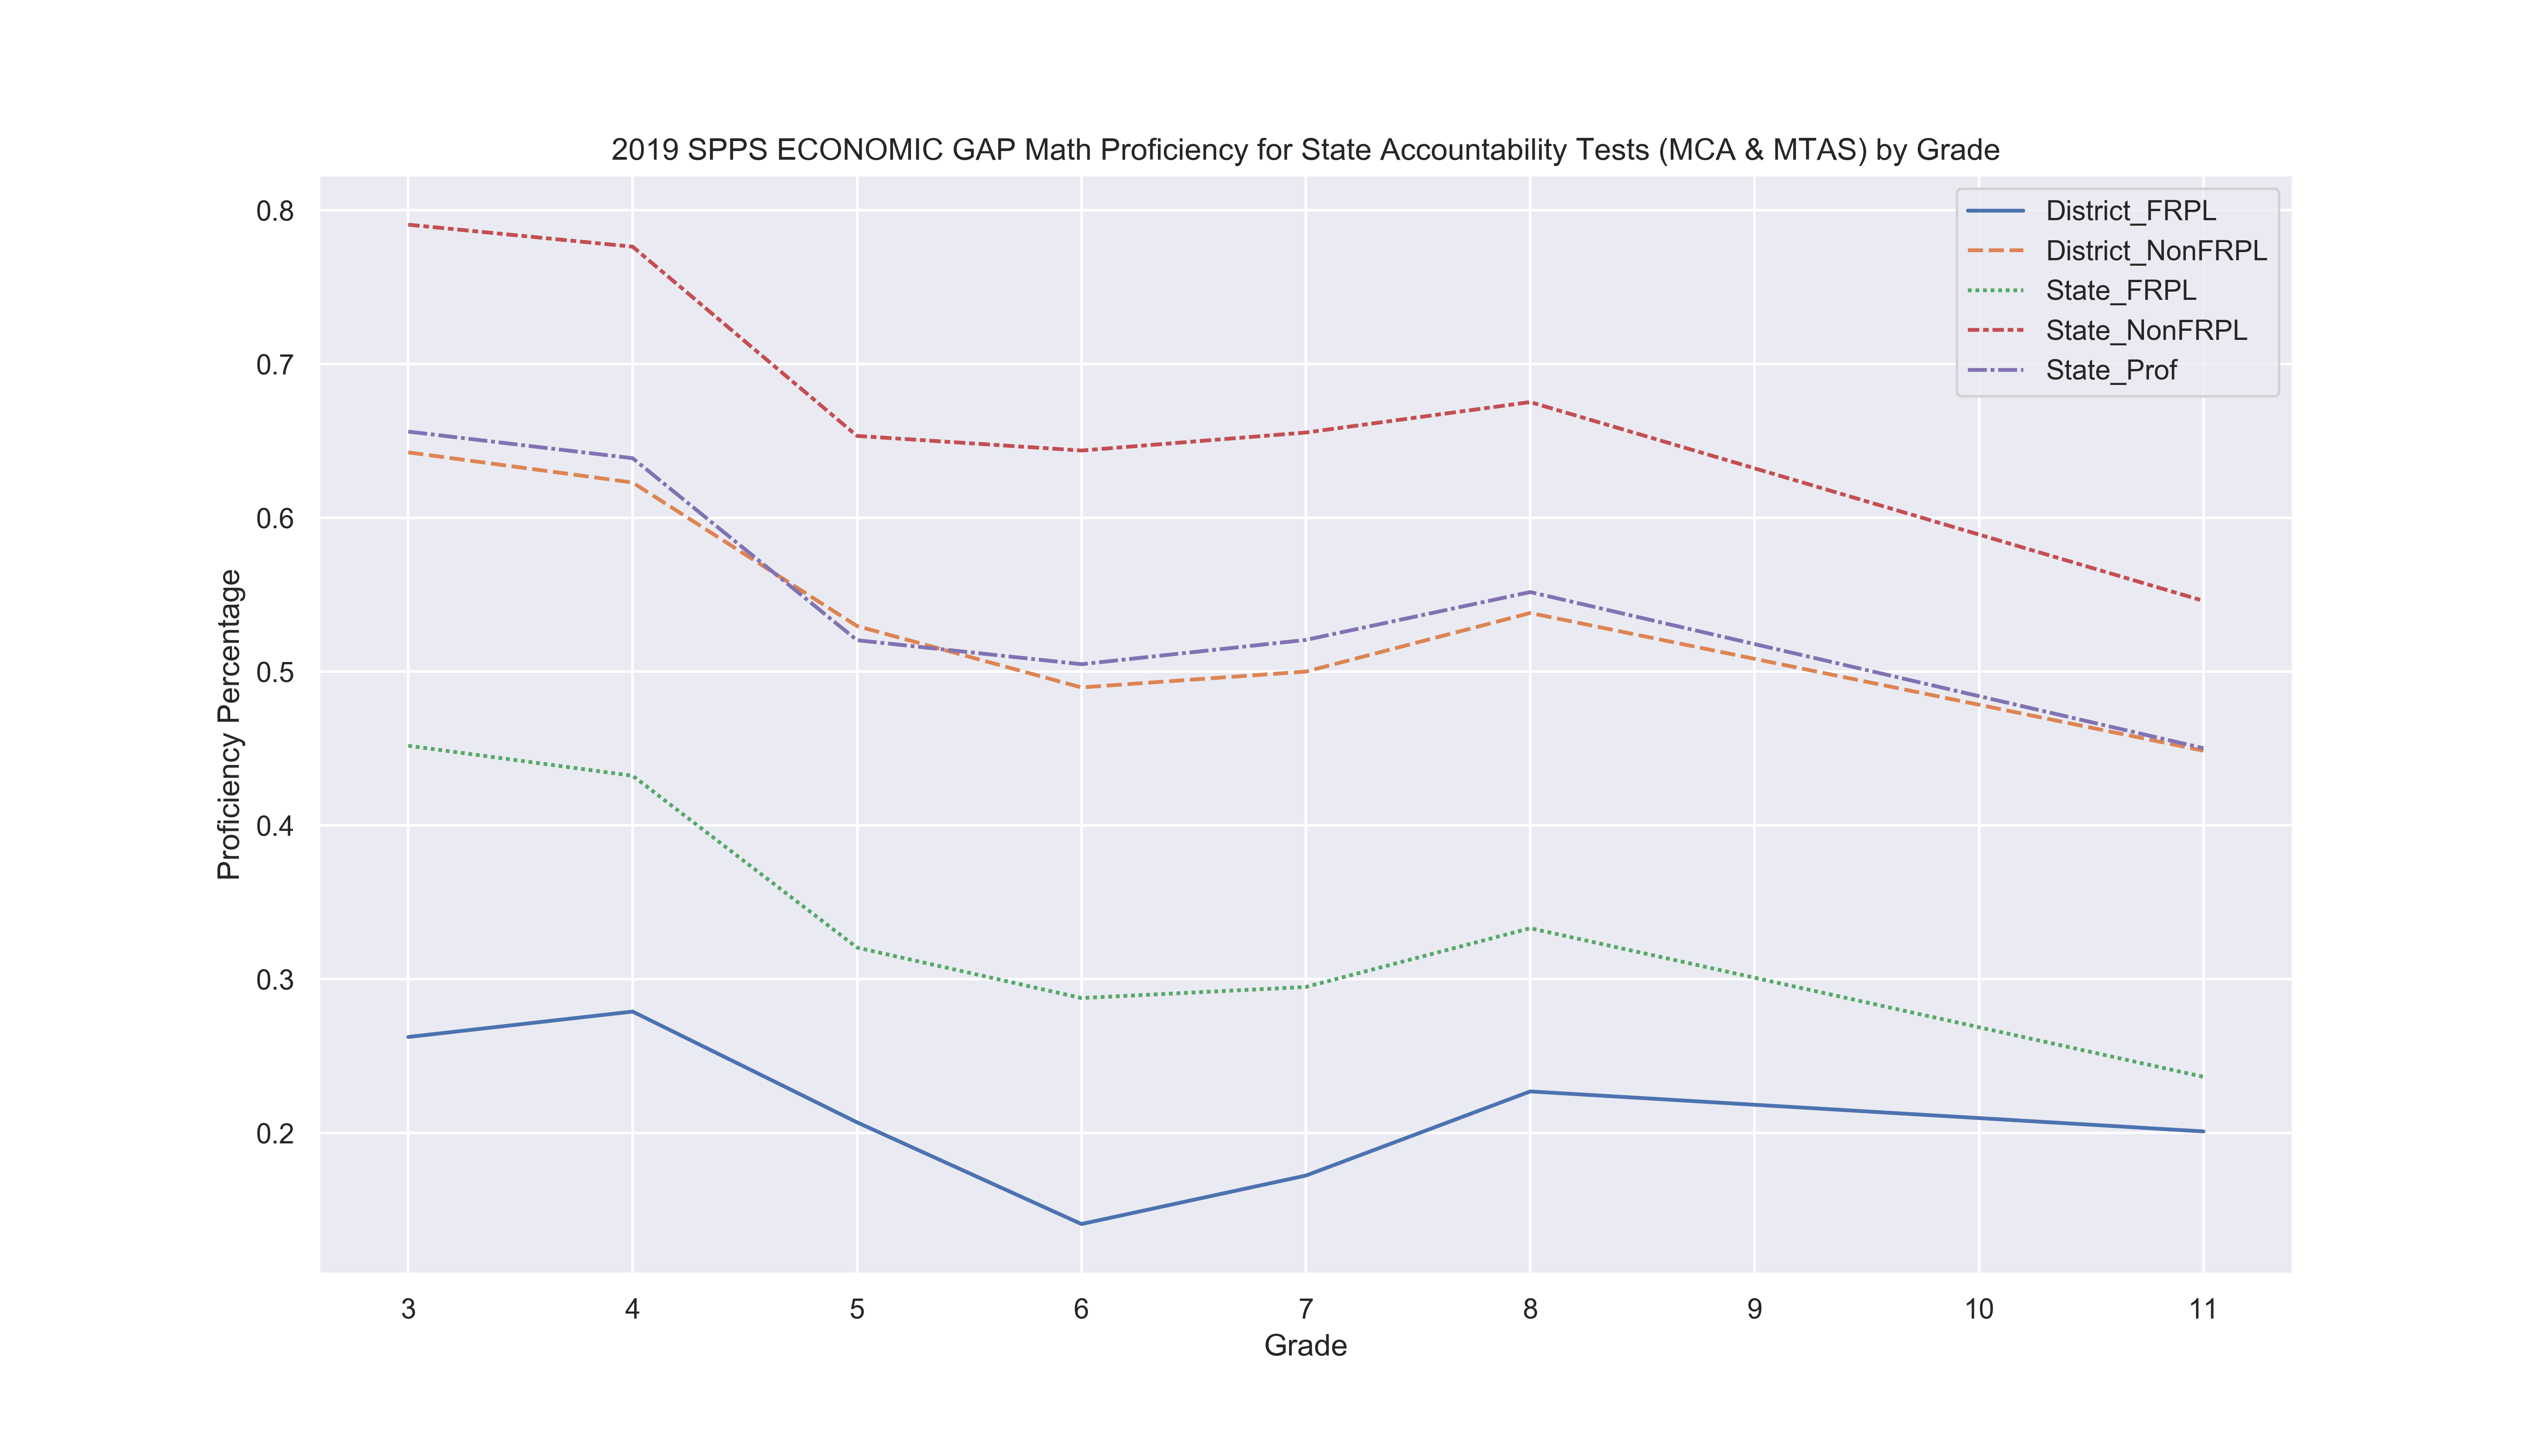
As expected, students with less economic burden will be more proficient than their counterparts. For SPPS NonFRPL students, they perform as good as the state average. Lower income students in SPSS have lower proficiency rates compared to state counterparts, though the gap declined from 15% to 10% at 8th grade.
Standardized Testing Reading 
NOTE: there is no MCA Reading testing for 9th grade.
Proficiency
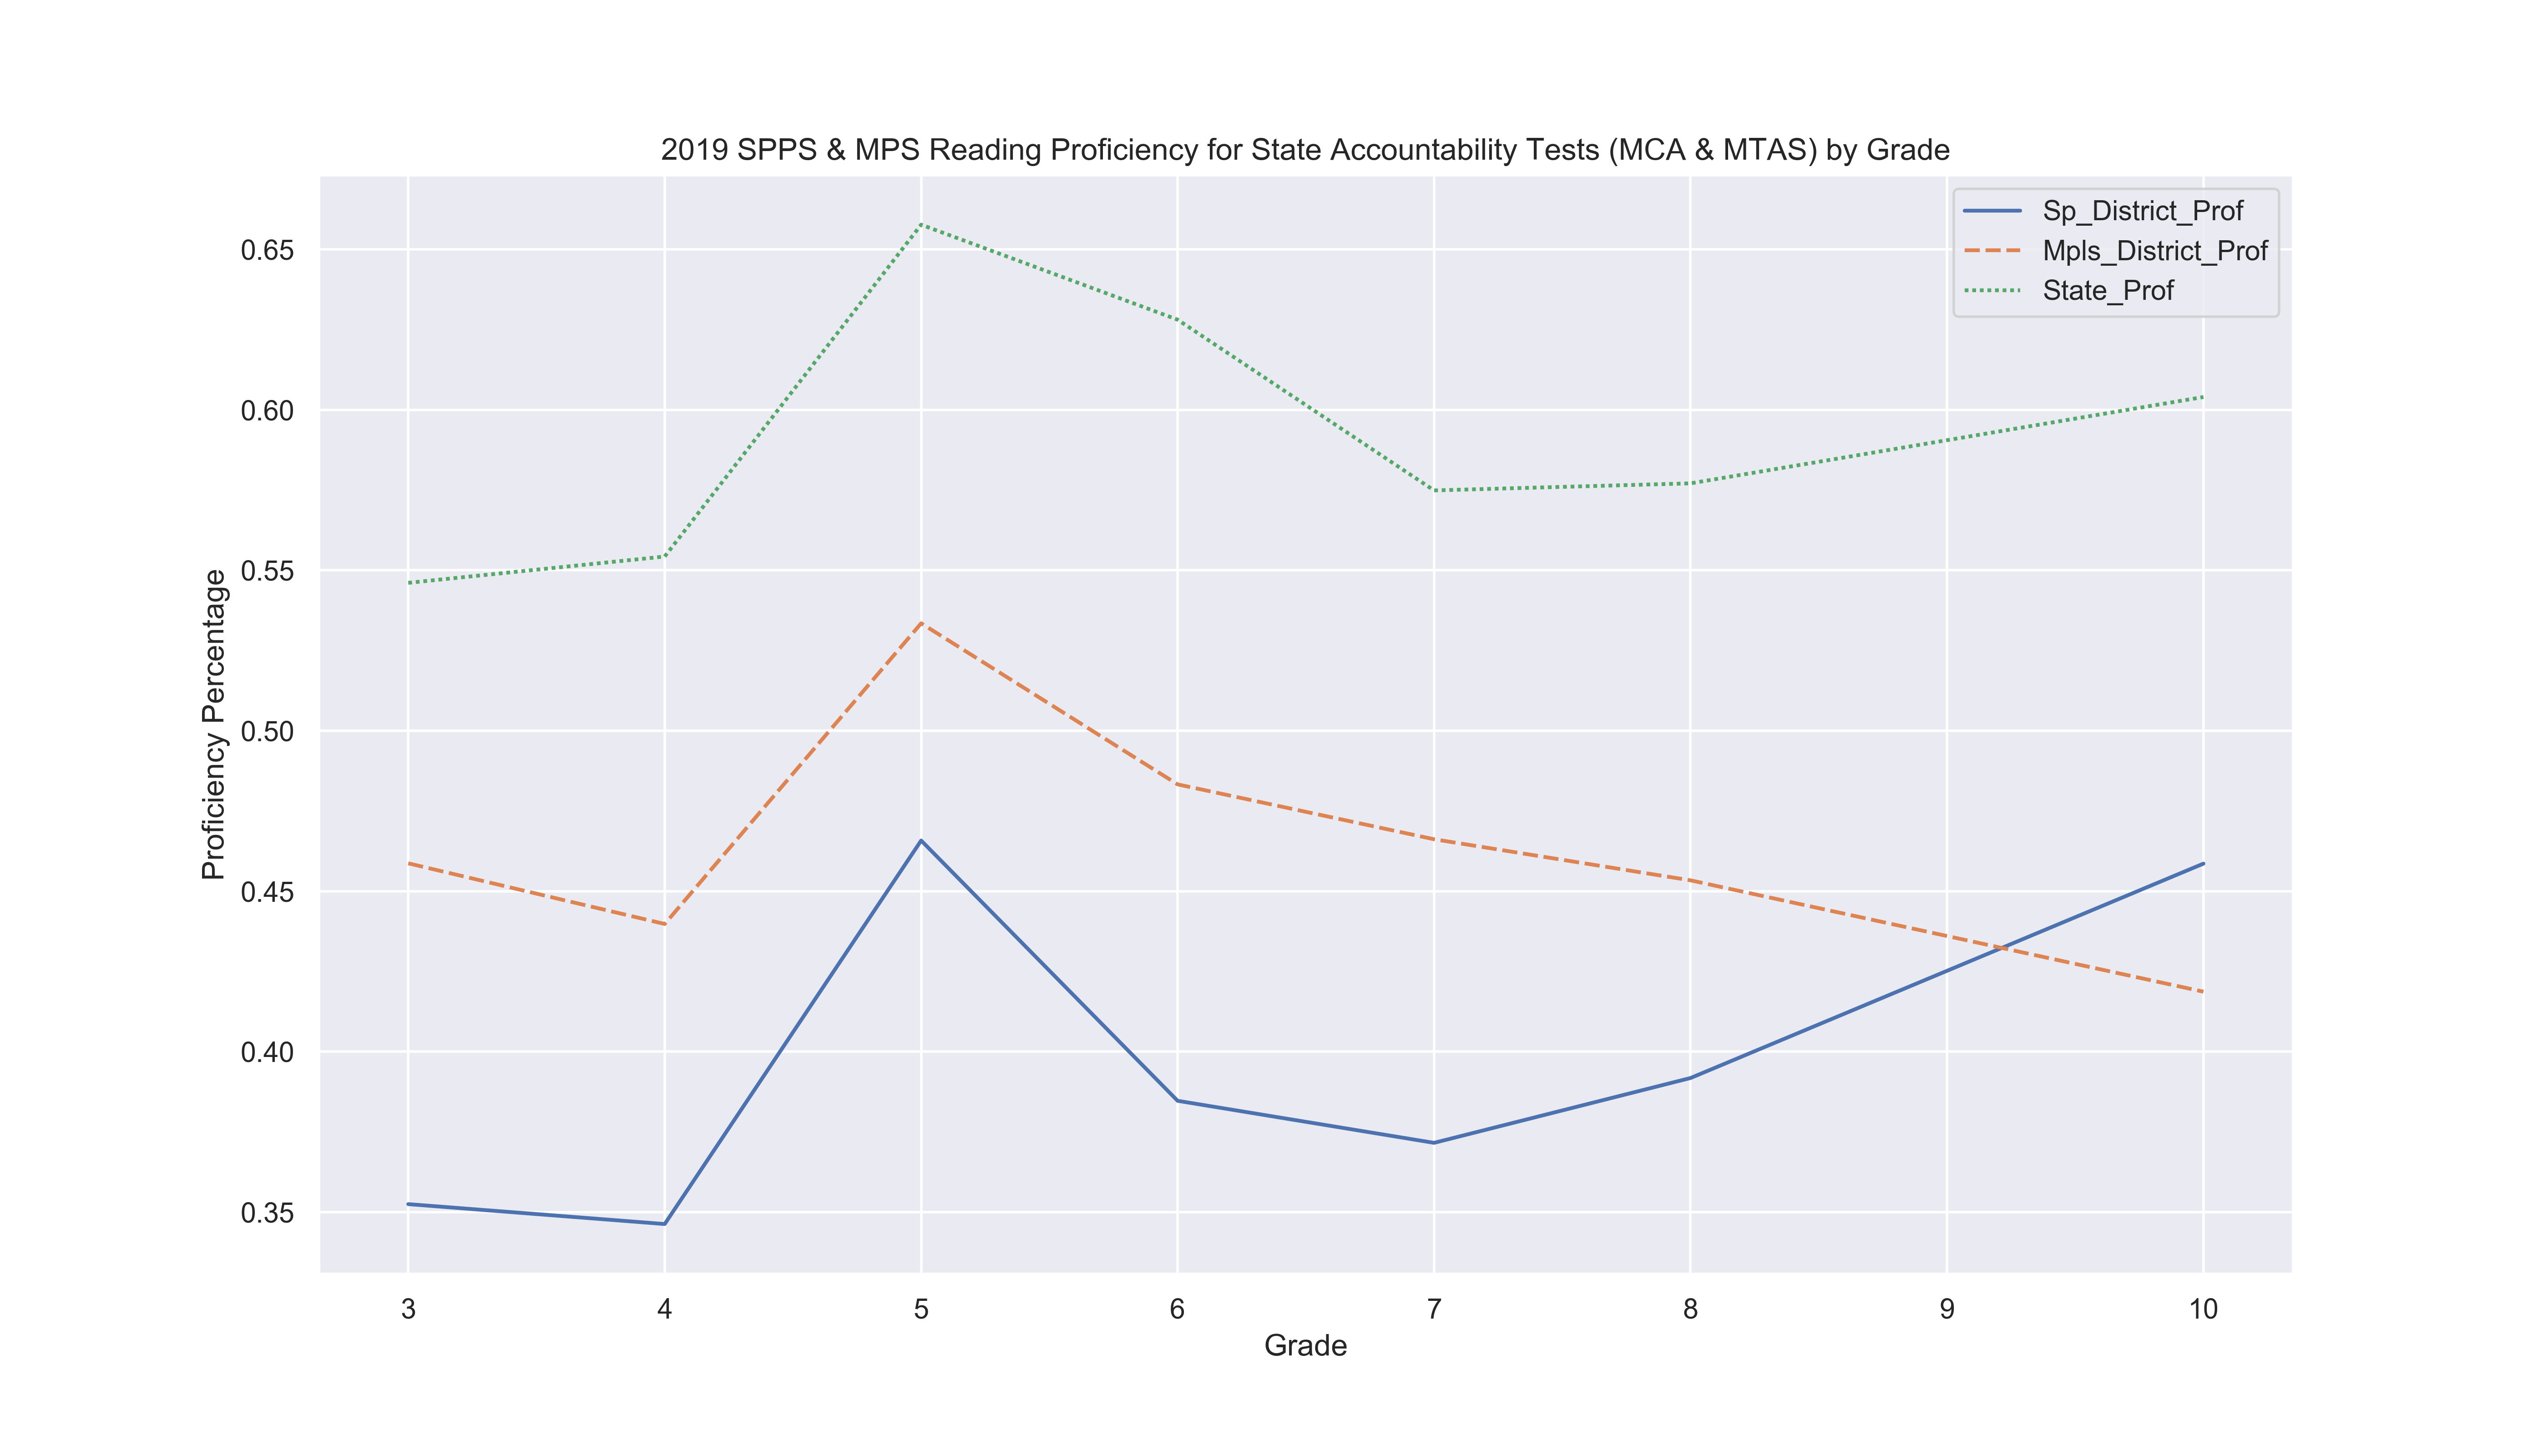
Don't let the scale trick you. SPPS is roughly 20% points less than the state average up to 8th grade, and 15% at 10th grade. Interestingly, MPS continued to decline proficiency from 7th grade to 10th grade with SPPS doing better at 10th grade. For SPPS, the participation rate is 86.9%, for MPS its 52.9%, and for state it's 88%. The drop in proficiency for MPS at 19th grade might be due to low participation rate.
Gender Gap
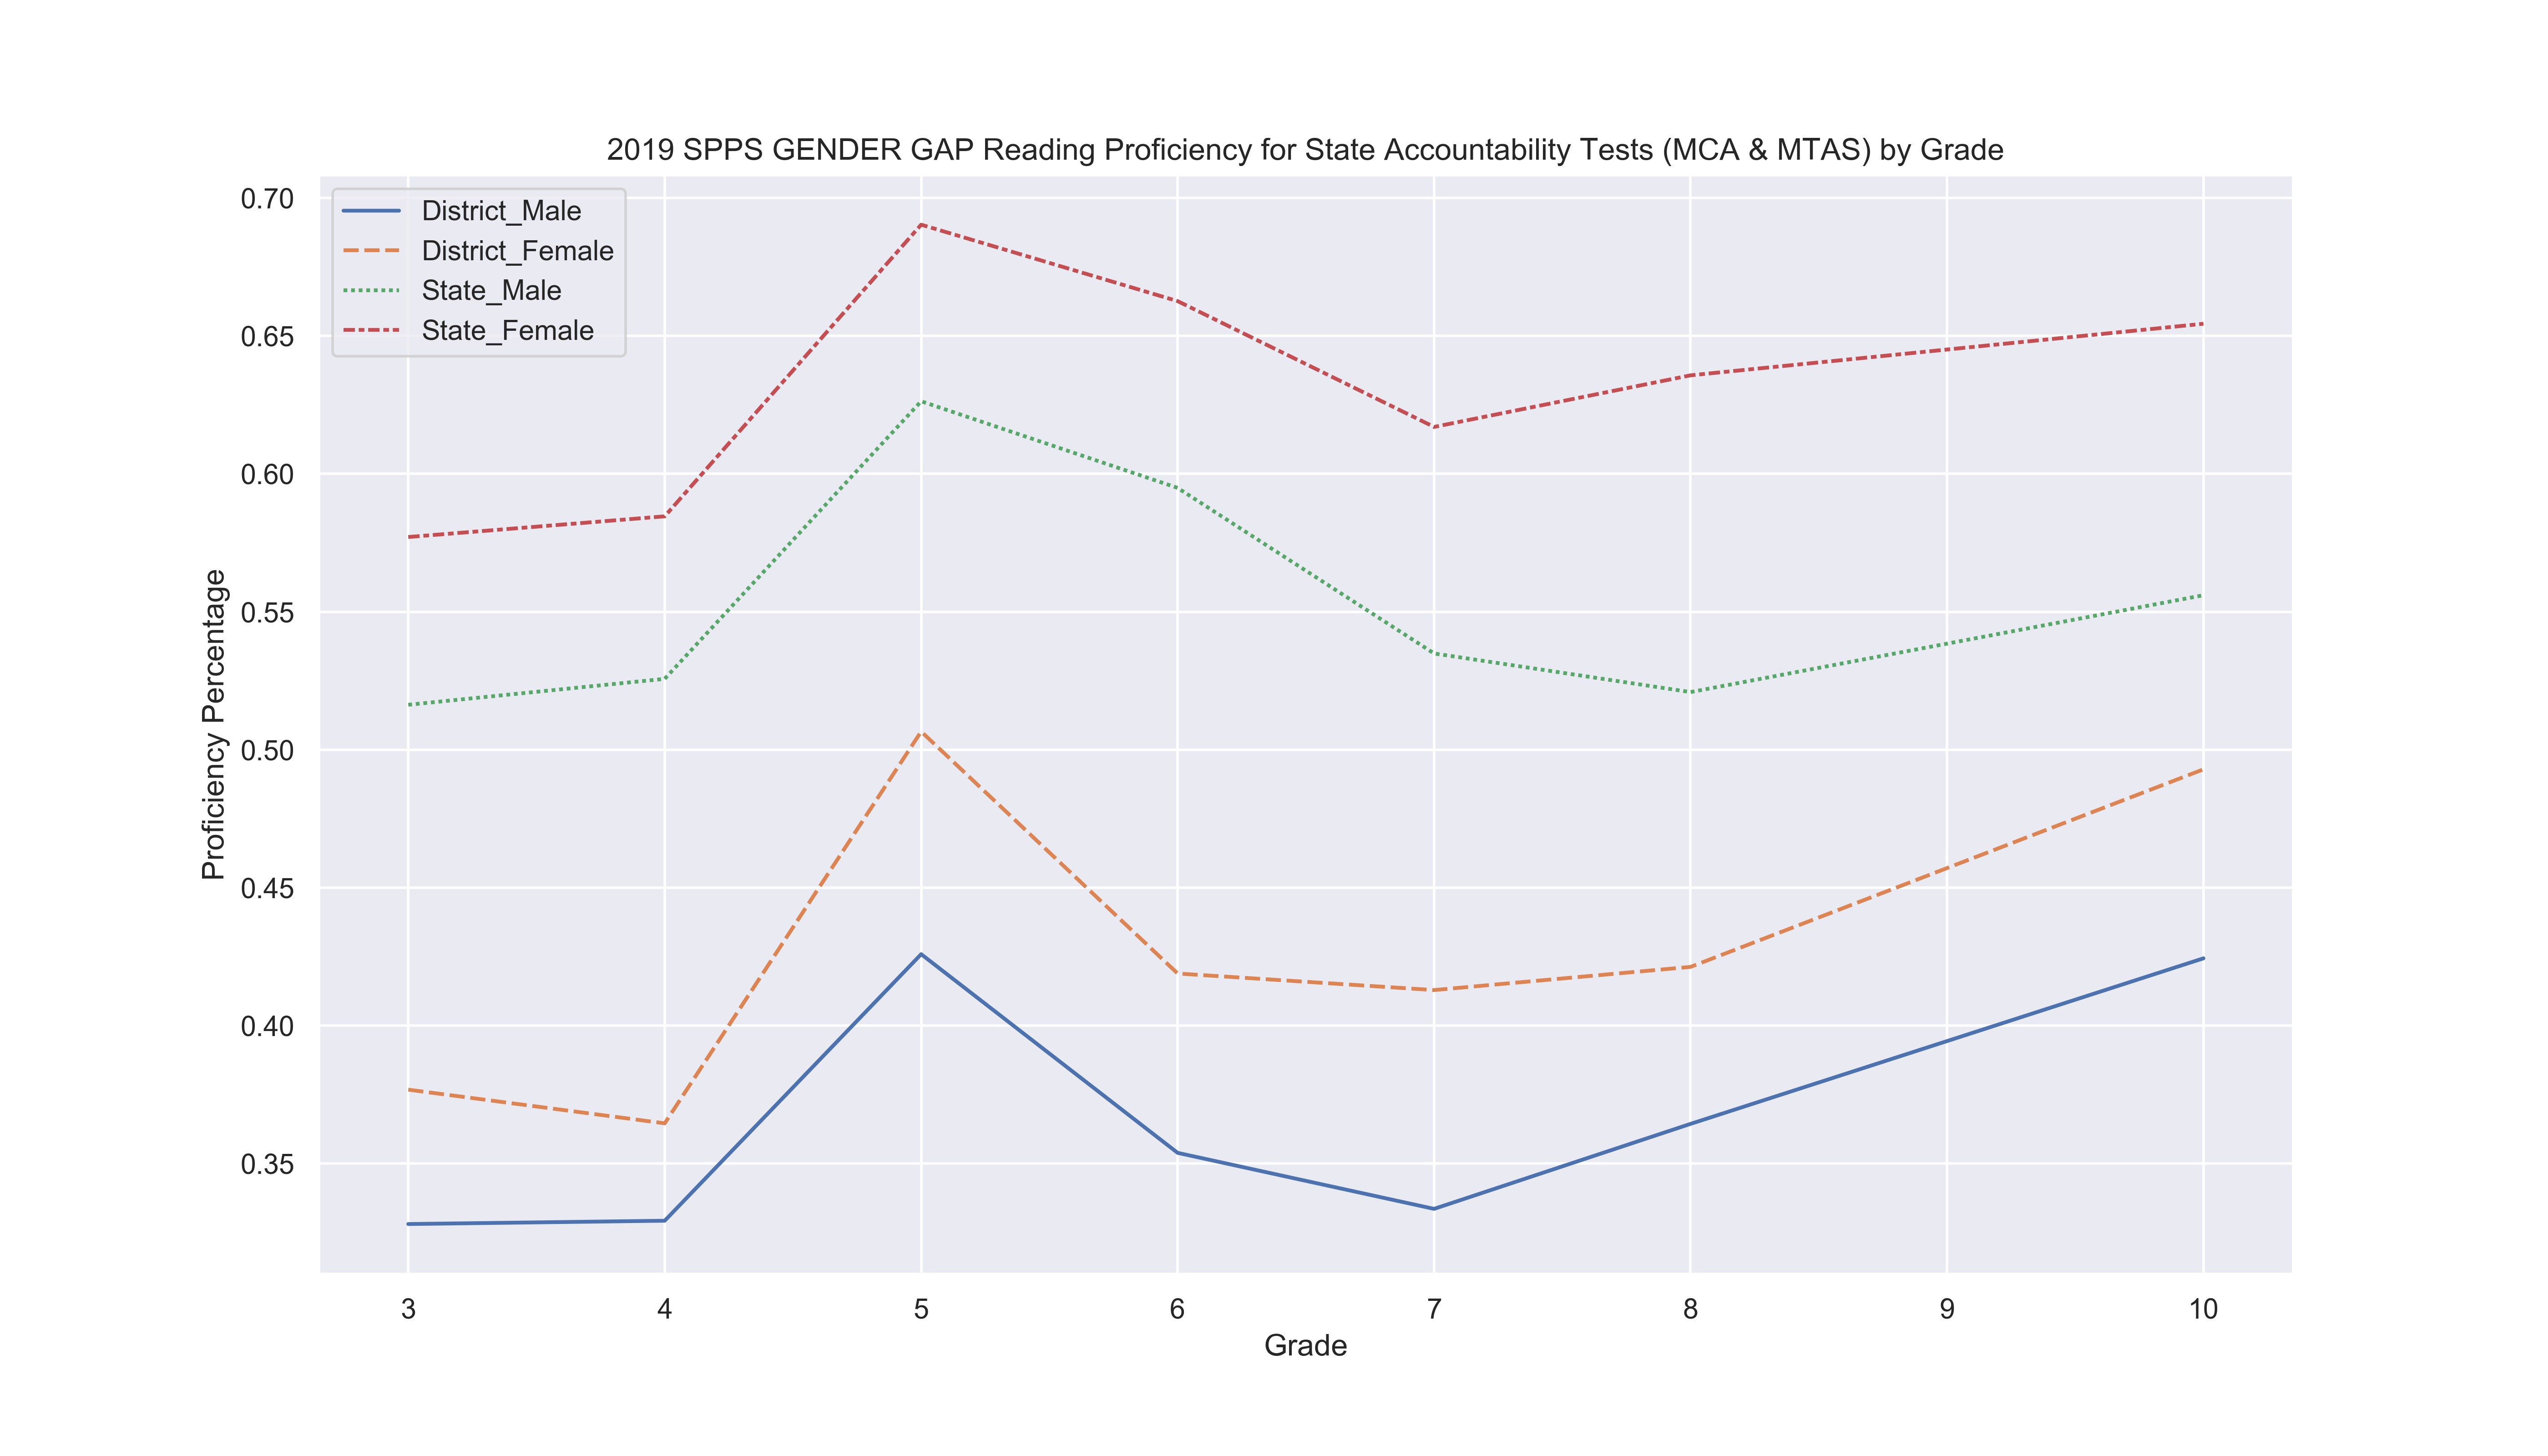
The stereotype is that girls are better in reading than boys, which is confirmed by the graph. At the state level, the gender gap expands being around 15% at 8th grade. From 7th to 8th grade, proficiency of boys declined, while for girls it has increased. On other hand, for SPPS boys proficiency has increased at from 7th to 8th grade with a difference around 5% points.
Racial Gap
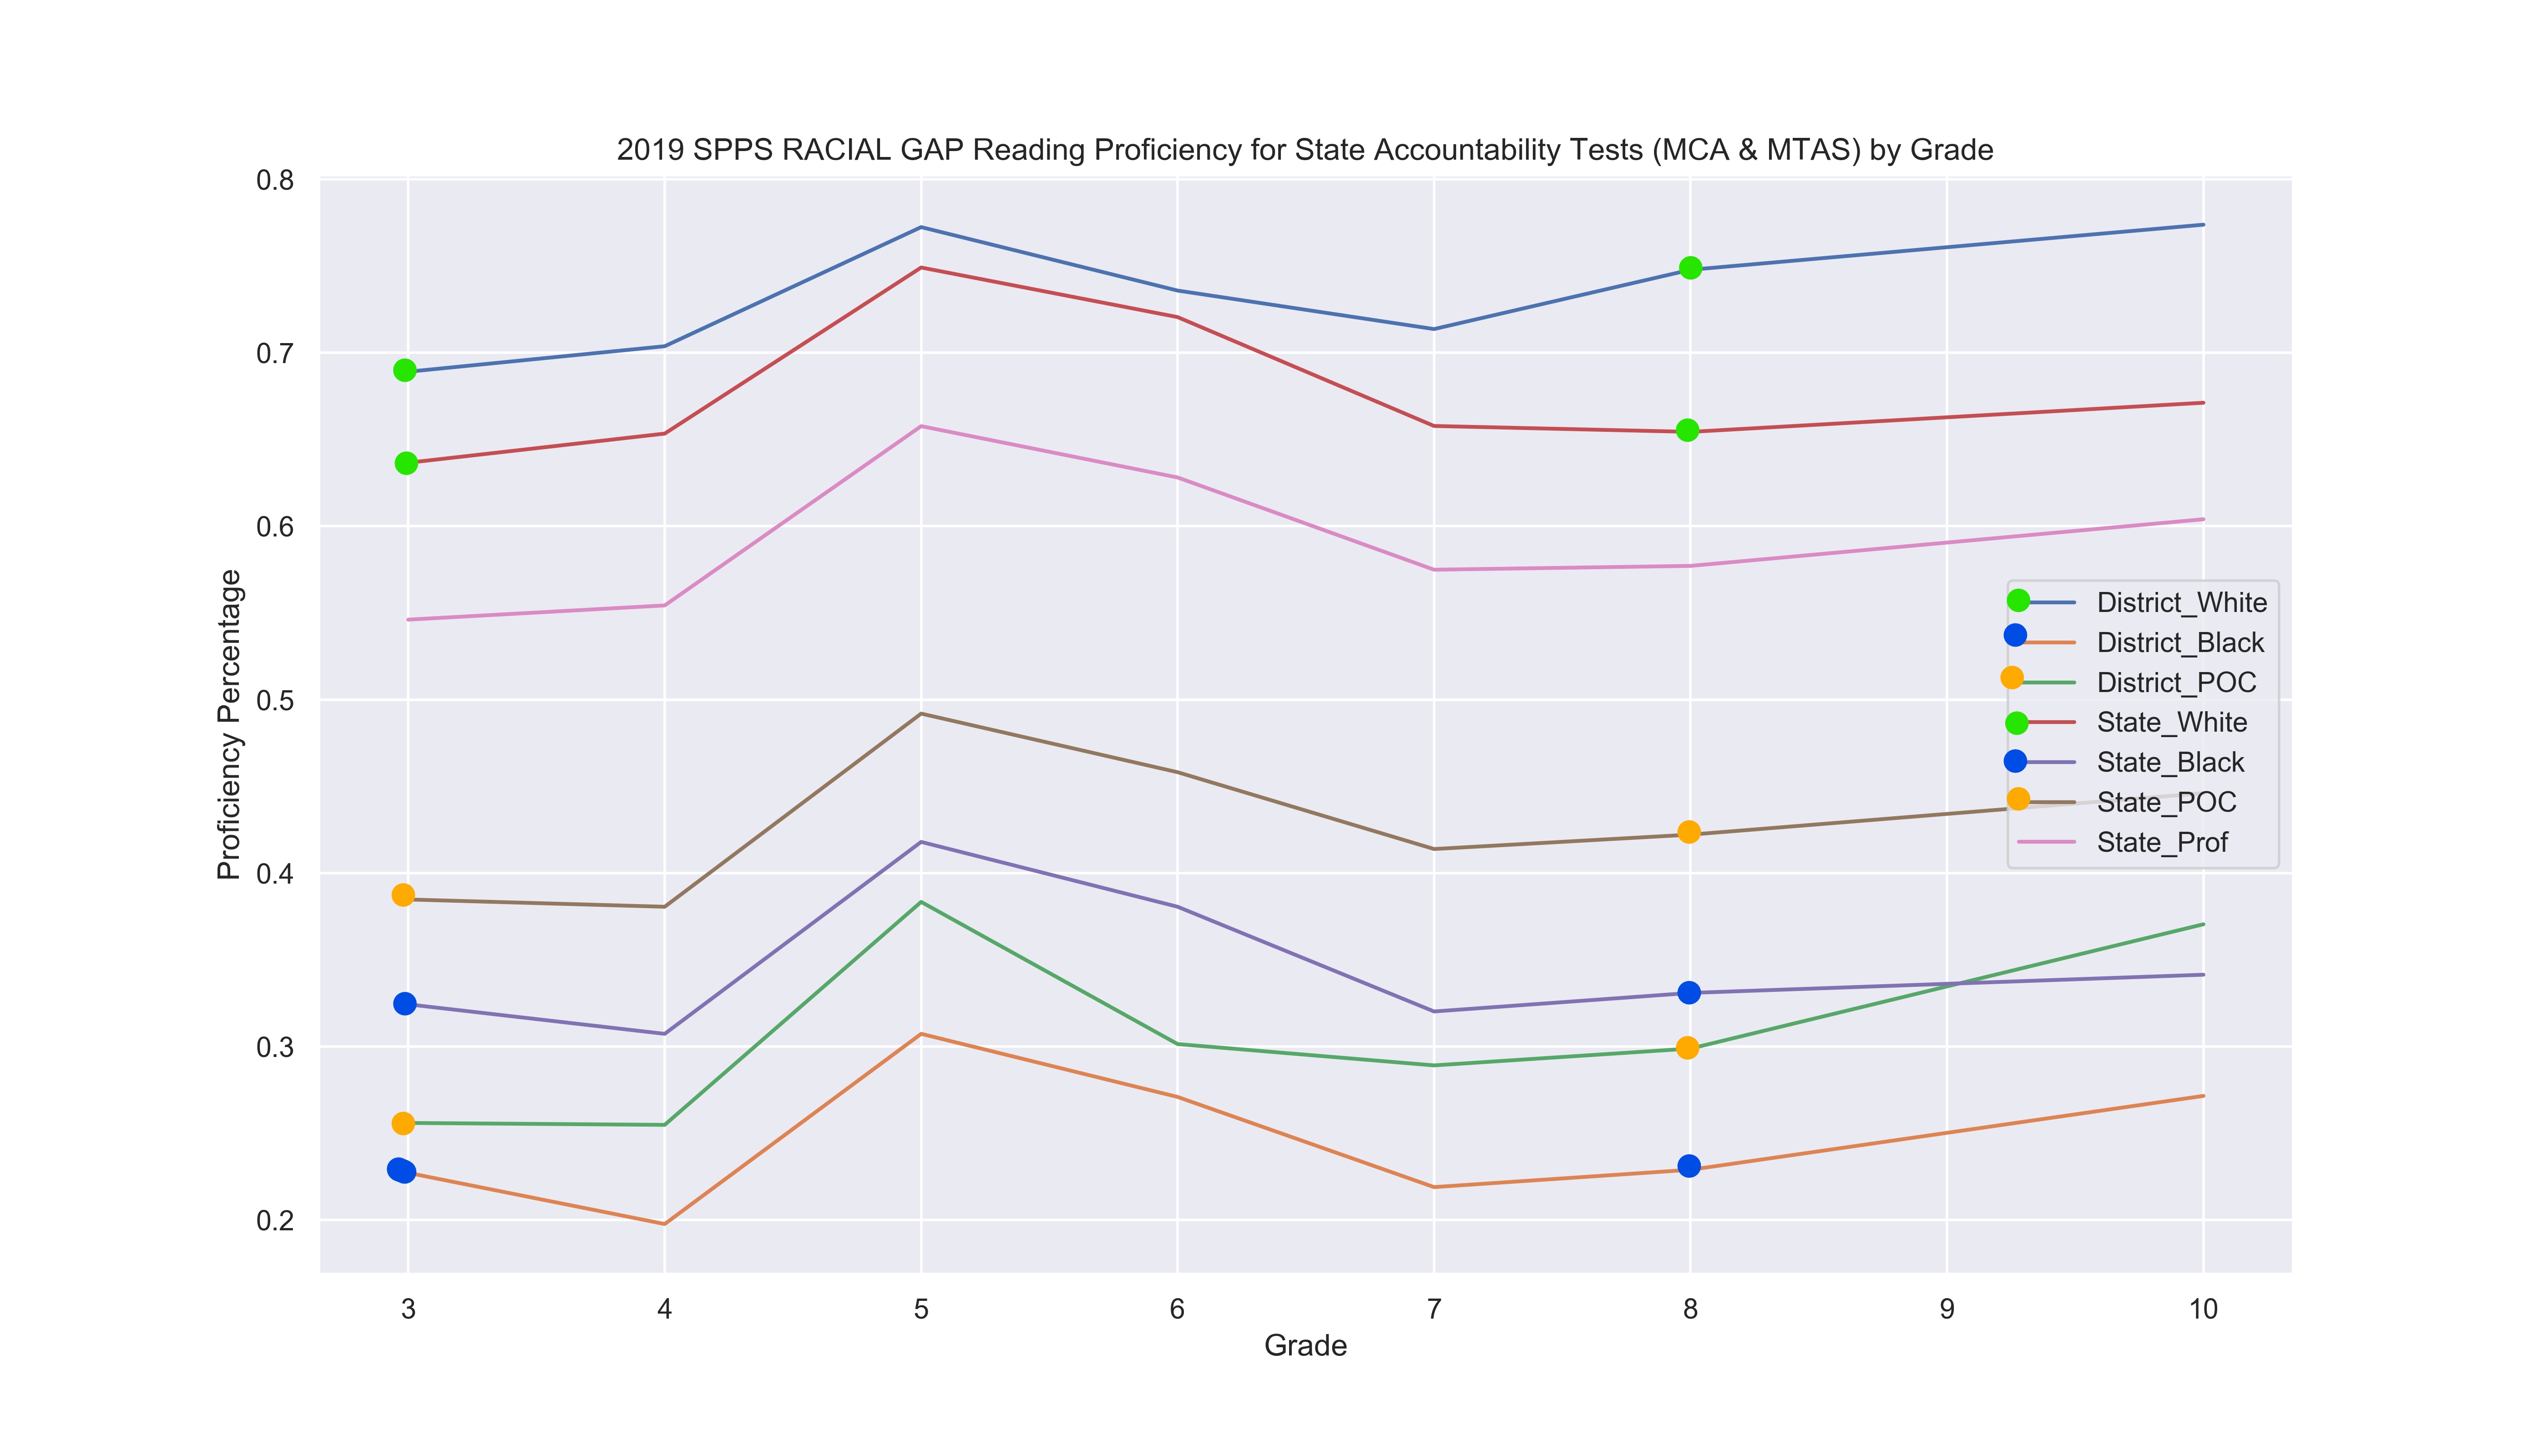
I've color coded the endpoints to make the comparison easier to spot visually. First, we find that white student perform better than state average, and SPPS white students perform 10% points greater than the state by 8th grade on an upward trend. In comparison, the other racial groups are below the state proficiency, and the gap between the state and SPSS is steady at 10% points. By 8th grade, in SPPS, white students perform 50% points greater than black students, same as mathematics.
Economic Gap
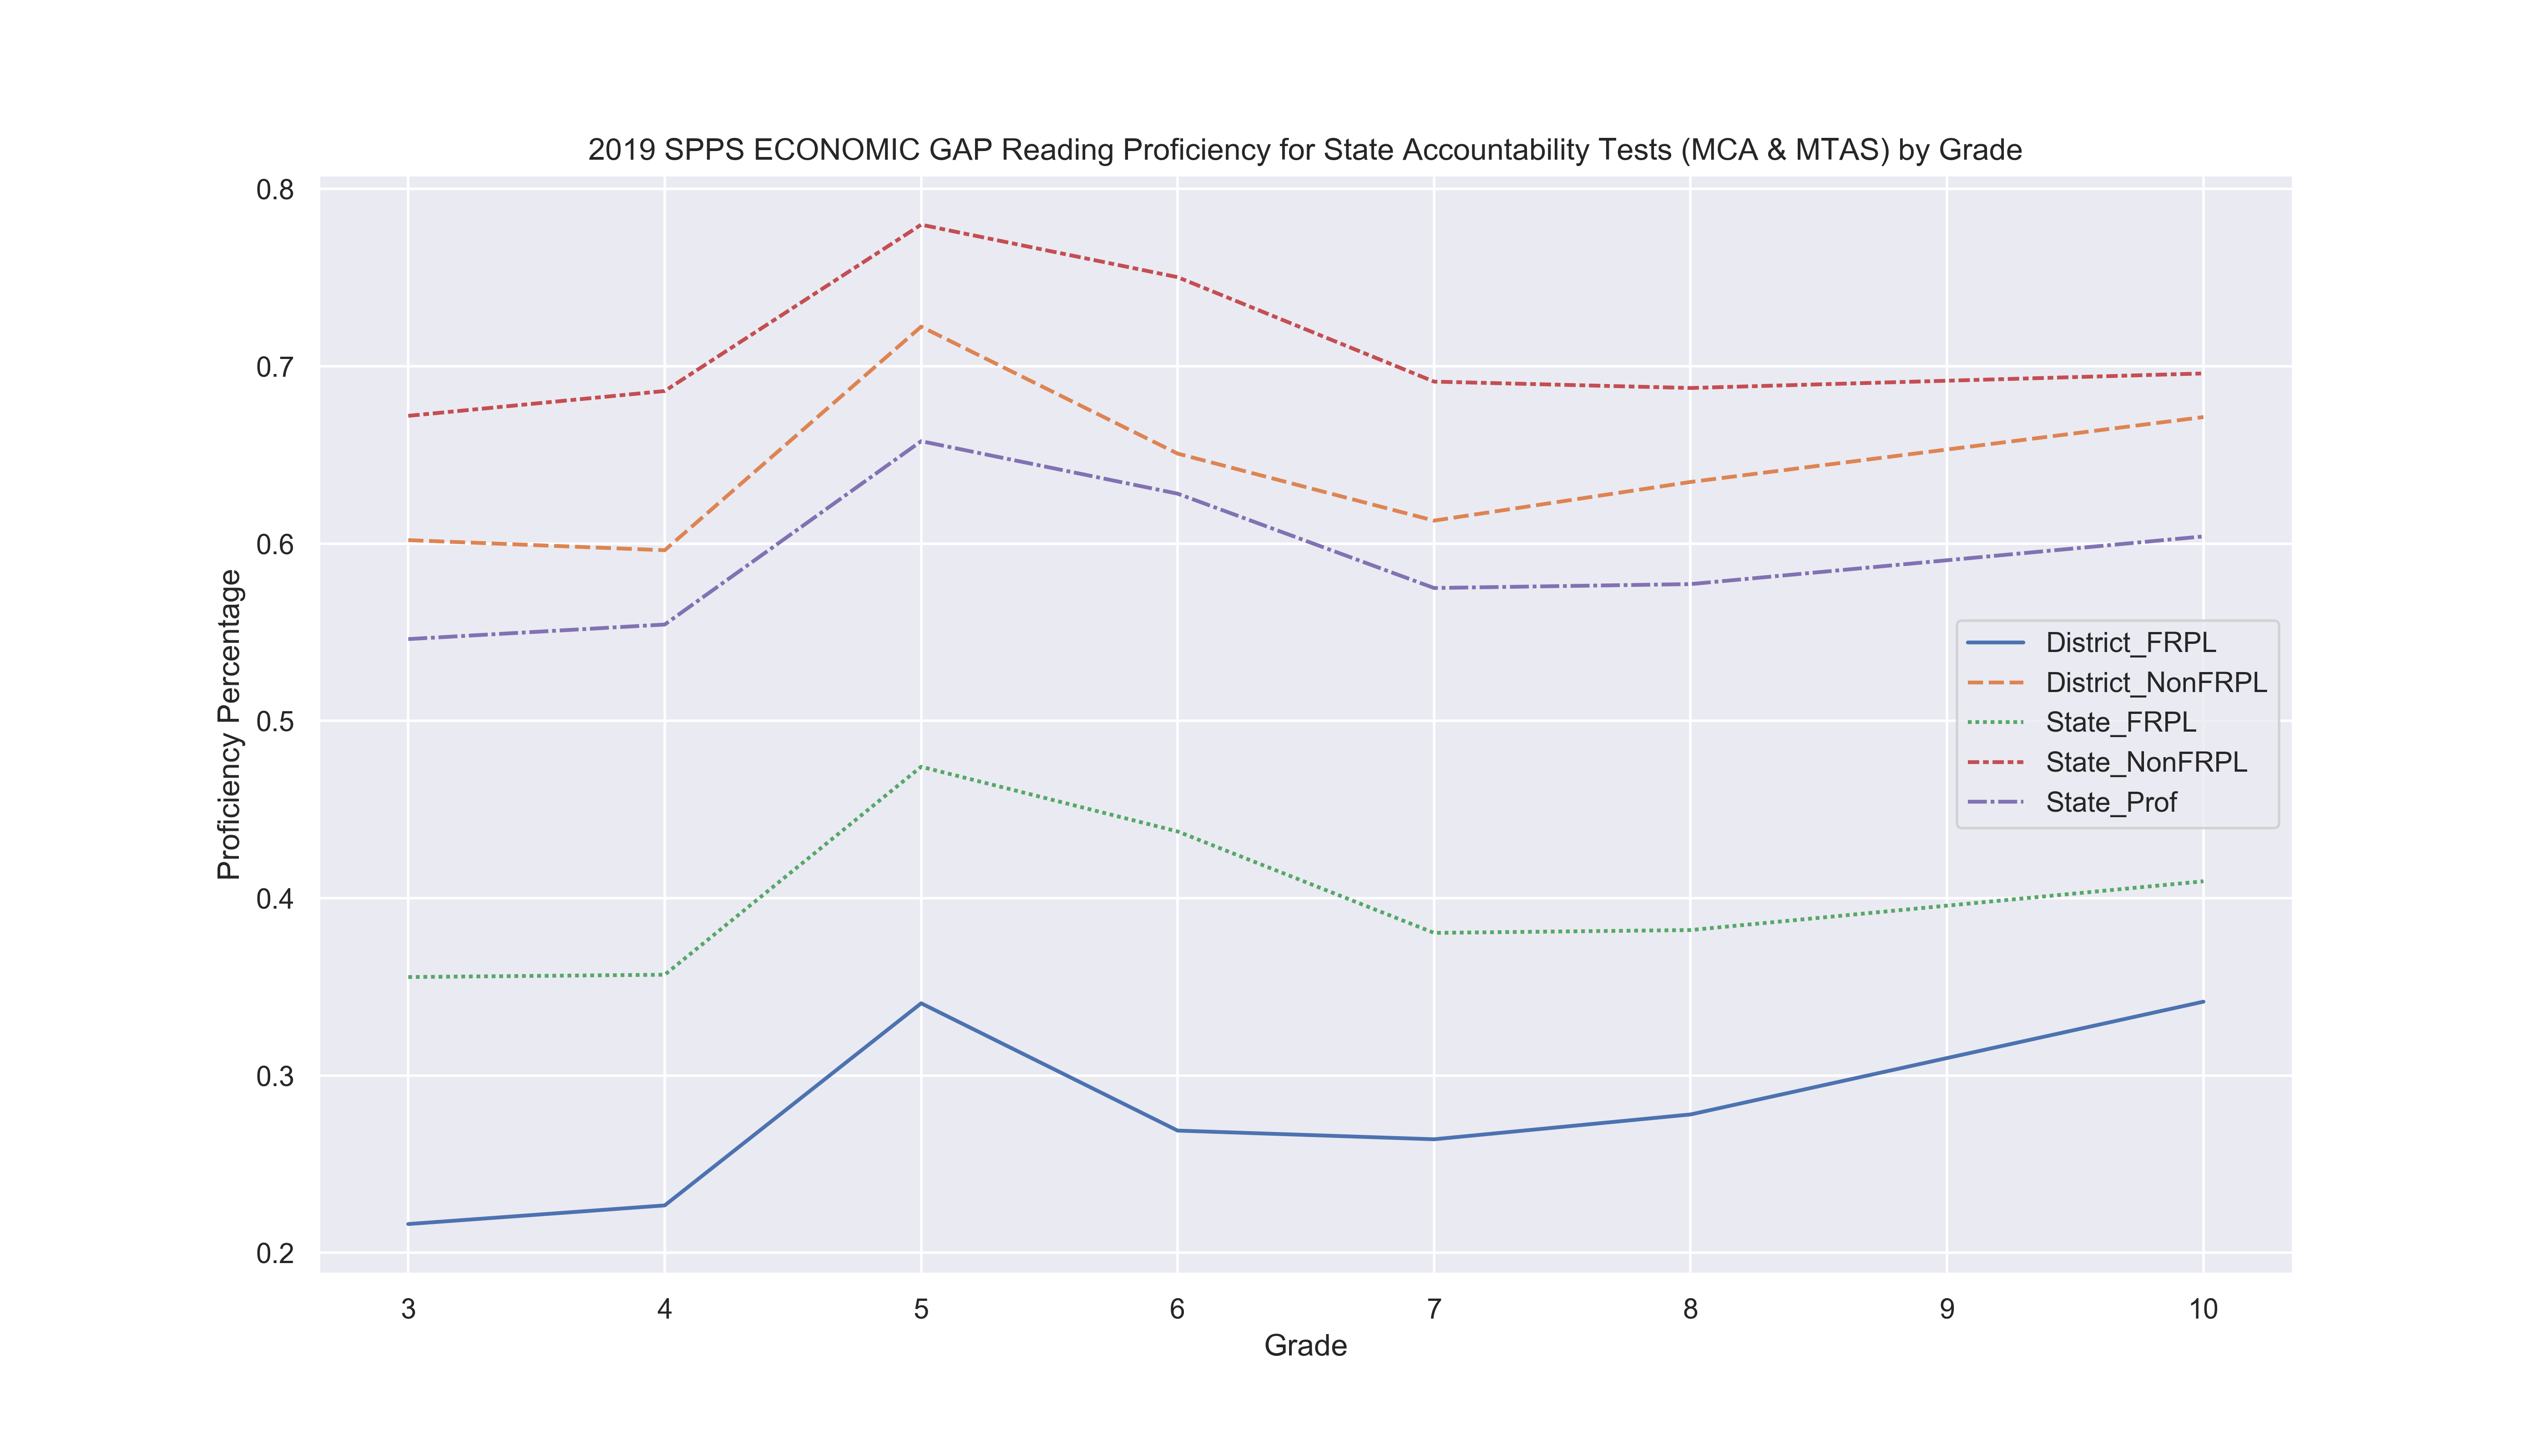
As expected, students with less economic burden will be more proficient than their counterparts. For SPPS NonFRPL students, they perform better than the state average, but less than their state counterparts. Lower income students in SPPS have lower proficiency rates compared to state counterparts, though the gap declined from 13% to 10% at 8th grade.
Standardized Testing Science 
NOTE: there is MCA Science testing for 5th, 8th, and anytime within high school
Proficiency
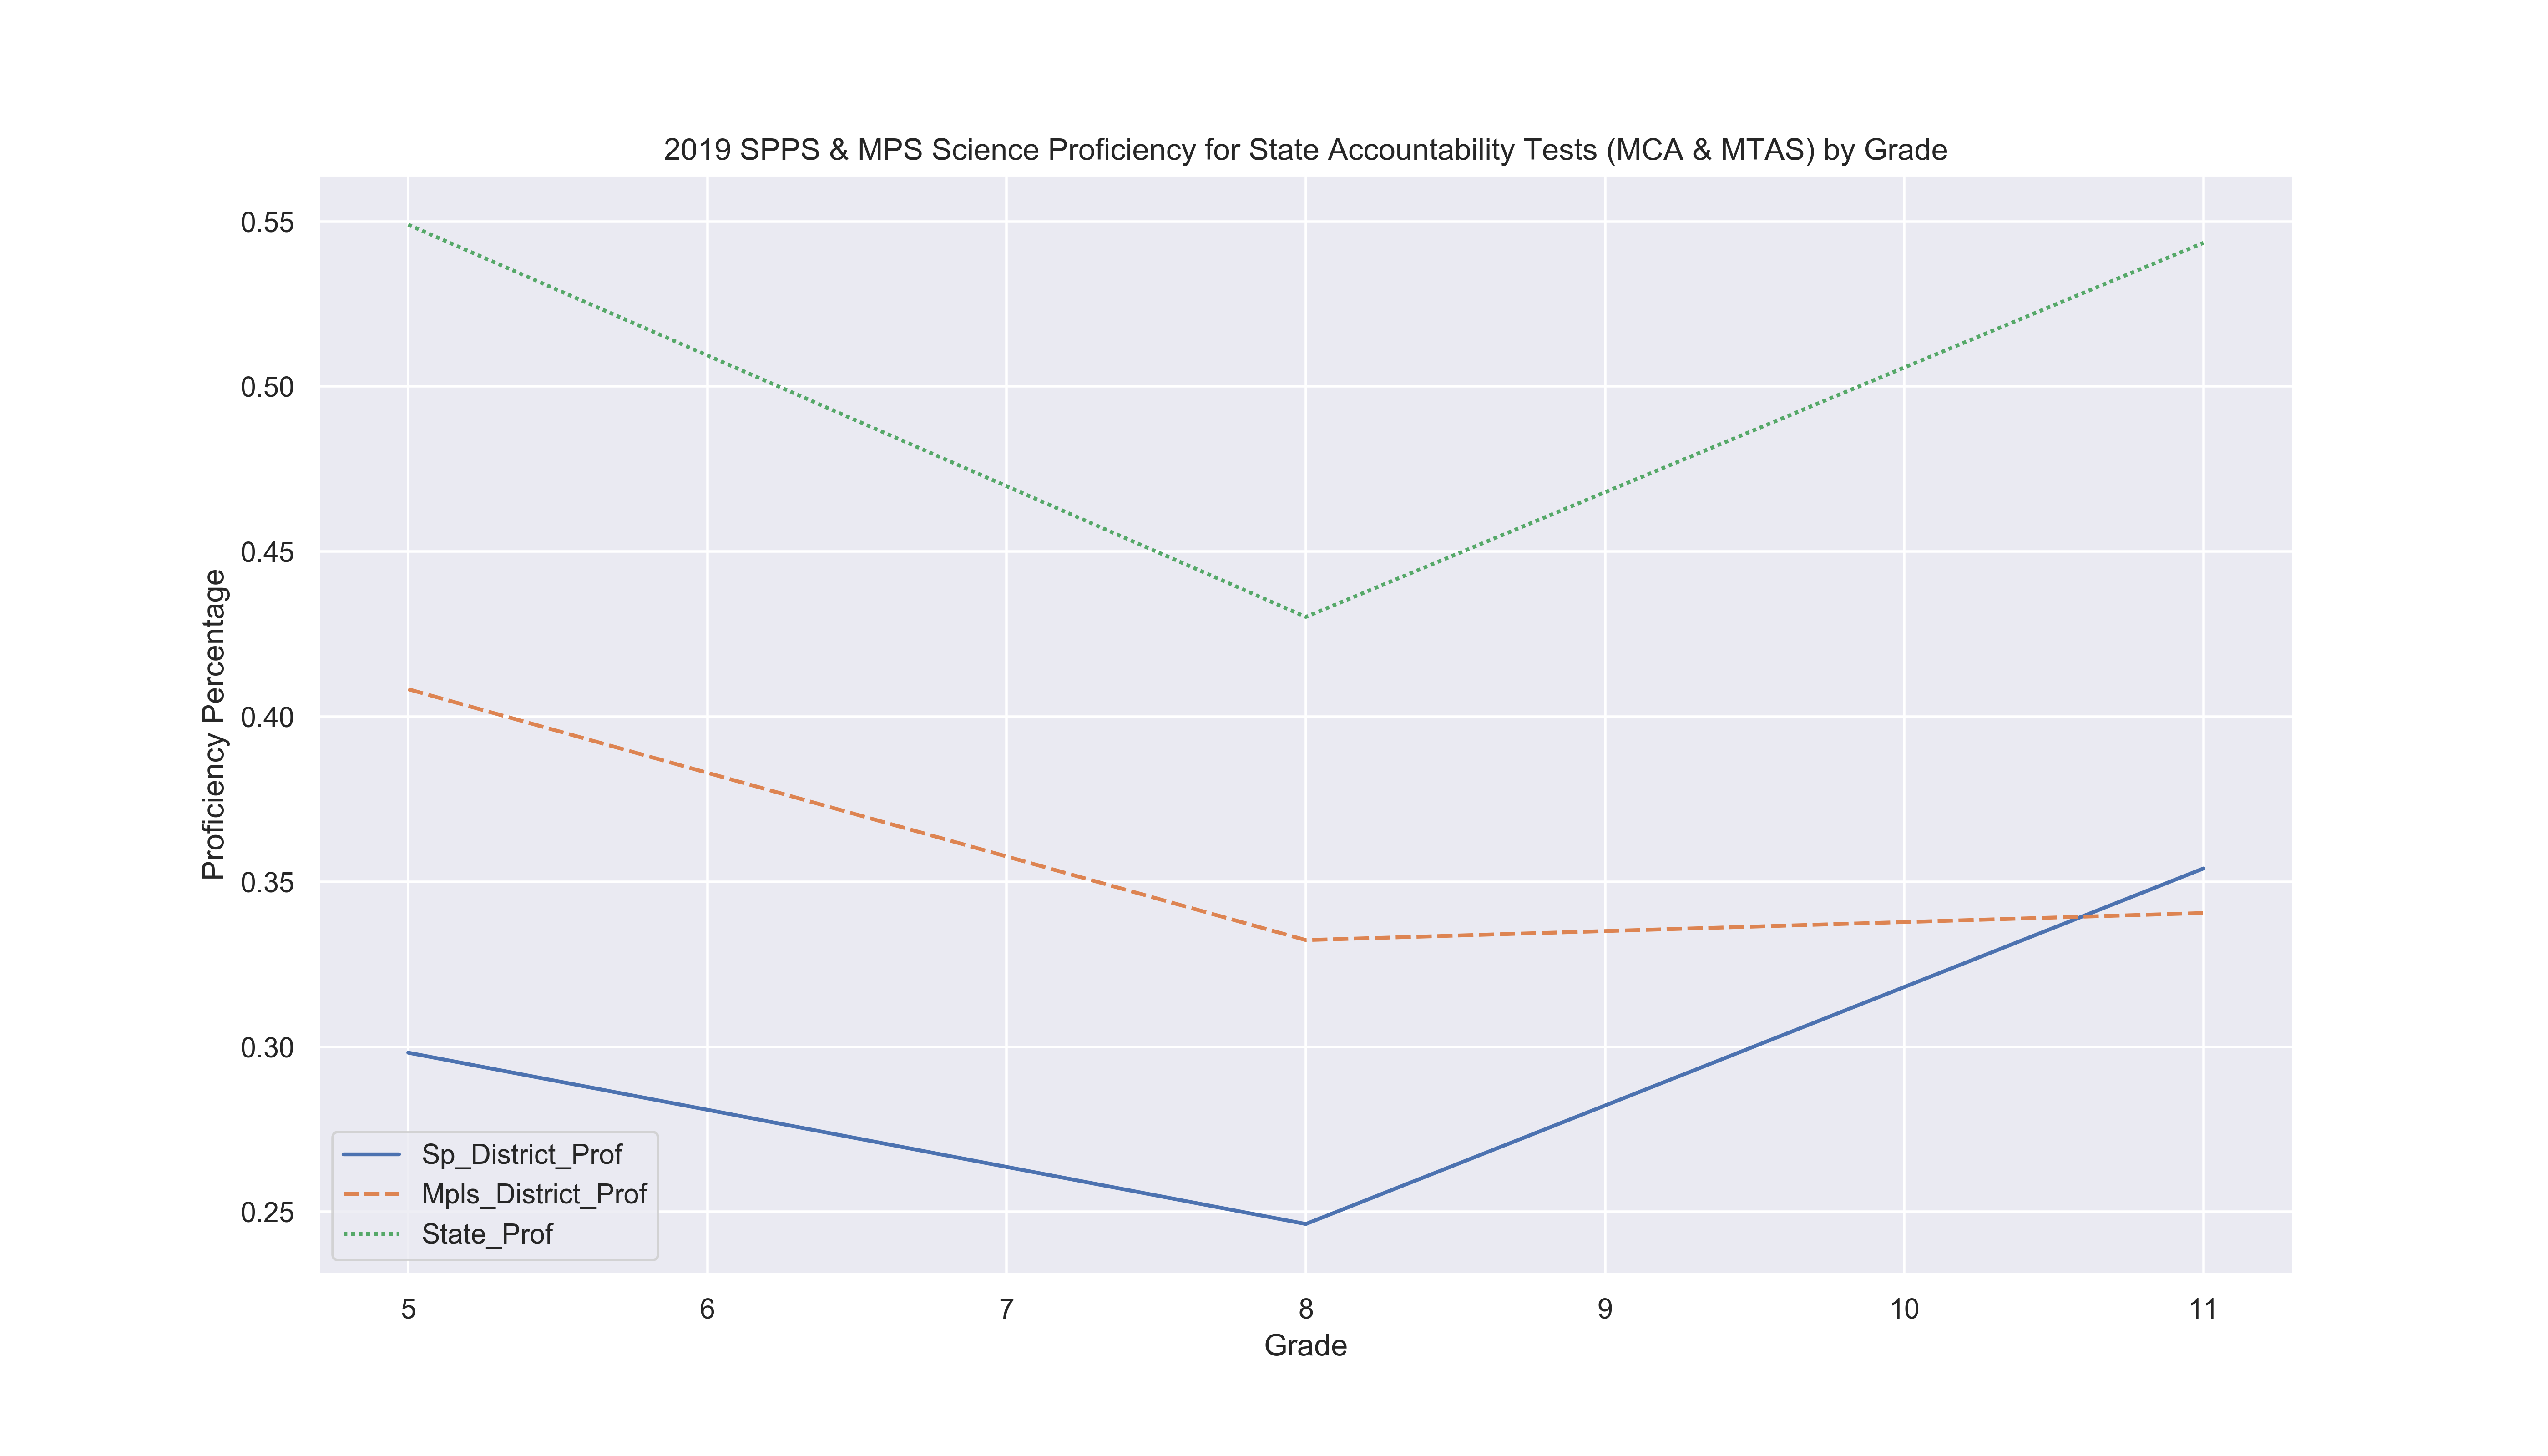
From 5th to 8th grade, MPS and state scores sharply declined in proficiency. SPPS is roughly 18% points less than the state average at 8th grade and at high school level. Interestingly, MPS stagnated from 8th grade to high school level with SPPS doing better. For SPPS, the participation rate is 78.2%, for MPS its 41.7%, and for state it's 87.3%. The drop in proficiency for MPS at the high school level might be due to low participation rate.
Gender Gap

At the state level, the slight gender gap closes by high school. While SPPS, the gender gap expands with boys performing 4% points better than girls. At the state level, the gender gap expands being around 15% at 8th grade. From 7th to 8th grade, proficiency of boys declined, while for girls it has increased. On other hand, for SPPS boys proficiency has increased at from 7th to 8th grade with a difference around 5% points.
Racial Gap
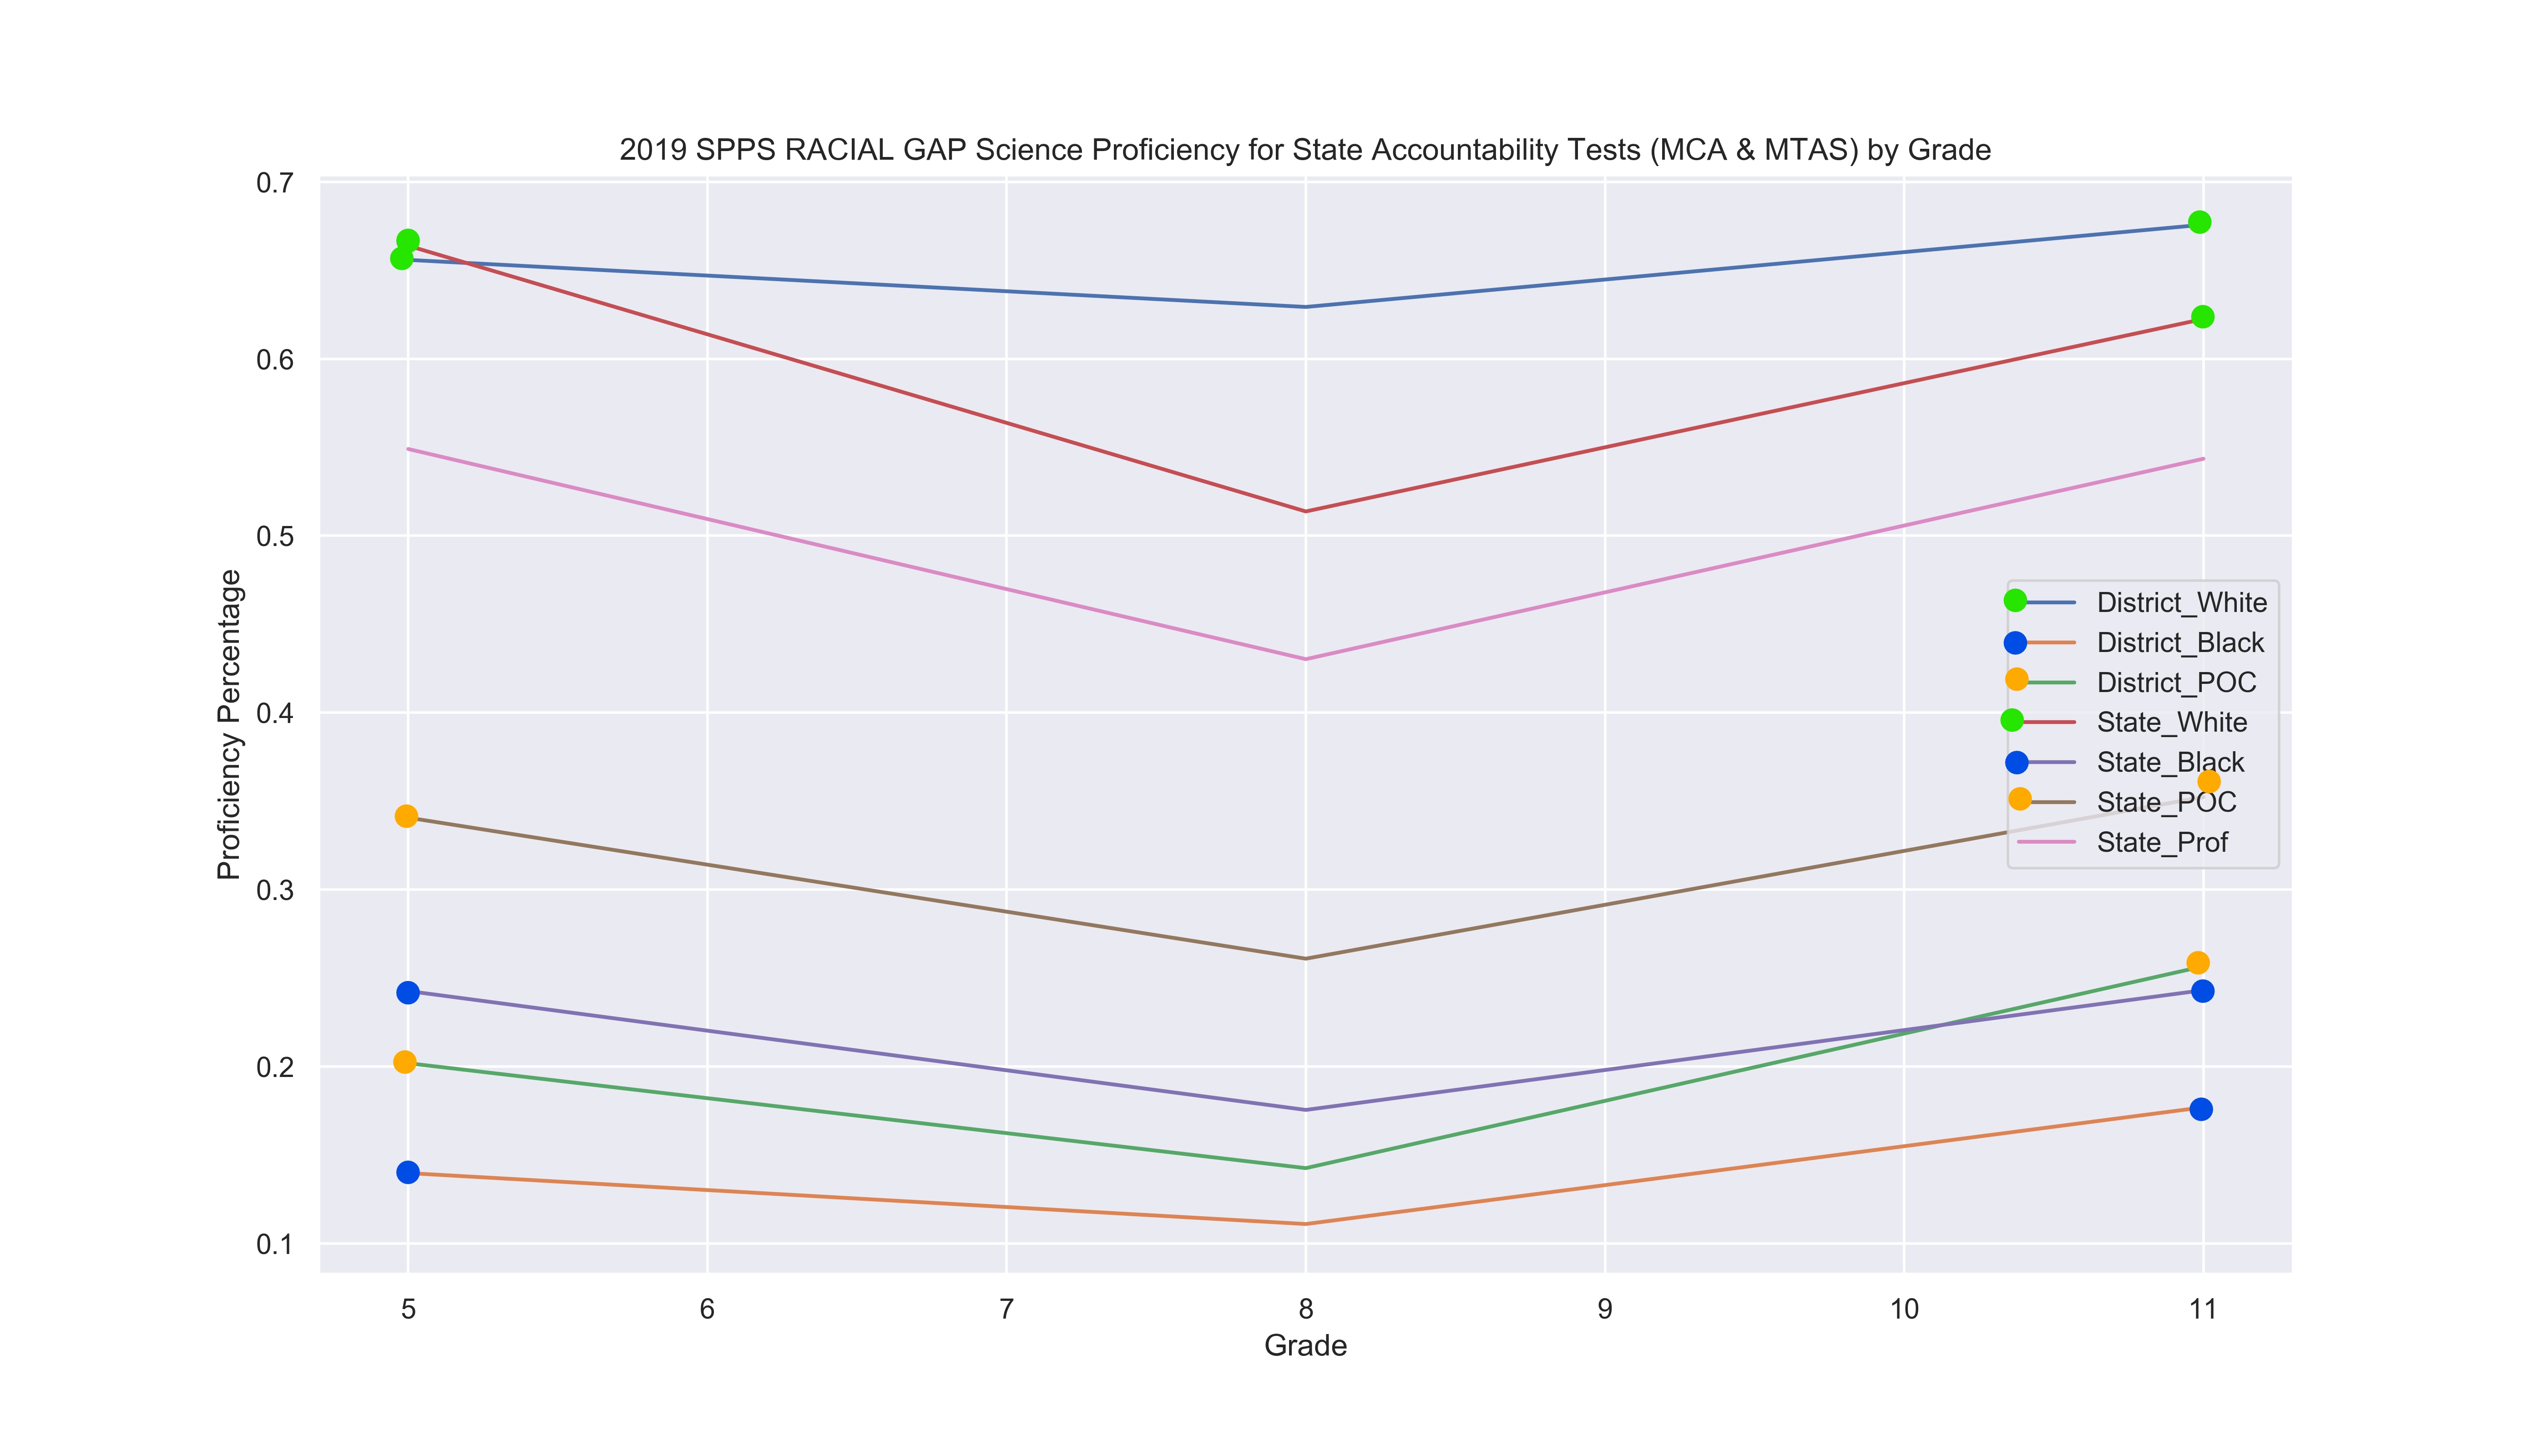
I've color coded the endpoints to make the comparison easier to spot visually. First, we find that white student perform better than state average, and SPPS white students perform 10% points greater than the state by 8th grade and 5% by high school level. In comparison, the other racial groups are below the state proficiency, and the gap between the state and SPPS is steady at 5-8% points. At high school level, in SPPS, white students perform 50% points greater than black students, which is true for all the other subjects.
Economic Gap
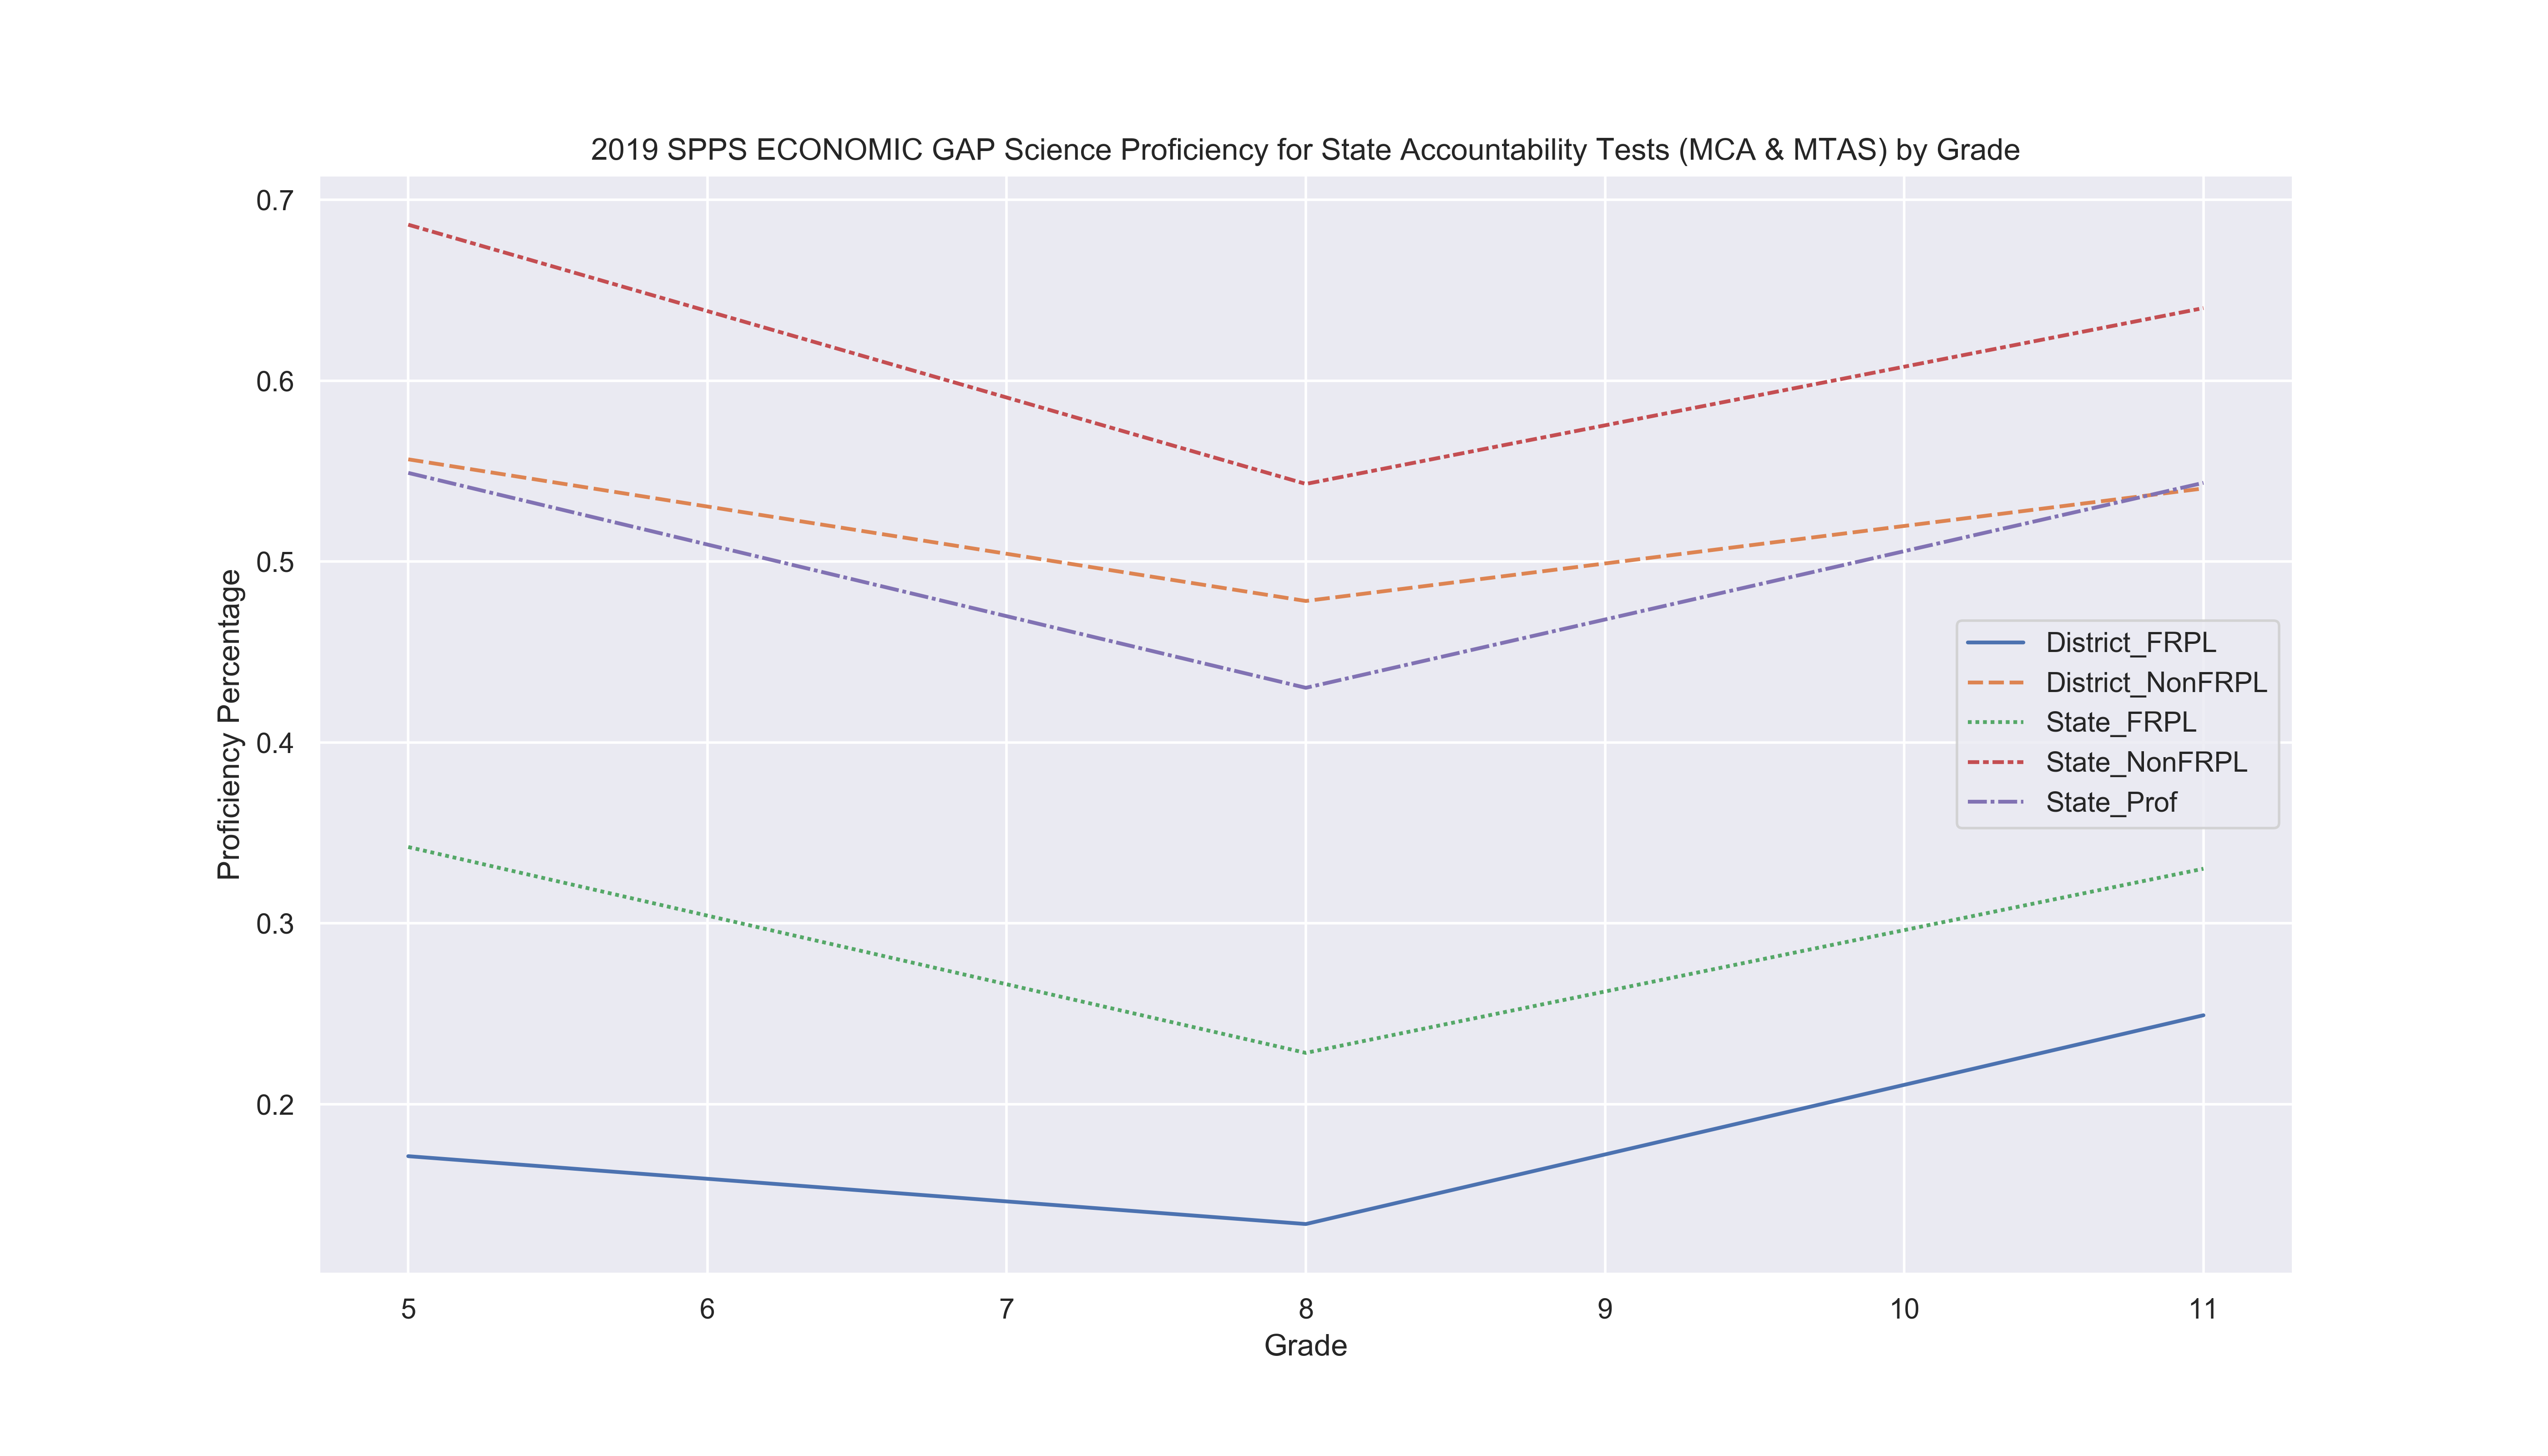
As expected, students with less economic burden will be more proficient than their counterparts. For SPPS NonFRPL students, they perform at the state average, but less than their state counterparts by around 5% points. Lower income students in SPPS have lower proficiency rates compared to state counterparts, though the gap declined from 15% to 10% at the high school level.
District-Wide Interactive Maps on Achievement Gaps 
Note: For all maps, the schools, L'Etoile Du Nord French Immersion U and Mississippi Creative Arts Elementary was excluded because it caused the map software to crash. Also high schoolers were excluded entirely.
Data Methodology: For this analysis, I aggregated the total proficiency for each elementary to middle school. The demographic percentages is based on the students that have taken a standardized exam. The percentage of students in a category has become the normalized scale. The scale is the same for all achievement gap groups to assure to visually see the difference in individual school make-up. In addition, I created ranking system to help distinguish performance for each school. The basic approach was to district average as the mid-point of school performance, and there is bandwidth for each category. The bandwidths were determined arbritarily to get some variation. The ranking specifications and their respective color identifications on shading is below.
The maps are displayed by the same subject matter to make it easier for the viewer to read the data and see the impact of demographic variation.
plot_School_White()
This map displays 2019 Math Proficiency under normalized White%
plot_School_Black()
This map displays 2019 Math Proficiency under normalized Black%
plot_School_Asian()
This map displays 2019 Math Proficiency under normalized Asian%
plot_School_ELL()
This map displays 2019 Math Proficiency under normalized ELL%
plot_School_SPED()
This map displays 2019 Math Proficiency under normalized SPED%
plot_School_FRPL()
This map displays 2019 Math Proficiency under normalized FRPL%
plot_School_White("Reading")
This map displays 2019 Reading Proficiency under normalized White%
plot_School_Black("Reading")
This map displays 2019 Reading Proficiency under normalized Black%
plot_School_Asian("Reading")
This map displays 2019 Reading Proficiency under normalized Asian%
plot_School_ELL("Reading")
This map displays 2019 Reading Proficiency under normalized ELL%
plot_School_SPED("Reading")
This map displays 2019 Reading Proficiency under normalized SPED%
plot_School_FRPL("Reading")
This map displays 2019 Reading Proficiency under normalized FRPL%
plot_School_White("Science")
This map displays 2019 Science Proficiency under normalized White%
plot_School_Black('Science')
This map displays 2019 Science Proficiency under normalized Black%
plot_School_Asian("Science")
This map displays 2019 Science Proficiency under normalized Asian%
plot_School_ELL("Science")
plot_School_SPED("Science")
plot_School_FRPL("Science")
Advanced Demographic Breakdown
Homeless Students 
In Saint Paul, there is over 643 homeless students, and it makes up around 8% of the homeless student population in the state. According to the numbers tested for Reading, around 61% of the homeless student population is Black. The following map below show the schools with highest number of homeless. Note: the map is interactive, clicking on the circle will display the school and other information.
In-Dept Achievement Gap Analysis 
With all these different achievement gaps, how do we address closing these inequities, and which factors matter the most, is it race, gender, and/or income status. From the earlier graphs above, for SPPS there is 50% points between white and black students across all subject testings, but for economic it's around 30% points. However, several Minnesota researchers stated that poverty (FRPL designation) has the greatest influence on state proficiency. This might not be too intuitive at first to many. The simple explanation is that poverty is highly correlated with race in SPPS; i.e. most black students are in the FRPL category in comparison to their counterparts. To highlight this, I break down the sub category demographics in respect to race and poverty for the state level and SPPS district for MCA Reading testing. The data was manually entered through the Minnesota Report Card Note: I did not include MPS because of the low participation rate. First, let's explore the state-level data. Also the data is restricted from 3rd to 8th Grade and 10th Grade.
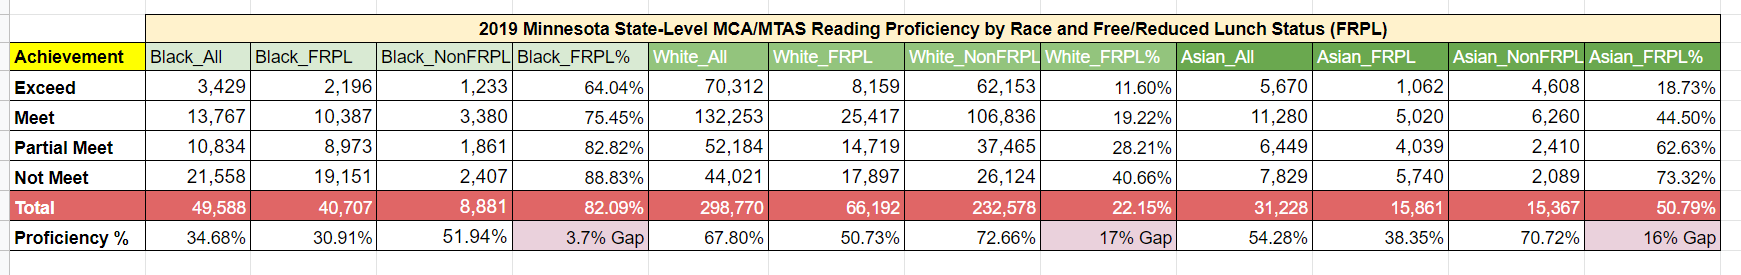
This is a bit confusing to read so let's break down the first row. For the Exceed proficiency, 3,429 black students achieved this with 2,196 students having FRPL status, which makes 64.04% of the group. In comparison, only 11.60% of White students that are in the Exceed category have FRPL status. In the "Total row", for the state 82% of all black students are receiving FRPL status, with 22% for white students and nearly 50% of Asian students. The last row shows the proficiency percentage for each category with the shaded cell indicating the gap between proficiency. For example, for all black students, 34.68% were proficient and for black FRPL students 30.91% were proficient, which is a gap around 3.7%. The gap is smaller compared to other groups because majority of black students have FRPL status, though black students in the nonFRPL category do not have considerably high proficiency rate. Notice, that for both for white and asian students the gap is higher though notice proficiency difference between Asian students of income status, non-FRPL students do considerably better. The SPPS picture looks quite different.
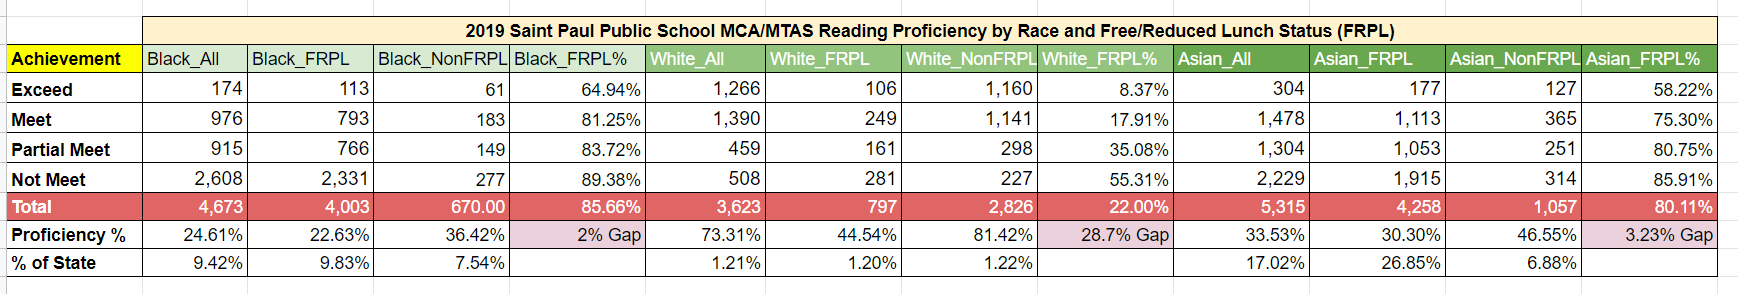
For Saint Paul, the percentage of black students with FRPL status is even higher at 85.66% with a respective 2% gap. Though student proficiency is lower than compared to non-urban counterparts. For white NonFRPL students, they perform better than their state counterparts because most of the state is rural which consist primarily of white people and there are wealthy white families in Saint Paul. Thus the White_FRPL proficiency gap is even larger than compared to the state. In Saint Paul, around 80% of asian students have FRPL status and have respectfully a small proficiency gap. Notice the Asian_NonFRPL students do not perform as well their out of city counterparts. This could possibly be explained that new immigrant communities leave Saint Paul when they get more wealth, and there is a population of highly skilled professionals in the suburbs. In this table, there is an additional row, "% of State", which indicates the percentage of the total population that lives in Saint Paul. For example, 9.42% of all black students live in Saint Paul. Likewise, only 1.2% of white students live in Saint Paul. For Asian students, Saint Paul comprises 17% of the total population and around 27% of FRPL students. In addition, notice that Asian_NonFRPL only consist around 7% of the population, suggesting that wealthier asians do not live in Saint Paul.
In summary, we see how prevalent poverty is in SPSS, though even controlling for FRPL status, achievement gaps still exist across racial lines. In the next section, I will be displaying the summary proficiency results of the elementary and middle schools.
Elementary Schools: District/State Level by Grade 
I will be splitting the elementary schools into four and five schools each sorted by increasing FRPL population. It is expected that the first group will perform better than the last group. I've designed it this way, so the audience can compare the assessments of similar schools.
Reading Data
Reading.query('Num==0 and Grade in (3,4,5)')
| School | Num | Grade | Prof | White_Prof | POC_Prof | Black_Prof | Male_Prof | Female_Prof | FRPL_Prof | NonFRPL_Prof | |
|---|---|---|---|---|---|---|---|---|---|---|---|
| 161 | Sp_District_All | 0.0 | 3.0 | 0.3525 | 0.6891 | 0.2558 | 0.2270 | 0.3281 | 0.3768 | 0.2162 | 0.6019 |
| 162 | Sp_District_All | 0.0 | 4.0 | 0.3463 | 0.7038 | 0.2547 | 0.1975 | 0.3293 | 0.3646 | 0.2267 | 0.5962 |
| 163 | Sp_District_All | 0.0 | 5.0 | 0.4658 | 0.7725 | 0.3833 | 0.3072 | 0.4259 | 0.5066 | 0.3407 | 0.7223 |
| 168 | Mpls_District_All | 0.0 | 3.0 | 0.4587 | 0.7578 | 0.2752 | 0.2407 | 0.4318 | 0.4871 | 0.2408 | 0.7355 |
| 169 | Mpls_District_All | 0.0 | 4.0 | 0.4398 | 0.7856 | 0.2524 | 0.2181 | 0.4261 | 0.4551 | 0.2296 | 0.7315 |
| 170 | Mpls_District_All | 0.0 | 5.0 | 0.5335 | 0.8656 | 0.3370 | 0.3016 | 0.4944 | 0.5701 | 0.3251 | 0.8199 |
| 175 | State_All | 0.0 | 3.0 | 0.5461 | 0.6366 | 0.3847 | 0.3242 | 0.5163 | 0.5771 | 0.3555 | 0.6720 |
| 176 | State_All | 0.0 | 4.0 | 0.5543 | 0.6534 | 0.3805 | 0.3072 | 0.5257 | 0.5846 | 0.3568 | 0.6860 |
| 177 | State_All | 0.0 | 5.0 | 0.6577 | 0.7492 | 0.4919 | 0.4179 | 0.6263 | 0.6903 | 0.4741 | 0.7798 |
Math Data
Math.query('Num==0 and Grade in (3,4,5)')
| School | Num | Grade | Prof | White_Prof | POC_Prof | Black_Prof | Male_Prof | Female_Prof | FRPL_Prof | NonFRPL_Prof | |
|---|---|---|---|---|---|---|---|---|---|---|---|
| 161 | Sp_District_All | 0.0 | 3.0 | 0.3966 | 0.7251 | 0.3021 | 0.2486 | 0.4268 | 0.3664 | 0.2625 | 0.6425 |
| 162 | Sp_District_All | 0.0 | 4.0 | 0.3903 | 0.7227 | 0.3046 | 0.2259 | 0.3993 | 0.3804 | 0.2790 | 0.6229 |
| 163 | Sp_District_All | 0.0 | 5.0 | 0.3127 | 0.6074 | 0.2332 | 0.1432 | 0.3153 | 0.3100 | 0.2070 | 0.5296 |
| 168 | Mpls_District_All | 0.0 | 3.0 | 0.5181 | 0.8195 | 0.3329 | 0.2849 | 0.5326 | 0.5028 | 0.2980 | 0.7967 |
| 169 | Mpls_District_All | 0.0 | 4.0 | 0.4820 | 0.8122 | 0.3032 | 0.2585 | 0.5102 | 0.4506 | 0.2705 | 0.7737 |
| 170 | Mpls_District_All | 0.0 | 5.0 | 0.4030 | 0.7466 | 0.1979 | 0.1530 | 0.4108 | 0.3956 | 0.1812 | 0.7047 |
| 175 | State_All | 0.0 | 3.0 | 0.6560 | 0.7612 | 0.4680 | 0.3849 | 0.6796 | 0.6314 | 0.4518 | 0.7905 |
| 176 | State_All | 0.0 | 4.0 | 0.6387 | 0.7465 | 0.4492 | 0.3499 | 0.6530 | 0.6235 | 0.4323 | 0.7762 |
| 177 | State_All | 0.0 | 5.0 | 0.5204 | 0.6158 | 0.3475 | 0.2580 | 0.5297 | 0.5107 | 0.3206 | 0.6532 |
Science Data
Science.query('Num==0 and Grade=="5"')
| School | Num | Grade | Prof | White_Prof | POC_Prof | Black_Prof | Male_Prof | Female_Prof | FRPL_Prof | NonFRPL_Prof | |
|---|---|---|---|---|---|---|---|---|---|---|---|
| 57 | Sp_District_All | 0.0 | 5 | 0.2982 | 0.6559 | 0.2018 | 0.1397 | 0.2962 | 0.3002 | 0.1713 | 0.5565 |
| 60 | Mpls_District_All | 0.0 | 5 | 0.4083 | 0.7759 | 0.1885 | 0.1437 | 0.4193 | 0.3980 | 0.1810 | 0.7172 |
| 63 | State_All | 0.0 | 5 | 0.5490 | 0.6639 | 0.3406 | 0.2426 | 0.5626 | 0.5348 | 0.3422 | 0.6862 |
Enroll.query('Num in (518,557,483,545,462)')
| Num | School | Tot_Enroll | Male% | White% | Black% | Asian% | FRP% | ELL% | SPED% | Homeless% | |
|---|---|---|---|---|---|---|---|---|---|---|---|
| 29 | 462.0 | L'Etoile Du Nord French Immersion U | 304.0 | 39.80 | 53.62 | 19.41 | 3.62 | 30.26% | 12.50% | 4.61% | 0.00% |
| 37 | 483.0 | Jie Ming Mandarin Immersion Academy | 293.0 | 47.10 | 30.03 | 8.19 | 31.06 | 25.60% | 26.62% | 3.07% | 0.00% |
| 46 | 518.0 | Horace Mann School | 432.0 | 49.07 | 66.90 | 13.19 | 3.47 | 21.53% | 9.03% | 9.95% | 0.46% |
| 53 | 545.0 | Randolph Heights Elementary | 447.0 | 51.68 | 64.65 | 13.20 | 6.26 | 28.41% | 12.30% | 5.15% | 0.45% |
| 56 | 557.0 | St. Anthony Park Elementary | 515.0 | 50.87 | 60.97 | 11.46 | 11.07 | 25.44% | 16.50% | 9.51% | 0.00% |
Reading Data

Reading.query('Num in (518,557,483,545,462)')
| School | Num | Grade | Prof | White_Prof | POC_Prof | Black_Prof | Male_Prof | Female_Prof | FRPL_Prof | NonFRPL_Prof | |
|---|---|---|---|---|---|---|---|---|---|---|---|
| 38 | L'Etoile Du Nord French Immersion U | 462.0 | 3.0 | 0.6230 | 0.7857 | 0.4848 | 0.6923 | 0.6522 | 0.6053 | 0.4286 | 0.6809 |
| 39 | L'Etoile Du Nord French Immersion U | 462.0 | 4.0 | 0.6230 | 0.8571 | 0.3077 | 0.3333 | 0.6296 | 0.6176 | 0.3500 | 0.7561 |
| 40 | L'Etoile Du Nord French Immersion U | 462.0 | 5.0 | 0.8625 | 0.9000 | 0.8250 | 0.9333 | 0.9259 | 0.8302 | 0.7500 | 0.9107 |
| 59 | Jie Ming Mandarin Immersion Academy | 483.0 | 3.0 | 0.8065 | NaN | NaN | NaN | 0.7692 | 0.8333 | NaN | 0.8889 |
| 60 | Jie Ming Mandarin Immersion Academy | 483.0 | 4.0 | 0.9643 | NaN | NaN | NaN | 0.9167 | 1.0000 | NaN | 0.9565 |
| 61 | Jie Ming Mandarin Immersion Academy | 483.0 | 5.0 | 0.8095 | NaN | NaN | NaN | NaN | 0.7692 | NaN | 0.9286 |
| 91 | Horace Mann School | 518.0 | 3.0 | 0.7544 | 0.8372 | 0.5000 | NaN | 0.6364 | 0.8286 | NaN | 0.8200 |
| 92 | Horace Mann School | 518.0 | 4.0 | 0.7541 | 0.8500 | 0.5714 | NaN | 0.8000 | 0.6923 | 0.4615 | 0.8333 |
| 93 | Horace Mann School | 518.0 | 5.0 | 0.8077 | 0.8824 | 0.6667 | 0.5000 | 0.7778 | 0.8485 | 0.5000 | 0.9000 |
| 113 | Randolph Heights Elementary | 545.0 | 3.0 | 0.7179 | 0.8269 | 0.5000 | 0.5000 | 0.5833 | 0.8333 | 0.4815 | 0.8431 |
| 114 | Randolph Heights Elementary | 545.0 | 4.0 | 0.7391 | 0.8000 | 0.6250 | NaN | 0.6923 | 0.8000 | 0.5000 | 0.8367 |
| 115 | Randolph Heights Elementary | 545.0 | 5.0 | 0.8507 | 0.9000 | 0.7778 | NaN | 0.8710 | 0.8333 | 0.6667 | 0.9348 |
| 122 | St. Anthony Park Elementary | 557.0 | 3.0 | 0.6265 | 0.7111 | 0.5263 | NaN | 0.6341 | 0.6190 | 0.3636 | 0.7213 |
| 123 | St. Anthony Park Elementary | 557.0 | 4.0 | 0.7059 | 0.7931 | 0.5185 | NaN | 0.7619 | 0.6512 | 0.3750 | 0.7826 |
| 124 | St. Anthony Park Elementary | 557.0 | 5.0 | 0.6901 | 0.9512 | 0.3333 | 0.3077 | 0.5625 | 0.7949 | 0.3750 | 0.8511 |
Math Data

Math.query('Num in (518,557,483,545,462)')
| School | Num | Grade | Prof | White_Prof | POC_Prof | Black_Prof | Male_Prof | Female_Prof | FRPL_Prof | NonFRPL_Prof | |
|---|---|---|---|---|---|---|---|---|---|---|---|
| 38 | L'Etoile Du Nord French Immersion U | 462.0 | 3.0 | 0.6230 | 0.7857 | 0.4848 | 0.6923 | 0.6957 | 0.5789 | 0.4286 | 0.6809 |
| 39 | L'Etoile Du Nord French Immersion U | 462.0 | 4.0 | 0.6000 | 0.8571 | 0.2400 | 0.2857 | 0.5385 | 0.6471 | 0.3500 | 0.7250 |
| 40 | L'Etoile Du Nord French Immersion U | 462.0 | 5.0 | 0.7125 | 0.8250 | 0.6000 | 0.7333 | 0.7407 | 0.6981 | 0.4583 | 0.8214 |
| 59 | Jie Ming Mandarin Immersion Academy | 483.0 | 3.0 | 0.9032 | NaN | NaN | NaN | 0.8462 | 0.9444 | NaN | 0.9259 |
| 60 | Jie Ming Mandarin Immersion Academy | 483.0 | 4.0 | 1.0000 | NaN | NaN | NaN | 1.0000 | 1.0000 | NaN | 1.0000 |
| 61 | Jie Ming Mandarin Immersion Academy | 483.0 | 5.0 | 0.8571 | NaN | NaN | NaN | NaN | 0.8462 | NaN | 0.9286 |
| 91 | Horace Mann School | 518.0 | 3.0 | 0.8421 | 0.9070 | 0.6429 | NaN | 0.7727 | 0.8857 | NaN | 0.9000 |
| 92 | Horace Mann School | 518.0 | 4.0 | 0.7869 | 0.9000 | 0.5714 | NaN | 0.7429 | 0.8462 | 0.4615 | 0.8750 |
| 93 | Horace Mann School | 518.0 | 5.0 | 0.5769 | 0.6667 | 0.4074 | 0.2000 | 0.6000 | 0.5455 | 0.2222 | 0.6833 |
| 113 | Randolph Heights Elementary | 545.0 | 3.0 | 0.8333 | 0.9615 | 0.5769 | 0.4167 | 0.7500 | 0.9048 | 0.5926 | 0.9608 |
| 114 | Randolph Heights Elementary | 545.0 | 4.0 | 0.7826 | 0.8889 | 0.5833 | NaN | 0.7949 | 0.7667 | 0.3500 | 0.9592 |
| 115 | Randolph Heights Elementary | 545.0 | 5.0 | 0.6418 | 0.7250 | 0.5185 | NaN | 0.6774 | 0.6111 | 0.5238 | 0.6957 |
| 122 | St. Anthony Park Elementary | 557.0 | 3.0 | 0.6627 | 0.7778 | 0.5263 | NaN | 0.7073 | 0.6190 | 0.4091 | 0.7541 |
| 123 | St. Anthony Park Elementary | 557.0 | 4.0 | 0.7647 | 0.8448 | 0.5926 | NaN | 0.8095 | 0.7209 | 0.4375 | 0.8406 |
| 124 | St. Anthony Park Elementary | 557.0 | 5.0 | 0.5634 | 0.7805 | 0.2667 | 0.3077 | 0.5625 | 0.5641 | 0.3750 | 0.6596 |
Science Data
Science.query('Num in (518,557,483,545,462)')
| School | Num | Grade | Prof | White_Prof | POC_Prof | Black_Prof | Male_Prof | Female_Prof | FRPL_Prof | NonFRPL_Prof | |
|---|---|---|---|---|---|---|---|---|---|---|---|
| 12 | L'Etoile Du Nord French Immersion U | 462.0 | 5 | 0.5875 | 0.7250 | 0.4500 | 0.7333 | 0.5556 | 0.6038 | 0.3750 | 0.6786 |
| 19 | Jie Ming Mandarin Immersion Academy | 483.0 | 5 | 0.8571 | NaN | NaN | NaN | NaN | 0.8462 | NaN | 0.9286 |
| 29 | Horace Mann School | 518.0 | 5 | 0.6410 | 0.7255 | 0.4815 | 0.2000 | 0.7333 | 0.5152 | 0.2222 | 0.7667 |
| 37 | Randolph Heights Elementary | 545.0 | 5 | 0.6567 | 0.7500 | 0.5185 | NaN | 0.6452 | 0.6667 | 0.4286 | 0.7609 |
| 40 | St. Anthony Park Elementary | 557.0 | 5 | 0.6286 | 0.9250 | 0.2333 | 0.0769 | 0.5625 | 0.6842 | 0.2609 | 0.8085 |
Enroll.query('Num in (435,493,494,463,425)')
| Num | School | Tot_Enroll | Male% | White% | Black% | Asian% | FRP% | ELL% | SPED% | Homeless% | |
|---|---|---|---|---|---|---|---|---|---|---|---|
| 4 | 425.0 | Chelsea Heights Elementary | 445.0 | 52.36 | 45.62 | 22.47 | 12.13 | 45.17% | 19.33% | 9.44% | 1.35% |
| 8 | 435.0 | Expo For Excellence Elementary Sch | 663.0 | 54.75 | 58.37 | 23.98 | 3.92 | 33.63% | 12.97% | 11.16% | 1.06% |
| 14 | 463.0 | L'Etoile Du Nord French Immersion L | 173.0 | 36.42 | 45.66 | 19.08 | 6.36 | 42.20% | 18.50% | 4.05% | 0.00% |
| 25 | 493.0 | Jj Hill Montessori | 406.0 | 50.00 | 48.03 | 23.65 | 7.64 | 34.48% | 21.18% | 10.59% | 0.00% |
| 26 | 494.0 | Capitol Hill Magnet/Rondo | 1254.0 | 53.03 | 38.28 | 22.65 | 24.96 | 41.87% | 10.53% | 5.50% | 0.32% |
Reading Data

Reading.query('Num in (435,493,494,463,425)')
| School | Num | Grade | Prof | White_Prof | POC_Prof | Black_Prof | Male_Prof | Female_Prof | FRPL_Prof | NonFRPL_Prof | |
|---|---|---|---|---|---|---|---|---|---|---|---|
| 12 | Chelsea Heights Elementary | 425.0 | 3.0 | 0.5946 | 0.7750 | 0.3824 | 0.5000 | 0.6364 | 0.5610 | 0.4063 | 0.7381 |
| 13 | Chelsea Heights Elementary | 425.0 | 4.0 | 0.5070 | 0.7143 | 0.3721 | 0.3333 | 0.2703 | 0.7647 | 0.4500 | 0.5806 |
| 14 | Chelsea Heights Elementary | 425.0 | 5.0 | 0.5867 | 0.6765 | 0.5122 | 0.5000 | 0.5116 | 0.6875 | 0.4324 | 0.7368 |
| 24 | Expo For Excellence Elementary Sch | 435.0 | 3.0 | 0.6346 | 0.7667 | 0.4545 | 0.3846 | 0.6271 | 0.6444 | 0.3030 | 0.7887 |
| 25 | Expo For Excellence Elementary Sch | 435.0 | 4.0 | 0.5619 | 0.7647 | 0.3704 | 0.2069 | 0.5714 | 0.5510 | 0.2609 | 0.7966 |
| 26 | Expo For Excellence Elementary Sch | 435.0 | 5.0 | 0.6346 | 0.8246 | 0.4043 | 0.2400 | 0.6066 | 0.6744 | 0.2857 | 0.8116 |
| 74 | Jj Hill Montessori | 493.0 | 3.0 | 0.4906 | 0.6000 | 0.3929 | 0.2857 | 0.5200 | 0.4643 | 0.2381 | 0.6563 |
| 75 | Jj Hill Montessori | 493.0 | 4.0 | 0.5490 | 0.6923 | 0.4000 | 0.0909 | 0.5172 | 0.5909 | 0.2308 | 0.6579 |
| 76 | Jj Hill Montessori | 493.0 | 5.0 | 0.5510 | 0.7143 | 0.4286 | 0.2000 | 0.4815 | 0.6364 | 0.2727 | 0.7778 |
| 77 | Capitol Hill Magnet/Rondo | 494.0 | 3.0 | 0.7059 | 0.8621 | 0.5897 | 0.5769 | 0.6324 | 0.7794 | 0.5000 | 0.8043 |
| 78 | Capitol Hill Magnet/Rondo | 494.0 | 4.0 | 0.7324 | 0.9245 | 0.6180 | 0.6818 | 0.7391 | 0.7260 | 0.6102 | 0.8193 |
| 79 | Capitol Hill Magnet/Rondo | 494.0 | 5.0 | 0.7095 | 0.9153 | 0.5730 | 0.5000 | 0.6571 | 0.7564 | 0.5522 | 0.8395 |
| 80 | Capitol Hill Magnet/Rondo | 494.0 | 6.0 | 0.7136 | 0.8816 | 0.6204 | 0.5741 | 0.7258 | 0.6966 | 0.5392 | 0.8739 |
| 81 | Capitol Hill Magnet/Rondo | 494.0 | 7.0 | 0.6502 | 0.8358 | 0.5588 | 0.4667 | 0.6036 | 0.7065 | 0.4900 | 0.8058 |
| 82 | Capitol Hill Magnet/Rondo | 494.0 | 8.0 | 0.6832 | 0.8831 | 0.5600 | 0.4912 | 0.6667 | 0.7021 | 0.5455 | 0.7895 |
Math Data

Math.query('Num in (435,493,494,463,425)')
| School | Num | Grade | Prof | White_Prof | POC_Prof | Black_Prof | Male_Prof | Female_Prof | FRPL_Prof | NonFRPL_Prof | |
|---|---|---|---|---|---|---|---|---|---|---|---|
| 12 | Chelsea Heights Elementary | 425.0 | 3.0 | 0.5946 | 0.7500 | 0.4118 | 0.5000 | 0.6667 | 0.5366 | 0.4688 | 0.6905 |
| 13 | Chelsea Heights Elementary | 425.0 | 4.0 | 0.4930 | 0.7143 | 0.3488 | 0.3889 | 0.4595 | 0.5294 | 0.4000 | 0.6129 |
| 14 | Chelsea Heights Elementary | 425.0 | 5.0 | 0.4933 | 0.5000 | 0.4878 | 0.3750 | 0.4884 | 0.5000 | 0.3243 | 0.6579 |
| 24 | Expo For Excellence Elementary Sch | 435.0 | 3.0 | 0.6346 | 0.8000 | 0.4091 | 0.3462 | 0.7288 | 0.5111 | 0.2424 | 0.8169 |
| 25 | Expo For Excellence Elementary Sch | 435.0 | 4.0 | 0.7009 | 0.8824 | 0.5357 | 0.4667 | 0.6964 | 0.7059 | 0.5000 | 0.8644 |
| 26 | Expo For Excellence Elementary Sch | 435.0 | 5.0 | 0.4954 | 0.6230 | 0.3333 | 0.3077 | 0.4769 | 0.5227 | 0.2162 | 0.6389 |
| 74 | Jj Hill Montessori | 493.0 | 3.0 | 0.3519 | 0.4800 | 0.2414 | 0.0667 | 0.3200 | 0.3793 | 0.0455 | 0.5625 |
| 75 | Jj Hill Montessori | 493.0 | 4.0 | 0.4118 | 0.5185 | 0.2917 | 0.1000 | 0.3667 | 0.4762 | 0.1667 | 0.4872 |
| 76 | Jj Hill Montessori | 493.0 | 5.0 | 0.1837 | 0.4000 | 0.0345 | 0.0000 | 0.2222 | 0.1364 | 0.0000 | 0.3462 |
| 77 | Capitol Hill Magnet/Rondo | 494.0 | 3.0 | 0.8000 | 0.9298 | 0.7051 | 0.6538 | 0.8529 | 0.7463 | 0.6818 | 0.8571 |
| 78 | Capitol Hill Magnet/Rondo | 494.0 | 4.0 | 0.8156 | 0.9623 | 0.7273 | 0.8636 | 0.8406 | 0.7917 | 0.7119 | 0.8902 |
| 79 | Capitol Hill Magnet/Rondo | 494.0 | 5.0 | 0.5238 | 0.7458 | 0.3750 | 0.1613 | 0.5072 | 0.5385 | 0.3030 | 0.7037 |
| 80 | Capitol Hill Magnet/Rondo | 494.0 | 6.0 | 0.5399 | 0.8553 | 0.3650 | 0.2963 | 0.6452 | 0.3933 | 0.2941 | 0.7658 |
| 81 | Capitol Hill Magnet/Rondo | 494.0 | 7.0 | 0.6010 | 0.8955 | 0.4559 | 0.3500 | 0.5856 | 0.6196 | 0.4000 | 0.7961 |
| 82 | Capitol Hill Magnet/Rondo | 494.0 | 8.0 | 0.5764 | 0.7922 | 0.4444 | 0.2931 | 0.5780 | 0.5745 | 0.4270 | 0.6930 |
Science Data
Science.query('Num in (435,493,494,463,425)')
| School | Num | Grade | Prof | White_Prof | POC_Prof | Black_Prof | Male_Prof | Female_Prof | FRPL_Prof | NonFRPL_Prof | |
|---|---|---|---|---|---|---|---|---|---|---|---|
| 4 | Chelsea Heights Elementary | 425.0 | 5 | 0.5467 | 0.6471 | 0.4634 | 0.5000 | 0.5116 | 0.5938 | 0.3514 | 0.7368 |
| 8 | Expo For Excellence Elementary Sch | 435.0 | 5 | 0.5421 | 0.6885 | 0.3478 | 0.2800 | 0.5156 | 0.5814 | 0.2286 | 0.6944 |
| 24 | Jj Hill Montessori | 493.0 | 5 | 0.3261 | 0.6000 | 0.1154 | 0.0000 | 0.3077 | 0.3500 | 0.0000 | 0.5769 |
| 25 | Capitol Hill Magnet/Rondo | 494.0 | 5 | 0.6216 | 0.9153 | 0.4270 | 0.2813 | 0.6143 | 0.6282 | 0.4179 | 0.7901 |
| 26 | Capitol Hill Magnet/Rondo | 494.0 | 8 | 0.5149 | 0.8312 | 0.3200 | 0.2069 | 0.5463 | 0.4787 | 0.2841 | 0.6930 |
Enroll.query('Num in (410,476,534,533,528)')
| Num | School | Tot_Enroll | Male% | White% | Black% | Asian% | FRP% | ELL% | SPED% | Homeless% | |
|---|---|---|---|---|---|---|---|---|---|---|---|
| 0 | 410.0 | Adams Magnet Elementary | 616.0 | 49.19 | 26.46 | 15.26 | 0.32 | 48.86% | 22.08% | 6.66% | 0.81% |
| 19 | 476.0 | Groveland Park Elementary | 402.0 | 48.51 | 44.28 | 27.86 | 5.72 | 51.24% | 16.17% | 10.95% | 0.25% |
| 33 | 528.0 | Linwood Monroe Arts Plus Upper | 472.0 | 45.55 | 29.03 | 32.20 | 19.28 | 62.92% | 28.81% | 20.97% | 1.27% |
| 34 | 533.0 | Nokomis Montessori North Campus | 362.0 | 51.10 | 22.65 | 8.56 | 52.49 | 58.84% | 41.71% | 10.77% | 1.10% |
| 35 | 534.0 | Nokomis Montessori South Campus | 267.0 | 56.55 | 25.84 | 11.99 | 41.20 | 55.81% | 34.83% | 15.36% | 0.00% |
Reading Data

Reading.query('Num in (410,476,534,533,528)')
| School | Num | Grade | Prof | White_Prof | POC_Prof | Black_Prof | Male_Prof | Female_Prof | FRPL_Prof | NonFRPL_Prof | |
|---|---|---|---|---|---|---|---|---|---|---|---|
| 0 | Adams Magnet Elementary | 410.0 | 3.0 | 0.4643 | 0.7692 | 0.3276 | 0.0909 | 0.4390 | 0.4884 | 0.2051 | 0.6889 |
| 1 | Adams Magnet Elementary | 410.0 | 4.0 | 0.4405 | 0.7368 | 0.3538 | NaN | 0.4737 | 0.4130 | 0.3556 | 0.5385 |
| 2 | Adams Magnet Elementary | 410.0 | 5.0 | 0.5258 | 0.7917 | 0.4384 | 0.2667 | 0.4348 | 0.6078 | 0.2553 | 0.7800 |
| 53 | Groveland Park Elementary | 476.0 | 3.0 | 0.5273 | 0.6923 | 0.3793 | 0.1667 | 0.5714 | 0.5122 | 0.3462 | 0.6897 |
| 54 | Groveland Park Elementary | 476.0 | 4.0 | 0.4444 | 0.6111 | 0.3611 | 0.3478 | 0.3824 | 0.5500 | 0.2424 | 0.7619 |
| 55 | Groveland Park Elementary | 476.0 | 5.0 | 0.6625 | 0.7750 | 0.5500 | 0.4286 | 0.5610 | 0.7692 | 0.4444 | 0.8409 |
| 100 | Linwood Monroe Arts Plus Upper | 528.0 | 5.0 | 0.3659 | 0.6875 | 0.2879 | 0.1481 | 0.2927 | 0.4390 | 0.2712 | 0.6087 |
| 101 | Linwood Monroe Arts Plus Upper | 528.0 | 6.0 | 0.4507 | 0.7222 | 0.3585 | 0.2826 | 0.3939 | 0.5000 | 0.2903 | 0.7551 |
| 102 | Linwood Monroe Arts Plus Upper | 528.0 | 7.0 | 0.4077 | 0.7568 | 0.2688 | 0.2391 | 0.3651 | 0.4478 | 0.2414 | 0.7442 |
| 103 | Linwood Monroe Arts Plus Upper | 528.0 | 8.0 | 0.4914 | 0.7561 | 0.3467 | 0.2432 | 0.4894 | 0.4928 | 0.3000 | 0.7826 |
| 104 | Nokomis Montessori North Campus | 533.0 | 3.0 | 0.2600 | 0.4000 | 0.2000 | NaN | 0.3103 | 0.1905 | 0.2727 | 0.2353 |
| 105 | Nokomis Montessori North Campus | 533.0 | 4.0 | 0.2667 | 0.6000 | 0.1714 | NaN | 0.2632 | 0.2692 | 0.1379 | 0.5000 |
| 106 | Nokomis Montessori North Campus | 533.0 | 5.0 | 0.6667 | 0.7692 | 0.6154 | NaN | 0.6667 | 0.6667 | 0.4444 | 0.8571 |
| 107 | Nokomis Montessori South Campus | 534.0 | 3.0 | 0.2308 | 0.3000 | 0.2069 | NaN | 0.2273 | 0.2353 | 0.1500 | 0.3158 |
| 108 | Nokomis Montessori South Campus | 534.0 | 4.0 | 0.4359 | NaN | NaN | NaN | 0.3478 | 0.5625 | 0.3600 | 0.5714 |
| 109 | Nokomis Montessori South Campus | 534.0 | 5.0 | 0.4865 | NaN | NaN | NaN | 0.4500 | 0.5294 | 0.2778 | 0.6842 |
Math Data

Math.query('Num in (410,476,534,533,528)')
| School | Num | Grade | Prof | White_Prof | POC_Prof | Black_Prof | Male_Prof | Female_Prof | FRPL_Prof | NonFRPL_Prof | |
|---|---|---|---|---|---|---|---|---|---|---|---|
| 0 | Adams Magnet Elementary | 410.0 | 3.0 | 0.5357 | 0.9231 | 0.3621 | 0.0909 | 0.5610 | 0.5116 | 0.2308 | 0.8000 |
| 1 | Adams Magnet Elementary | 410.0 | 4.0 | 0.4167 | 0.6842 | 0.3385 | NaN | 0.5000 | 0.3478 | 0.3111 | 0.5385 |
| 2 | Adams Magnet Elementary | 410.0 | 5.0 | 0.2653 | 0.5000 | 0.1892 | 0.0000 | 0.2340 | 0.2941 | 0.1250 | 0.4000 |
| 53 | Groveland Park Elementary | 476.0 | 3.0 | 0.5741 | 0.7692 | 0.3929 | 0.1667 | 0.6923 | 0.5366 | 0.3200 | 0.7931 |
| 54 | Groveland Park Elementary | 476.0 | 4.0 | 0.5370 | 0.7222 | 0.4444 | 0.3913 | 0.5294 | 0.5500 | 0.3939 | 0.7619 |
| 55 | Groveland Park Elementary | 476.0 | 5.0 | 0.5125 | 0.7000 | 0.3250 | 0.2381 | 0.4634 | 0.5641 | 0.3056 | 0.6818 |
| 100 | Linwood Monroe Arts Plus Upper | 528.0 | 5.0 | 0.2289 | 0.4375 | 0.1791 | 0.1481 | 0.2381 | 0.2195 | 0.1500 | 0.4348 |
| 101 | Linwood Monroe Arts Plus Upper | 528.0 | 6.0 | 0.3688 | 0.6111 | 0.2857 | 0.1957 | 0.3636 | 0.3733 | 0.2391 | 0.6122 |
| 102 | Linwood Monroe Arts Plus Upper | 528.0 | 7.0 | 0.3252 | 0.5946 | 0.2093 | 0.2000 | 0.3443 | 0.3065 | 0.1605 | 0.6429 |
| 103 | Linwood Monroe Arts Plus Upper | 528.0 | 8.0 | 0.3217 | 0.5854 | 0.1757 | 0.1111 | 0.2979 | 0.3382 | 0.1449 | 0.5870 |
| 104 | Nokomis Montessori North Campus | 533.0 | 3.0 | 0.2653 | 0.4000 | 0.2059 | NaN | 0.3448 | 0.1500 | 0.2813 | 0.2353 |
| 105 | Nokomis Montessori North Campus | 533.0 | 4.0 | 0.3333 | 0.7000 | 0.2286 | NaN | 0.2632 | 0.3846 | 0.2069 | 0.5625 |
| 106 | Nokomis Montessori North Campus | 533.0 | 5.0 | 0.3333 | 0.4615 | 0.2692 | NaN | 0.3333 | 0.3333 | 0.1667 | 0.4762 |
| 107 | Nokomis Montessori South Campus | 534.0 | 3.0 | 0.2308 | 0.4000 | 0.1724 | NaN | 0.3182 | 0.1176 | 0.0500 | 0.4211 |
| 108 | Nokomis Montessori South Campus | 534.0 | 4.0 | 0.3590 | NaN | NaN | NaN | 0.3043 | 0.4375 | 0.3200 | 0.4286 |
| 109 | Nokomis Montessori South Campus | 534.0 | 5.0 | 0.1622 | NaN | NaN | NaN | 0.1500 | 0.1765 | 0.0000 | 0.3158 |
Science Data
Science.query('Num in (410,476,534,533,528)')
| School | Num | Grade | Prof | White_Prof | POC_Prof | Black_Prof | Male_Prof | Female_Prof | FRPL_Prof | NonFRPL_Prof | |
|---|---|---|---|---|---|---|---|---|---|---|---|
| 0 | Adams Magnet Elementary | 410.0 | 5 | 0.3402 | 0.5833 | 0.2603 | 0.2000 | 0.3043 | 0.3725 | 0.1064 | 0.5600 |
| 17 | Groveland Park Elementary | 476.0 | 5 | 0.5500 | 0.7000 | 0.4000 | 0.2857 | 0.4878 | 0.6154 | 0.3333 | 0.7273 |
| 32 | Linwood Monroe Arts Plus Upper | 528.0 | 5 | 0.1807 | 0.4375 | 0.1194 | 0.0000 | 0.1429 | 0.2195 | 0.0833 | 0.4348 |
| 33 | Linwood Monroe Arts Plus Upper | 528.0 | 8 | 0.3421 | 0.6585 | 0.1644 | 0.1143 | 0.3556 | 0.3333 | 0.1912 | 0.5652 |
| 34 | Nokomis Montessori North Campus | 533.0 | 5 | 0.3684 | 0.6154 | 0.2400 | NaN | 0.3810 | 0.3529 | 0.2222 | 0.5000 |
| 35 | Nokomis Montessori South Campus | 534.0 | 5 | 0.2973 | NaN | NaN | NaN | 0.3000 | 0.2941 | 0.2778 | 0.3158 |
Enroll.query('Num in (491,510,467,465,488)')
| Num | School | Tot_Enroll | Male% | White% | Black% | Asian% | FRP% | ELL% | SPED% | Homeless% | |
|---|---|---|---|---|---|---|---|---|---|---|---|
| 16 | 465.0 | Crossroads Montessori | 259.0 | 49.81 | 18.15 | 30.12 | 21.24 | 69.88% | 22.01% | 10.81% | 1.93% |
| 18 | 467.0 | Galtier Elementary School | 196.0 | 51.02 | 27.55 | 33.67 | 7.65 | 67.35% | 16.84% | 11.73% | 5.10% |
| 22 | 488.0 | The Heights Community School | 462.0 | 56.93 | 9.09 | 24.46 | 38.74 | 69.91% | 40.69% | 18.40% | 1.95% |
| 24 | 491.0 | Highland Park Elementary | 385.0 | 53.77 | 27.01 | 49.87 | 8.05 | 66.23% | 34.29% | 7.27% | 1.04% |
| 29 | 510.0 | Linwood Monroe Arts Plus Lower | 396.0 | 50.51 | 29.29 | 20.20 | 24.49 | 66.41% | 39.14% | 19.44% | 1.77% |
Reading Data

Reading.query('Num in (491,510,467,465,488)')
| School | Num | Grade | Prof | White_Prof | POC_Prof | Black_Prof | Male_Prof | Female_Prof | FRPL_Prof | NonFRPL_Prof | |
|---|---|---|---|---|---|---|---|---|---|---|---|
| 44 | Crossroads Montessori | 465.0 | 3.0 | 0.4194 | NaN | NaN | NaN | 0.3889 | 0.4615 | 0.2632 | 0.6667 |
| 45 | Crossroads Montessori | 465.0 | 4.0 | 0.3704 | NaN | NaN | NaN | 0.2000 | 0.4706 | 0.3333 | NaN |
| 46 | Crossroads Montessori | 465.0 | 5.0 | 0.4643 | NaN | NaN | NaN | 0.2000 | 0.7692 | 0.2857 | 0.6429 |
| 50 | Galtier Elementary School | 467.0 | 3.0 | 0.3462 | NaN | NaN | NaN | 0.2308 | 0.4615 | 0.1765 | NaN |
| 51 | Galtier Elementary School | 467.0 | 4.0 | 0.0870 | NaN | NaN | 0.0909 | 0.1429 | NaN | 0.1111 | NaN |
| 52 | Galtier Elementary School | 467.0 | 5.0 | 0.2727 | NaN | NaN | 0.4000 | NaN | 0.2308 | 0.1176 | NaN |
| 62 | The Heights Community School | 488.0 | 3.0 | 0.2097 | NaN | NaN | 0.1111 | 0.2000 | 0.2222 | 0.1333 | 0.4118 |
| 63 | The Heights Community School | 488.0 | 4.0 | 0.1395 | NaN | NaN | 0.0769 | 0.0909 | 0.1905 | 0.1000 | 0.2308 |
| 64 | The Heights Community School | 488.0 | 5.0 | 0.3857 | NaN | NaN | 0.1111 | 0.2927 | 0.5172 | 0.4043 | 0.3478 |
| 71 | Highland Park Elementary | 491.0 | 3.0 | 0.3134 | 0.7143 | 0.2075 | 0.1429 | 0.3235 | 0.3030 | 0.1556 | 0.6364 |
| 72 | Highland Park Elementary | 491.0 | 4.0 | 0.4138 | 0.6316 | 0.3077 | 0.2083 | 0.3478 | 0.4571 | 0.2059 | 0.7083 |
| 73 | Highland Park Elementary | 491.0 | 5.0 | 0.5556 | 0.9000 | 0.4231 | 0.3714 | 0.5000 | 0.6250 | 0.4000 | 0.8148 |
| 89 | Linwood Monroe Arts Plus Lower | 510.0 | 3.0 | 0.4304 | 0.6400 | 0.3333 | 0.2500 | 0.3429 | 0.5000 | 0.2642 | 0.7692 |
| 90 | Linwood Monroe Arts Plus Lower | 510.0 | 4.0 | 0.2949 | 0.6400 | 0.1321 | 0.1053 | 0.2979 | 0.2903 | 0.1071 | 0.7727 |
Math Data

Math.query('Num in (491,510,467,465,488)')
| School | Num | Grade | Prof | White_Prof | POC_Prof | Black_Prof | Male_Prof | Female_Prof | FRPL_Prof | NonFRPL_Prof | |
|---|---|---|---|---|---|---|---|---|---|---|---|
| 44 | Crossroads Montessori | 465.0 | 3.0 | 0.4333 | NaN | NaN | NaN | 0.4706 | 0.3846 | 0.2778 | 0.6667 |
| 45 | Crossroads Montessori | 465.0 | 4.0 | 0.2593 | NaN | NaN | NaN | 0.3000 | 0.2353 | 0.2857 | NaN |
| 46 | Crossroads Montessori | 465.0 | 5.0 | 0.1429 | NaN | NaN | NaN | 0.0667 | 0.2308 | 0.0714 | 0.2143 |
| 50 | Galtier Elementary School | 467.0 | 3.0 | 0.3462 | NaN | NaN | NaN | 0.3077 | 0.3846 | 0.2353 | NaN |
| 51 | Galtier Elementary School | 467.0 | 4.0 | 0.0870 | NaN | NaN | 0.0909 | 0.0714 | NaN | 0.1111 | NaN |
| 52 | Galtier Elementary School | 467.0 | 5.0 | 0.0000 | NaN | NaN | 0.0000 | NaN | 0.0000 | 0.0000 | NaN |
| 62 | The Heights Community School | 488.0 | 3.0 | 0.3492 | NaN | NaN | 0.2632 | 0.3714 | 0.3214 | 0.2609 | 0.5882 |
| 63 | The Heights Community School | 488.0 | 4.0 | 0.2069 | NaN | NaN | 0.0741 | 0.2000 | 0.2143 | 0.1311 | 0.3846 |
| 64 | The Heights Community School | 488.0 | 5.0 | 0.2000 | NaN | NaN | 0.0000 | 0.1707 | 0.2414 | 0.2128 | 0.1739 |
| 71 | Highland Park Elementary | 491.0 | 3.0 | 0.3731 | 0.7143 | 0.2830 | 0.2571 | 0.4118 | 0.3333 | 0.2222 | 0.6818 |
| 72 | Highland Park Elementary | 491.0 | 4.0 | 0.4310 | 0.7895 | 0.2564 | 0.2083 | 0.4783 | 0.4000 | 0.2059 | 0.7500 |
| 73 | Highland Park Elementary | 491.0 | 5.0 | 0.3194 | 0.7500 | 0.1538 | 0.1143 | 0.2750 | 0.3750 | 0.1111 | 0.6667 |
| 89 | Linwood Monroe Arts Plus Lower | 510.0 | 3.0 | 0.3924 | 0.5600 | 0.3148 | 0.2500 | 0.4000 | 0.3864 | 0.2264 | 0.7308 |
| 90 | Linwood Monroe Arts Plus Lower | 510.0 | 4.0 | 0.2692 | 0.6000 | 0.1132 | 0.1579 | 0.2766 | 0.2581 | 0.1071 | 0.6818 |
Science Data
Science.query('Num in (491,510,467,465,488)')
| School | Num | Grade | Prof | White_Prof | POC_Prof | Black_Prof | Male_Prof | Female_Prof | FRPL_Prof | NonFRPL_Prof | |
|---|---|---|---|---|---|---|---|---|---|---|---|
| 14 | Crossroads Montessori | 465.0 | 5 | 0.2759 | NaN | NaN | NaN | 0.2500 | 0.3077 | 0.1429 | 0.4000 |
| 16 | Galtier Elementary School | 467.0 | 5 | 0.0000 | NaN | NaN | 0.0000 | NaN | 0.0000 | 0.0000 | NaN |
| 20 | The Heights Community School | 488.0 | 5 | 0.1014 | NaN | NaN | 0.0000 | 0.0976 | 0.1071 | 0.1087 | 0.0870 |
| 23 | Highland Park Elementary | 491.0 | 5 | 0.3056 | 0.65 | 0.1731 | 0.1143 | 0.2750 | 0.3438 | 0.1111 | 0.6296 |
Enroll.query('Num in (428,458,422,482,452)')
| Num | School | Tot_Enroll | Male% | White% | Black% | Asian% | FRP% | ELL% | SPED% | Homeless% | |
|---|---|---|---|---|---|---|---|---|---|---|---|
| 2 | 422.0 | Battle Creek Elementary School | 472.0 | 54.24 | 7.20 | 28.81 | 43.01 | 73.31% | 41.31% | 18.01% | 1.27% |
| 5 | 428.0 | Cherokee Heights Elementary School | 215.0 | 51.63 | 18.60 | 21.86 | 7.44 | 71.16% | 30.23% | 20.93% | 3.72% |
| 10 | 452.0 | Eastern Heights Elementary | 334.0 | 54.19 | 10.18 | 24.55 | 41.62 | 74.55% | 46.41% | 18.26% | 2.40% |
| 11 | 458.0 | Farnsworth Aerospace Lower | 479.0 | 53.24 | 6.89 | 11.69 | 68.68 | 72.86% | 58.25% | 8.35% | 1.25% |
| 20 | 482.0 | Hamline Elementary School | 284.0 | 54.58 | 17.96 | 50.70 | 11.27 | 73.94% | 21.83% | 13.03% | 3.87% |
Reading Data

Reading.query('Num in (428,458,422,482,452)')
| School | Num | Grade | Prof | White_Prof | POC_Prof | Black_Prof | Male_Prof | Female_Prof | FRPL_Prof | NonFRPL_Prof | |
|---|---|---|---|---|---|---|---|---|---|---|---|
| 6 | Battle Creek Elementary School | 422.0 | 3.0 | 0.2769 | 0.1 | 0.3091 | 0.2692 | 0.2727 | 0.2813 | 0.2364 | 0.5000 |
| 7 | Battle Creek Elementary School | 422.0 | 4.0 | 0.2877 | NaN | NaN | 0.3000 | 0.3103 | 0.2727 | 0.2593 | 0.3684 |
| 8 | Battle Creek Elementary School | 422.0 | 5.0 | 0.5077 | NaN | NaN | 0.4211 | 0.4651 | 0.5909 | 0.4667 | 0.6000 |
| 15 | Cherokee Heights Elementary School | 428.0 | 3.0 | 0.1212 | NaN | NaN | NaN | 0.0588 | 0.1875 | 0.0769 | NaN |
| 16 | Cherokee Heights Elementary School | 428.0 | 4.0 | 0.1935 | NaN | NaN | NaN | 0.2667 | 0.1250 | 0.2000 | NaN |
| 17 | Cherokee Heights Elementary School | 428.0 | 5.0 | 0.3333 | NaN | NaN | NaN | 0.3846 | 0.2857 | 0.3478 | NaN |
| 30 | Eastern Heights Elementary | 452.0 | 3.0 | 0.2439 | NaN | NaN | 0.1538 | 0.1600 | 0.3750 | 0.2000 | 0.3636 |
| 31 | Eastern Heights Elementary | 452.0 | 4.0 | 0.2553 | NaN | NaN | NaN | 0.3200 | 0.1818 | 0.1944 | 0.4545 |
| 32 | Eastern Heights Elementary | 452.0 | 5.0 | 0.3333 | NaN | NaN | NaN | 0.3462 | 0.3200 | 0.1795 | 0.8333 |
| 33 | Farnsworth Aerospace Lower | 458.0 | 3.0 | 0.3232 | NaN | NaN | 0.5000 | 0.3710 | 0.2432 | 0.2917 | 0.4074 |
| 34 | Farnsworth Aerospace Lower | 458.0 | 4.0 | 0.3271 | NaN | NaN | 0.0000 | 0.3115 | 0.3478 | 0.2821 | 0.4483 |
| 56 | Hamline Elementary School | 482.0 | 3.0 | 0.3333 | NaN | NaN | 0.2500 | 0.3913 | 0.2727 | 0.3000 | 0.4000 |
| 57 | Hamline Elementary School | 482.0 | 4.0 | 0.1818 | NaN | NaN | 0.0870 | 0.2273 | 0.1364 | 0.1471 | 0.3000 |
| 58 | Hamline Elementary School | 482.0 | 5.0 | 0.4773 | NaN | NaN | 0.3200 | 0.4167 | 0.5500 | 0.3667 | 0.7143 |
Math Data

Math.query('Num in (428,458,422,482,452)')
Science Data
Science.query('Num in (428,458,422,482,452)')
| School | Num | Grade | Prof | White_Prof | POC_Prof | Black_Prof | Male_Prof | Female_Prof | FRPL_Prof | NonFRPL_Prof | |
|---|---|---|---|---|---|---|---|---|---|---|---|
| 2 | Battle Creek Elementary School | 422.0 | 5 | 0.4154 | NaN | NaN | 0.3158 | 0.3721 | 0.5000 | 0.4000 | 0.4500 |
| 5 | Cherokee Heights Elementary School | 428.0 | 5 | 0.1481 | NaN | NaN | NaN | 0.2308 | 0.0714 | 0.1739 | NaN |
| 10 | Eastern Heights Elementary | 452.0 | 5 | 0.2000 | NaN | NaN | NaN | 0.2692 | 0.1250 | 0.1316 | 0.4167 |
| 18 | Hamline Elementary School | 482.0 | 5 | 0.2045 | NaN | NaN | 0.1200 | 0.2500 | 0.1500 | 0.1333 | 0.3571 |
Enroll.query('Num in (466,464,551,431,460)')
| Num | School | Tot_Enroll | Male% | White% | Black% | Asian% | FRP% | ELL% | SPED% | Homeless% | |
|---|---|---|---|---|---|---|---|---|---|---|---|
| 6 | 431.0 | Como Park Elementary | 451.0 | 53.66 | 11.75 | 25.50 | 44.35 | 77.83% | 44.79% | 22.84% | 1.33% |
| 12 | 460.0 | Four Seasons Elementary | 462.0 | 47.19 | 12.77 | 45.67 | 16.02 | 80.09% | 34.85% | 16.88% | 3.46% |
| 15 | 464.0 | Frost Lake Elementary School | 535.0 | 51.59 | 5.98 | 22.06 | 52.52 | 76.64% | 53.08% | 14.77% | 0.93% |
| 17 | 466.0 | Crossroads Science Program | 290.0 | 51.72 | 9.66 | 44.83 | 26.90 | 76.21% | 29.66% | 15.17% | 1.03% |
| 38 | 551.0 | Riverview West School Of Excellence | 391.0 | 51.41 | 7.67 | 20.20 | 3.58 | 76.73% | 50.38% | 12.02% | 1.28% |
Reading Data

Reading.query('Num in (466,464,551,431,460)')
| School | Num | Grade | Prof | White_Prof | POC_Prof | Black_Prof | Male_Prof | Female_Prof | FRPL_Prof | NonFRPL_Prof | |
|---|---|---|---|---|---|---|---|---|---|---|---|
| 18 | Como Park Elementary | 431.0 | 3.0 | 0.2154 | NaN | NaN | 0.1500 | 0.1471 | 0.2903 | 0.2000 | 0.3000 |
| 19 | Como Park Elementary | 431.0 | 4.0 | 0.4667 | NaN | NaN | 0.4615 | 0.4091 | 0.5484 | 0.4098 | 0.7143 |
| 20 | Como Park Elementary | 431.0 | 5.0 | 0.4861 | 0.6667 | 0.4386 | 0.4286 | 0.4412 | 0.5263 | 0.4182 | 0.7059 |
| 35 | Four Seasons Elementary | 460.0 | 3.0 | 0.1250 | NaN | NaN | 0.1034 | 0.0789 | 0.1765 | 0.1017 | 0.2308 |
| 36 | Four Seasons Elementary | 460.0 | 4.0 | 0.1538 | 0.2500 | 0.1290 | 0.2143 | 0.1190 | 0.1944 | 0.1500 | 0.1667 |
| 37 | Four Seasons Elementary | 460.0 | 5.0 | 0.1733 | NaN | NaN | 0.1622 | 0.1290 | 0.2045 | 0.1475 | 0.2857 |
| 41 | Frost Lake Elementary School | 464.0 | 3.0 | 0.2000 | NaN | NaN | 0.2273 | 0.1892 | 0.2093 | 0.1875 | 0.2500 |
| 42 | Frost Lake Elementary School | 464.0 | 4.0 | 0.2250 | NaN | NaN | 0.0769 | 0.1628 | 0.2973 | 0.2000 | 0.4000 |
| 43 | Frost Lake Elementary School | 464.0 | 5.0 | 0.3291 | NaN | NaN | 0.2800 | 0.2564 | 0.4000 | 0.3485 | 0.2308 |
| 47 | Crossroads Science Program | 466.0 | 3.0 | 0.3864 | NaN | NaN | 0.2917 | 0.3125 | 0.4286 | 0.3548 | 0.4615 |
| 48 | Crossroads Science Program | 466.0 | 4.0 | 0.3137 | NaN | NaN | 0.3684 | 0.3226 | 0.3000 | 0.2500 | 0.4667 |
| 49 | Crossroads Science Program | 466.0 | 5.0 | 0.3529 | NaN | NaN | 0.1154 | 0.3333 | 0.3750 | 0.2791 | NaN |
| 116 | Riverview West School Of Excellence | 551.0 | 3.0 | 0.1525 | NaN | NaN | 0.2000 | 0.1563 | 0.1481 | 0.1489 | 0.1667 |
| 117 | Riverview West School Of Excellence | 551.0 | 4.0 | 0.2373 | NaN | NaN | 0.5000 | 0.3000 | 0.1724 | 0.2326 | 0.2500 |
| 118 | Riverview West School Of Excellence | 551.0 | 5.0 | 0.1765 | NaN | NaN | 0.1538 | 0.1905 | 0.1667 | 0.1622 | 0.2143 |
Math Data

Math.query('Num in (466,464,551,431,460)')
| School | Num | Grade | Prof | White_Prof | POC_Prof | Black_Prof | Male_Prof | Female_Prof | FRPL_Prof | NonFRPL_Prof | |
|---|---|---|---|---|---|---|---|---|---|---|---|
| 18 | Como Park Elementary | 431.0 | 3.0 | 0.2769 | NaN | NaN | 0.2000 | 0.3529 | 0.1935 | 0.2364 | 0.5000 |
| 19 | Como Park Elementary | 431.0 | 4.0 | 0.5067 | NaN | NaN | 0.3077 | 0.4545 | 0.5806 | 0.4426 | 0.7857 |
| 20 | Como Park Elementary | 431.0 | 5.0 | 0.4366 | 0.7857 | 0.3509 | 0.2308 | 0.3529 | 0.5135 | 0.3704 | 0.6471 |
| 35 | Four Seasons Elementary | 460.0 | 3.0 | 0.1528 | NaN | NaN | 0.1379 | 0.1842 | 0.1176 | 0.1186 | 0.3077 |
| 36 | Four Seasons Elementary | 460.0 | 4.0 | 0.1667 | 0.3125 | 0.1290 | 0.1786 | 0.0714 | 0.2778 | 0.1667 | 0.1667 |
| 37 | Four Seasons Elementary | 460.0 | 5.0 | 0.1333 | NaN | NaN | 0.0811 | 0.1613 | 0.1136 | 0.1148 | 0.2143 |
| 41 | Frost Lake Elementary School | 464.0 | 3.0 | 0.2250 | NaN | NaN | 0.3182 | 0.2432 | 0.2093 | 0.1875 | 0.3750 |
| 42 | Frost Lake Elementary School | 464.0 | 4.0 | 0.2625 | NaN | NaN | 0.0000 | 0.2791 | 0.2432 | 0.2286 | 0.5000 |
| 43 | Frost Lake Elementary School | 464.0 | 5.0 | 0.2179 | NaN | NaN | 0.2000 | 0.2368 | 0.2000 | 0.2154 | 0.2308 |
| 47 | Crossroads Science Program | 466.0 | 3.0 | 0.3810 | NaN | NaN | 0.2609 | 0.5333 | 0.2963 | 0.3667 | 0.4167 |
| 48 | Crossroads Science Program | 466.0 | 4.0 | 0.5882 | NaN | NaN | 0.6316 | 0.6774 | 0.4500 | 0.5556 | 0.6667 |
| 49 | Crossroads Science Program | 466.0 | 5.0 | 0.2549 | NaN | NaN | 0.2000 | 0.2500 | 0.2609 | 0.2045 | NaN |
| 116 | Riverview West School Of Excellence | 551.0 | 3.0 | 0.1250 | NaN | NaN | 0.0714 | 0.1333 | 0.1154 | 0.1304 | 0.1000 |
| 117 | Riverview West School Of Excellence | 551.0 | 4.0 | 0.1552 | NaN | NaN | 0.2000 | 0.1333 | 0.1786 | 0.1429 | 0.1875 |
| 118 | Riverview West School Of Excellence | 551.0 | 5.0 | 0.0612 | NaN | NaN | 0.0833 | 0.1500 | 0.0000 | 0.0857 | 0.0000 |
Science Data
Science.query('Num in (466,464,551,431,460)')
| School | Num | Grade | Prof | White_Prof | POC_Prof | Black_Prof | Male_Prof | Female_Prof | FRPL_Prof | NonFRPL_Prof | |
|---|---|---|---|---|---|---|---|---|---|---|---|
| 6 | Como Park Elementary | 431.0 | 5 | 0.2394 | 0.5 | 0.1754 | 0.3077 | 0.2059 | 0.2703 | 0.2037 | 0.3529 |
| 11 | Four Seasons Elementary | 460.0 | 5 | 0.1067 | NaN | NaN | 0.0811 | 0.0645 | 0.1364 | 0.0656 | 0.2857 |
| 13 | Frost Lake Elementary School | 464.0 | 5 | 0.1646 | NaN | NaN | 0.0833 | 0.1795 | 0.1500 | 0.1667 | 0.1538 |
| 15 | Crossroads Science Program | 466.0 | 5 | 0.2041 | NaN | NaN | 0.0800 | 0.2143 | 0.1905 | 0.1429 | NaN |
| 38 | Riverview West School Of Excellence | 551.0 | 5 | 0.0800 | NaN | NaN | 0.0769 | 0.0952 | 0.0690 | 0.0833 | 0.0714 |
Enroll.query('Num in (500,541,424,524,433)')
| Num | School | Tot_Enroll | Male% | White% | Black% | Asian% | FRP% | ELL% | SPED% | Homeless% | |
|---|---|---|---|---|---|---|---|---|---|---|---|
| 3 | 424.0 | Benjamin E Mays Magnet | 406.0 | 57.64 | 3.69 | 66.75 | 14.29 | 80.54% | 24.63% | 20.94% | 3.94% |
| 7 | 433.0 | Daytons Bluff Elementary | 328.0 | 53.05 | 10.06 | 38.72 | 26.22 | 81.71% | 28.66% | 17.07% | 6.40% |
| 28 | 500.0 | Jackson Preparatory Elementary | 311.0 | 54.34 | 1.93 | 26.05 | 61.74 | 80.39% | 59.49% | 10.29% | 0.64% |
| 31 | 524.0 | Maxfield Elementary School | 282.0 | 48.94 | 5.32 | 62.77 | 6.74 | 81.21% | 9.57% | 15.60% | 13.12% |
| 36 | 541.0 | Phalen Lake Hmong Studies Magnet | 651.0 | 52.23 | 0.92 | 3.84 | 87.86 | 80.49% | 70.05% | 6.91% | 0.15% |
Reading Data

Reading.query('Num in (500,541,424,524,433)')
| School | Num | Grade | Prof | White_Prof | POC_Prof | Black_Prof | Male_Prof | Female_Prof | FRPL_Prof | NonFRPL_Prof | |
|---|---|---|---|---|---|---|---|---|---|---|---|
| 9 | Benjamin E Mays Magnet | 424.0 | 3.0 | 0.1695 | NaN | NaN | 0.1818 | 0.1724 | 0.1667 | 0.1600 | NaN |
| 10 | Benjamin E Mays Magnet | 424.0 | 4.0 | 0.1250 | NaN | NaN | 0.0732 | 0.0714 | 0.1786 | 0.1489 | NaN |
| 11 | Benjamin E Mays Magnet | 424.0 | 5.0 | 0.2879 | NaN | NaN | 0.2667 | 0.2791 | 0.3043 | 0.2593 | 0.4167 |
| 21 | Daytons Bluff Elementary | 433.0 | 3.0 | 0.1800 | NaN | NaN | 0.1579 | 0.2333 | 0.1000 | 0.2195 | NaN |
| 22 | Daytons Bluff Elementary | 433.0 | 4.0 | 0.1628 | NaN | NaN | 0.1111 | 0.1304 | 0.2000 | 0.1471 | NaN |
| 23 | Daytons Bluff Elementary | 433.0 | 5.0 | 0.2041 | NaN | NaN | 0.1154 | 0.1667 | 0.2632 | 0.1860 | NaN |
| 86 | Jackson Preparatory Elementary | 500.0 | 3.0 | 0.1905 | NaN | NaN | NaN | 0.2273 | 0.1500 | 0.1667 | NaN |
| 87 | Jackson Preparatory Elementary | 500.0 | 4.0 | 0.1091 | NaN | NaN | 0.1765 | 0.1154 | 0.1034 | 0.0851 | NaN |
| 88 | Jackson Preparatory Elementary | 500.0 | 5.0 | 0.3725 | NaN | NaN | 0.2500 | 0.3077 | 0.4400 | 0.3111 | NaN |
| 94 | Maxfield Elementary School | 524.0 | 3.0 | 0.0455 | NaN | NaN | 0.0385 | 0.0556 | 0.0385 | 0.0278 | NaN |
| 95 | Maxfield Elementary School | 524.0 | 4.0 | 0.2368 | NaN | NaN | 0.2222 | 0.2400 | 0.2308 | 0.2424 | NaN |
| 96 | Maxfield Elementary School | 524.0 | 5.0 | 0.2381 | NaN | NaN | 0.2188 | 0.2000 | 0.2593 | 0.2424 | NaN |
| 110 | Phalen Lake Hmong Studies Magnet | 541.0 | 3.0 | 0.2857 | NaN | NaN | NaN | 0.2353 | 0.3404 | 0.2727 | 0.3333 |
| 111 | Phalen Lake Hmong Studies Magnet | 541.0 | 4.0 | 0.2826 | NaN | NaN | NaN | 0.2453 | 0.3333 | 0.2692 | 0.3571 |
| 112 | Phalen Lake Hmong Studies Magnet | 541.0 | 5.0 | 0.4124 | NaN | NaN | NaN | 0.3409 | 0.4717 | 0.4024 | 0.4667 |
Math Data

Math.query('Num in (500,541,424,524,433)')
| School | Num | Grade | Prof | White_Prof | POC_Prof | Black_Prof | Male_Prof | Female_Prof | FRPL_Prof | NonFRPL_Prof | |
|---|---|---|---|---|---|---|---|---|---|---|---|
| 9 | Benjamin E Mays Magnet | 424.0 | 3.0 | 0.2586 | NaN | NaN | 0.2222 | 0.2000 | 0.3214 | 0.2245 | NaN |
| 10 | Benjamin E Mays Magnet | 424.0 | 4.0 | 0.1852 | NaN | NaN | 0.1538 | 0.1111 | 0.2593 | 0.1778 | NaN |
| 11 | Benjamin E Mays Magnet | 424.0 | 5.0 | 0.0635 | NaN | NaN | 0.0238 | 0.0714 | 0.0476 | 0.0588 | 0.0833 |
| 21 | Daytons Bluff Elementary | 433.0 | 3.0 | 0.2041 | NaN | NaN | 0.1579 | 0.2759 | 0.1000 | 0.2000 | NaN |
| 22 | Daytons Bluff Elementary | 433.0 | 4.0 | 0.2093 | NaN | NaN | 0.1111 | 0.1739 | 0.2500 | 0.2059 | NaN |
| 23 | Daytons Bluff Elementary | 433.0 | 5.0 | 0.1250 | NaN | NaN | 0.0385 | 0.1379 | 0.1053 | 0.1190 | NaN |
| 86 | Jackson Preparatory Elementary | 500.0 | 3.0 | 0.2683 | NaN | NaN | NaN | 0.3810 | 0.1500 | 0.2286 | NaN |
| 87 | Jackson Preparatory Elementary | 500.0 | 4.0 | 0.1273 | NaN | NaN | 0.1176 | 0.2692 | 0.0000 | 0.0851 | NaN |
| 88 | Jackson Preparatory Elementary | 500.0 | 5.0 | 0.1569 | NaN | NaN | 0.0000 | 0.1923 | 0.1200 | 0.1111 | NaN |
| 94 | Maxfield Elementary School | 524.0 | 3.0 | 0.1818 | NaN | NaN | 0.0769 | 0.2778 | 0.1154 | 0.1944 | NaN |
| 95 | Maxfield Elementary School | 524.0 | 4.0 | 0.1579 | NaN | NaN | 0.1481 | 0.2000 | 0.0769 | 0.1515 | NaN |
| 96 | Maxfield Elementary School | 524.0 | 5.0 | 0.0952 | NaN | NaN | 0.0625 | 0.0667 | 0.1111 | 0.0909 | NaN |
| 110 | Phalen Lake Hmong Studies Magnet | 541.0 | 3.0 | 0.4286 | NaN | NaN | NaN | 0.4118 | 0.4468 | 0.4286 | 0.4286 |
| 111 | Phalen Lake Hmong Studies Magnet | 541.0 | 4.0 | 0.3696 | NaN | NaN | NaN | 0.4151 | 0.3077 | 0.3846 | 0.2857 |
| 112 | Phalen Lake Hmong Studies Magnet | 541.0 | 5.0 | 0.3367 | NaN | NaN | NaN | 0.3864 | 0.2963 | 0.3012 | 0.5333 |
Science Data
Science.query('Num in (500,541,424,524,433)')
| School | Num | Grade | Prof | White_Prof | POC_Prof | Black_Prof | Male_Prof | Female_Prof | FRPL_Prof | NonFRPL_Prof | |
|---|---|---|---|---|---|---|---|---|---|---|---|
| 3 | Benjamin E Mays Magnet | 424.0 | 5 | 0.0923 | NaN | NaN | 0.0682 | 0.1163 | 0.0455 | 0.0566 | 0.2500 |
| 7 | Daytons Bluff Elementary | 433.0 | 5 | 0.1064 | NaN | NaN | 0.0400 | 0.1071 | 0.1053 | 0.1220 | NaN |
| 28 | Jackson Preparatory Elementary | 500.0 | 5 | 0.2157 | NaN | NaN | 0.1250 | 0.2308 | 0.2000 | 0.1333 | NaN |
| 30 | Maxfield Elementary School | 524.0 | 5 | 0.0750 | NaN | NaN | 0.0000 | 0.0000 | 0.1200 | 0.0968 | NaN |
| 36 | Phalen Lake Hmong Studies Magnet | 541.0 | 5 | 0.1753 | NaN | NaN | NaN | 0.1818 | 0.1698 | 0.1829 | 0.1333 |
Enroll.query('Num in (579,552,496,578,527)')
| Num | School | Tot_Enroll | Male% | White% | Black% | Asian% | FRP% | ELL% | SPED% | Homeless% | |
|---|---|---|---|---|---|---|---|---|---|---|---|
| 27 | 496.0 | Highwood Hills Elementary | 283.0 | 49.82 | 3.53 | 62.90 | 21.55 | 82.69% | 57.24% | 8.13% | 1.77% |
| 32 | 527.0 | Mississippi Creative Arts Elementary | 619.0 | 50.89 | 7.59 | 21.32 | 53.96 | 85.95% | 54.93% | 13.41% | 2.58% |
| 39 | 552.0 | Paul & Sheila Wellstone Elementary | 537.0 | 51.96 | 5.03 | 21.97 | 16.95 | 81.94% | 59.03% | 17.13% | 1.86% |
| 42 | 578.0 | Obama Service Learning Elementary | 367.0 | 54.50 | 6.27 | 69.21 | 8.17 | 84.20% | 14.17% | 15.80% | 7.08% |
| 43 | 579.0 | American Indian Magnet School | 642.0 | 51.56 | 5.14 | 17.29 | 26.79 | 81.93% | 28.50% | 18.85% | 3.74% |
Reading Data

Reading.query('Num in (579,552,496,578,527)')
| School | Num | Grade | Prof | White_Prof | POC_Prof | Black_Prof | Male_Prof | Female_Prof | FRPL_Prof | NonFRPL_Prof | |
|---|---|---|---|---|---|---|---|---|---|---|---|
| 83 | Highwood Hills Elementary | 496.0 | 3.0 | 0.0541 | NaN | NaN | 0.0588 | 0.0952 | 0.0000 | 0.0667 | NaN |
| 84 | Highwood Hills Elementary | 496.0 | 4.0 | 0.1750 | NaN | NaN | 0.2083 | 0.0455 | 0.3333 | 0.1429 | NaN |
| 85 | Highwood Hills Elementary | 496.0 | 5.0 | 0.4167 | NaN | NaN | 0.4737 | 0.3125 | 0.5000 | 0.4118 | NaN |
| 97 | Mississippi Creative Arts Elementary | 527.0 | 3.0 | 0.1720 | NaN | NaN | 0.1000 | 0.2000 | 0.1395 | 0.1728 | 0.1667 |
| 98 | Mississippi Creative Arts Elementary | 527.0 | 4.0 | 0.1683 | NaN | NaN | 0.1739 | 0.1860 | 0.1552 | 0.1648 | 0.2000 |
| 99 | Mississippi Creative Arts Elementary | 527.0 | 5.0 | 0.4430 | NaN | NaN | 0.4762 | 0.4286 | 0.4545 | 0.4412 | 0.4545 |
| 119 | Paul & Sheila Wellstone Elementary | 552.0 | 3.0 | 0.2048 | NaN | NaN | 0.1000 | 0.1500 | 0.2558 | 0.1159 | 0.6429 |
| 120 | Paul & Sheila Wellstone Elementary | 552.0 | 4.0 | 0.2118 | NaN | NaN | 0.1500 | 0.2051 | 0.2174 | 0.1867 | 0.4000 |
| 121 | Paul & Sheila Wellstone Elementary | 552.0 | 5.0 | 0.3548 | NaN | NaN | 0.3333 | 0.4630 | 0.2051 | 0.3117 | 0.5625 |
| 128 | Obama Service Learning Elementary | 578.0 | 3.0 | 0.1818 | NaN | NaN | 0.1667 | 0.2353 | 0.1250 | 0.1786 | NaN |
| 129 | Obama Service Learning Elementary | 578.0 | 4.0 | 0.1481 | NaN | NaN | 0.1220 | 0.1481 | 0.1481 | 0.1556 | NaN |
| 130 | Obama Service Learning Elementary | 578.0 | 5.0 | 0.1739 | NaN | NaN | 0.1875 | 0.2174 | 0.1304 | 0.1818 | NaN |
| 131 | American Indian Magnet School | 579.0 | 3.0 | 0.0290 | NaN | NaN | NaN | 0.0244 | 0.0357 | 0.0185 | 0.0667 |
| 132 | American Indian Magnet School | 579.0 | 4.0 | 0.0606 | NaN | NaN | 0.0000 | 0.0000 | 0.1379 | 0.0741 | 0.0000 |
| 133 | American Indian Magnet School | 579.0 | 5.0 | 0.1791 | NaN | NaN | 0.0000 | 0.1250 | 0.2286 | 0.1613 | NaN |
| 134 | American Indian Magnet School | 579.0 | 6.0 | 0.2286 | NaN | NaN | 0.0000 | 0.2162 | 0.2424 | 0.2143 | 0.2857 |
| 135 | American Indian Magnet School | 579.0 | 7.0 | 0.1857 | NaN | NaN | 0.1667 | 0.2432 | 0.1212 | 0.1818 | 0.2000 |
| 136 | American Indian Magnet School | 579.0 | 8.0 | 0.3000 | NaN | NaN | NaN | 0.2857 | 0.3182 | 0.3256 | NaN |
Math Data

Math.query('Num in (579,552,496,578,527)')
| School | Num | Grade | Prof | White_Prof | POC_Prof | Black_Prof | Male_Prof | Female_Prof | FRPL_Prof | NonFRPL_Prof | |
|---|---|---|---|---|---|---|---|---|---|---|---|
| 83 | Highwood Hills Elementary | 496.0 | 3.0 | 0.1081 | NaN | NaN | 0.0588 | 0.1429 | 0.0625 | 0.1000 | NaN |
| 84 | Highwood Hills Elementary | 496.0 | 4.0 | 0.3659 | NaN | NaN | 0.4167 | 0.3636 | 0.3684 | 0.3333 | NaN |
| 85 | Highwood Hills Elementary | 496.0 | 5.0 | 0.1389 | NaN | NaN | 0.1053 | 0.1875 | 0.1000 | 0.1176 | NaN |
| 97 | Mississippi Creative Arts Elementary | 527.0 | 3.0 | 0.2283 | NaN | NaN | 0.1579 | 0.3061 | 0.1395 | 0.2099 | 0.3636 |
| 98 | Mississippi Creative Arts Elementary | 527.0 | 4.0 | 0.2157 | NaN | NaN | 0.1304 | 0.2273 | 0.2069 | 0.2308 | 0.0909 |
| 99 | Mississippi Creative Arts Elementary | 527.0 | 5.0 | 0.3038 | NaN | NaN | 0.2381 | 0.3429 | 0.2727 | 0.2794 | 0.4545 |
| 119 | Paul & Sheila Wellstone Elementary | 552.0 | 3.0 | 0.2169 | NaN | NaN | 0.1000 | 0.2250 | 0.2093 | 0.1449 | 0.5714 |
| 120 | Paul & Sheila Wellstone Elementary | 552.0 | 4.0 | 0.1905 | NaN | NaN | 0.1053 | 0.2821 | 0.1111 | 0.1757 | 0.3000 |
| 121 | Paul & Sheila Wellstone Elementary | 552.0 | 5.0 | 0.1789 | NaN | NaN | 0.0714 | 0.2545 | 0.0750 | 0.1519 | 0.3125 |
| 128 | Obama Service Learning Elementary | 578.0 | 3.0 | 0.2581 | NaN | NaN | 0.1667 | 0.2500 | 0.2667 | 0.2692 | NaN |
| 129 | Obama Service Learning Elementary | 578.0 | 4.0 | 0.1481 | NaN | NaN | 0.1220 | 0.1481 | 0.1481 | 0.1556 | NaN |
| 130 | Obama Service Learning Elementary | 578.0 | 5.0 | 0.0652 | NaN | NaN | 0.0313 | 0.0870 | 0.0435 | 0.0682 | NaN |
| 131 | American Indian Magnet School | 579.0 | 3.0 | 0.1159 | NaN | NaN | NaN | 0.1951 | 0.0000 | 0.0926 | 0.2000 |
| 132 | American Indian Magnet School | 579.0 | 4.0 | 0.0758 | NaN | NaN | 0.0000 | 0.1081 | 0.0345 | 0.0926 | 0.0000 |
| 133 | American Indian Magnet School | 579.0 | 5.0 | 0.0746 | NaN | NaN | 0.0000 | 0.1250 | 0.0286 | 0.0806 | NaN |
| 134 | American Indian Magnet School | 579.0 | 6.0 | 0.1000 | NaN | NaN | 0.0000 | 0.1622 | 0.0303 | 0.0714 | 0.2143 |
| 135 | American Indian Magnet School | 579.0 | 7.0 | 0.0429 | NaN | NaN | 0.0000 | 0.0811 | 0.0000 | 0.0364 | 0.0667 |
| 136 | American Indian Magnet School | 579.0 | 8.0 | 0.1200 | NaN | NaN | NaN | 0.1071 | 0.1364 | 0.1395 | NaN |
Science Data
Science.query('Num in (579,552,496,578,527)')
| School | Num | Grade | Prof | White_Prof | POC_Prof | Black_Prof | Male_Prof | Female_Prof | FRPL_Prof | NonFRPL_Prof | |
|---|---|---|---|---|---|---|---|---|---|---|---|
| 27 | Highwood Hills Elementary | 496.0 | 5 | 0.1111 | NaN | NaN | 0.0526 | 0.0625 | 0.1500 | 0.1176 | NaN |
| 31 | Mississippi Creative Arts Elementary | 527.0 | 5 | 0.1899 | NaN | NaN | 0.1429 | 0.2286 | 0.1591 | 0.1618 | 0.3636 |
| 39 | Paul & Sheila Wellstone Elementary | 552.0 | 5 | 0.1809 | NaN | NaN | 0.1538 | 0.2545 | 0.0769 | 0.1410 | 0.3750 |
| 42 | Obama Service Learning Elementary | 578.0 | 5 | 0.0435 | NaN | NaN | 0.0313 | 0.0435 | 0.0435 | 0.0455 | NaN |
| 43 | American Indian Magnet School | 579.0 | 5 | 0.0441 | NaN | NaN | 0.0000 | 0.0606 | 0.0286 | 0.0476 | NaN |
| 44 | American Indian Magnet School | 579.0 | 8 | 0.1569 | NaN | NaN | 0.0000 | 0.1429 | 0.1739 | 0.1818 | NaN |
Enroll.query('Num in (415,558,449,489)')
| Num | School | Tot_Enroll | Male% | White% | Black% | Asian% | FRP% | ELL% | SPED% | Homeless% | |
|---|---|---|---|---|---|---|---|---|---|---|---|
| 1 | 415.0 | John A. Johnson Achievement Plus El. | 375.0 | 46.93 | 7.73 | 42.40 | 27.20 | 86.13% | 31.73% | 13.87% | 6.93% |
| 9 | 449.0 | Bruce F Vento Elementary | 514.0 | 49.81 | 3.31 | 25.49 | 57.39 | 89.30% | 54.86% | 11.48% | 3.70% |
| 23 | 489.0 | Hazel Park Preparatory Academy | 588.0 | 51.87 | 5.27 | 42.86 | 31.12 | 87.41% | 24.49% | 13.61% | 4.42% |
| 41 | 558.0 | Saint Paul Music Academy | 637.0 | 48.19 | 3.45 | 21.19 | 57.30 | 88.38% | 58.24% | 13.50% | 1.26% |
Reading Data

Reading.query('Num in (415,558,449,489)')
| School | Num | Grade | Prof | White_Prof | POC_Prof | Black_Prof | Male_Prof | Female_Prof | FRPL_Prof | NonFRPL_Prof | |
|---|---|---|---|---|---|---|---|---|---|---|---|
| 3 | John A. Johnson Achievement Plus El. | 415.0 | 3.0 | 0.2000 | NaN | NaN | 0.1667 | 0.3000 | 0.1429 | 0.2174 | NaN |
| 4 | John A. Johnson Achievement Plus El. | 415.0 | 4.0 | 0.0816 | NaN | NaN | 0.1000 | 0.1071 | 0.0476 | 0.0638 | NaN |
| 5 | John A. Johnson Achievement Plus El. | 415.0 | 5.0 | 0.3077 | NaN | NaN | 0.2941 | 0.2692 | 0.3462 | 0.3043 | NaN |
| 27 | Bruce F Vento Elementary | 449.0 | 3.0 | 0.1216 | NaN | NaN | 0.1250 | 0.1143 | 0.1282 | 0.1029 | NaN |
| 28 | Bruce F Vento Elementary | 449.0 | 4.0 | 0.1831 | NaN | NaN | 0.1000 | 0.2308 | 0.1250 | 0.1774 | NaN |
| 29 | Bruce F Vento Elementary | 449.0 | 5.0 | 0.3494 | NaN | NaN | 0.3846 | 0.3125 | 0.4000 | 0.3462 | NaN |
| 65 | Hazel Park Preparatory Academy | 489.0 | 3.0 | 0.3261 | NaN | NaN | 0.2917 | 0.1905 | 0.4400 | 0.2927 | NaN |
| 66 | Hazel Park Preparatory Academy | 489.0 | 4.0 | 0.1509 | NaN | NaN | 0.0000 | 0.1613 | 0.1364 | 0.1458 | NaN |
| 67 | Hazel Park Preparatory Academy | 489.0 | 5.0 | 0.1887 | NaN | NaN | 0.1538 | 0.2222 | 0.1538 | 0.1961 | NaN |
| 68 | Hazel Park Preparatory Academy | 489.0 | 6.0 | 0.1553 | NaN | NaN | 0.1481 | 0.0909 | 0.2292 | 0.1413 | 0.2727 |
| 69 | Hazel Park Preparatory Academy | 489.0 | 7.0 | 0.2062 | NaN | NaN | 0.0714 | 0.2143 | 0.1951 | 0.1905 | 0.3077 |
| 70 | Hazel Park Preparatory Academy | 489.0 | 8.0 | 0.3023 | NaN | NaN | 0.1290 | 0.2750 | 0.3261 | 0.2703 | 0.5000 |
| 125 | Saint Paul Music Academy | 558.0 | 3.0 | 0.3441 | NaN | NaN | 0.4091 | 0.3478 | 0.3404 | 0.3012 | 0.7000 |
| 126 | Saint Paul Music Academy | 558.0 | 4.0 | 0.2381 | NaN | NaN | 0.1500 | 0.2400 | 0.2364 | 0.2174 | 0.3846 |
| 127 | Saint Paul Music Academy | 558.0 | 5.0 | 0.3727 | NaN | NaN | 0.3077 | 0.3556 | 0.3846 | 0.3627 | NaN |
Math Data

Math.query('Num in (415,558,449,489)')
| School | Num | Grade | Prof | White_Prof | POC_Prof | Black_Prof | Male_Prof | Female_Prof | FRPL_Prof | NonFRPL_Prof | |
|---|---|---|---|---|---|---|---|---|---|---|---|
| 3 | John A. Johnson Achievement Plus El. | 415.0 | 3.0 | 0.1636 | NaN | NaN | 0.1000 | 0.3500 | 0.0571 | 0.1739 | NaN |
| 4 | John A. Johnson Achievement Plus El. | 415.0 | 4.0 | 0.1200 | NaN | NaN | 0.0500 | 0.1379 | 0.0952 | 0.1250 | NaN |
| 5 | John A. Johnson Achievement Plus El. | 415.0 | 5.0 | 0.1321 | NaN | NaN | 0.1667 | 0.0769 | 0.1852 | 0.1489 | NaN |
| 27 | Bruce F Vento Elementary | 449.0 | 3.0 | 0.2466 | NaN | NaN | 0.2500 | 0.2857 | 0.2105 | 0.2537 | NaN |
| 28 | Bruce F Vento Elementary | 449.0 | 4.0 | 0.2464 | NaN | NaN | 0.1111 | 0.2703 | 0.2188 | 0.2333 | NaN |
| 29 | Bruce F Vento Elementary | 449.0 | 5.0 | 0.2771 | NaN | NaN | 0.2308 | 0.2708 | 0.2857 | 0.2692 | NaN |
| 65 | Hazel Park Preparatory Academy | 489.0 | 3.0 | 0.3333 | NaN | NaN | 0.2609 | 0.4500 | 0.2400 | 0.3250 | NaN |
| 66 | Hazel Park Preparatory Academy | 489.0 | 4.0 | 0.2453 | NaN | NaN | 0.0417 | 0.3226 | 0.1364 | 0.2500 | NaN |
| 67 | Hazel Park Preparatory Academy | 489.0 | 5.0 | 0.0377 | NaN | NaN | 0.0000 | 0.0370 | 0.0385 | 0.0392 | NaN |
| 68 | Hazel Park Preparatory Academy | 489.0 | 6.0 | 0.0693 | NaN | NaN | 0.0769 | 0.0189 | 0.1250 | 0.0556 | 0.1818 |
| 69 | Hazel Park Preparatory Academy | 489.0 | 7.0 | 0.0632 | NaN | NaN | 0.0000 | 0.0185 | 0.1220 | 0.0366 | 0.2308 |
| 70 | Hazel Park Preparatory Academy | 489.0 | 8.0 | 0.1882 | NaN | NaN | 0.0323 | 0.1538 | 0.2174 | 0.1918 | 0.1667 |
| 125 | Saint Paul Music Academy | 558.0 | 3.0 | 0.3118 | NaN | NaN | 0.4091 | 0.3696 | 0.2553 | 0.3012 | 0.4000 |
| 126 | Saint Paul Music Academy | 558.0 | 4.0 | 0.4095 | NaN | NaN | 0.2500 | 0.3600 | 0.4545 | 0.4130 | 0.3846 |
| 127 | Saint Paul Music Academy | 558.0 | 5.0 | 0.3273 | NaN | NaN | 0.1538 | 0.3333 | 0.3231 | 0.3039 | NaN |
Science Data
Science.query('Num in (415,558,449,489)')
| School | Num | Grade | Prof | White_Prof | POC_Prof | Black_Prof | Male_Prof | Female_Prof | FRPL_Prof | NonFRPL_Prof | |
|---|---|---|---|---|---|---|---|---|---|---|---|
| 1 | John A. Johnson Achievement Plus El. | 415.0 | 5 | 0.1852 | NaN | NaN | 0.1667 | 0.1852 | 0.1852 | 0.1667 | NaN |
| 9 | Bruce F Vento Elementary | 449.0 | 5 | 0.1446 | NaN | NaN | 0.1154 | 0.1042 | 0.2000 | 0.1282 | NaN |
| 21 | Hazel Park Preparatory Academy | 489.0 | 5 | 0.1346 | NaN | NaN | 0.1667 | 0.1481 | 0.1200 | 0.1400 | NaN |
| 22 | Hazel Park Preparatory Academy | 489.0 | 8 | 0.1071 | NaN | NaN | 0.0333 | 0.1538 | 0.0667 | 0.1111 | 0.0833 |
| 41 | Saint Paul Music Academy | 558.0 | 5 | 0.1182 | NaN | NaN | 0.0385 | 0.1556 | 0.0923 | 0.1176 | NaN |
Reading.query('Num==0 and Grade in (6,7,8)')
| School | Num | Grade | Prof | White_Prof | POC_Prof | Black_Prof | Male_Prof | Female_Prof | FRPL_Prof | NonFRPL_Prof | |
|---|---|---|---|---|---|---|---|---|---|---|---|
| 164 | Sp_District_All | 0.0 | 6.0 | 0.3847 | 0.7359 | 0.3013 | 0.2708 | 0.3539 | 0.4189 | 0.2689 | 0.6507 |
| 165 | Sp_District_All | 0.0 | 7.0 | 0.3716 | 0.7137 | 0.2890 | 0.2188 | 0.3336 | 0.4129 | 0.2640 | 0.6129 |
| 166 | Sp_District_All | 0.0 | 8.0 | 0.3918 | 0.7479 | 0.2987 | 0.2288 | 0.3644 | 0.4213 | 0.2780 | 0.6347 |
| 171 | Mpls_District_All | 0.0 | 6.0 | 0.4833 | 0.8116 | 0.3143 | 0.2714 | 0.4432 | 0.5241 | 0.2920 | 0.7757 |
| 172 | Mpls_District_All | 0.0 | 7.0 | 0.4662 | 0.8007 | 0.2755 | 0.2086 | 0.4358 | 0.4962 | 0.2369 | 0.7735 |
| 173 | Mpls_District_All | 0.0 | 8.0 | 0.4534 | 0.7420 | 0.2975 | 0.2285 | 0.4060 | 0.5045 | 0.2778 | 0.7059 |
| 178 | State_All | 0.0 | 6.0 | 0.6281 | 0.7206 | 0.4581 | 0.3805 | 0.5949 | 0.6626 | 0.4376 | 0.7502 |
| 179 | State_All | 0.0 | 7.0 | 0.5749 | 0.6578 | 0.4138 | 0.3201 | 0.5349 | 0.6170 | 0.3804 | 0.6913 |
| 180 | State_All | 0.0 | 8.0 | 0.5771 | 0.6544 | 0.4221 | 0.3308 | 0.5209 | 0.6357 | 0.3820 | 0.6877 |
Math Data
Math.query('Num==0 and Grade in (6,7,8)')
| School | Num | Grade | Prof | White_Prof | POC_Prof | Black_Prof | Male_Prof | Female_Prof | FRPL_Prof | NonFRPL_Prof | |
|---|---|---|---|---|---|---|---|---|---|---|---|
| 164 | Sp_District_All | 0.0 | 6.0 | 0.2463 | 0.6075 | 0.1615 | 0.1168 | 0.2522 | 0.2396 | 0.1409 | 0.4897 |
| 165 | Sp_District_All | 0.0 | 7.0 | 0.2737 | 0.5846 | 0.1995 | 0.1141 | 0.2555 | 0.2935 | 0.1724 | 0.5000 |
| 166 | Sp_District_All | 0.0 | 8.0 | 0.3274 | 0.6368 | 0.2455 | 0.1573 | 0.3106 | 0.3454 | 0.2271 | 0.5381 |
| 171 | Mpls_District_All | 0.0 | 6.0 | 0.3695 | 0.7087 | 0.1921 | 0.1420 | 0.3753 | 0.3636 | 0.1691 | 0.6752 |
| 172 | Mpls_District_All | 0.0 | 7.0 | 0.4025 | 0.7637 | 0.1972 | 0.1208 | 0.4071 | 0.3979 | 0.1585 | 0.7298 |
| 173 | Mpls_District_All | 0.0 | 8.0 | 0.4110 | 0.7044 | 0.2518 | 0.1706 | 0.3867 | 0.4373 | 0.2229 | 0.6825 |
| 178 | State_All | 0.0 | 6.0 | 0.5048 | 0.6068 | 0.3172 | 0.2258 | 0.5174 | 0.4917 | 0.2878 | 0.6437 |
| 179 | State_All | 0.0 | 7.0 | 0.5206 | 0.6164 | 0.3343 | 0.2282 | 0.5212 | 0.5199 | 0.2950 | 0.6554 |
| 180 | State_All | 0.0 | 8.0 | 0.5517 | 0.6365 | 0.3810 | 0.2615 | 0.5230 | 0.5816 | 0.3332 | 0.6752 |
Science Data
Science.query('Num==0 and Grade=="8"')
| School | Num | Grade | Prof | White_Prof | POC_Prof | Black_Prof | Male_Prof | Female_Prof | FRPL_Prof | NonFRPL_Prof | |
|---|---|---|---|---|---|---|---|---|---|---|---|
| 58 | Sp_District_All | 0.0 | 8 | 0.2463 | 0.6293 | 0.1425 | 0.1109 | 0.2659 | 0.2257 | 0.1338 | 0.4782 |
| 61 | Mpls_District_All | 0.0 | 8 | 0.3323 | 0.6386 | 0.1608 | 0.1235 | 0.3296 | 0.3352 | 0.1429 | 0.5955 |
| 64 | State_All | 0.0 | 8 | 0.4302 | 0.5137 | 0.2609 | 0.1754 | 0.4392 | 0.4208 | 0.2284 | 0.5429 |
Enroll.query('Num in (330,342,345)')
| Num | School | Tot_Enroll | Male% | White% | Black% | Asian% | FRP% | ELL% | SPED% | Homeless% | |
|---|---|---|---|---|---|---|---|---|---|---|---|
| 46 | 330.0 | Highland Park Middle School | 804.0 | 51.12 | 40.42 | 19.28 | 4.48 | 46.64% | 10.20% | 10.70% | 0.62% |
| 47 | 342.0 | Murray Middle School | 712.0 | 52.25 | 34.13 | 25.56 | 19.52 | 57.02% | 17.13% | 14.19% | 1.12% |
| 49 | 345.0 | Ramsey Middle School | 588.0 | 52.72 | 24.32 | 45.41 | 13.61 | 64.63% | 10.88% | 10.20% | 3.74% |
Reading Data
Reading.query('Num in (330,342,345)')
| School | Num | Grade | Prof | White_Prof | POC_Prof | Black_Prof | Male_Prof | Female_Prof | FRPL_Prof | NonFRPL_Prof | |
|---|---|---|---|---|---|---|---|---|---|---|---|
| 144 | Highland Park Middle School | 330.0 | 6.0 | 0.5630 | 0.8515 | 0.3905 | 0.5172 | 0.5481 | 0.5778 | 0.2960 | 0.7931 |
| 145 | Highland Park Middle School | 330.0 | 7.0 | 0.5573 | 0.8037 | 0.3871 | 0.3265 | 0.5362 | 0.5806 | 0.3000 | 0.7746 |
| 146 | Highland Park Middle School | 330.0 | 8.0 | 0.5579 | 0.8235 | 0.3643 | 0.2558 | 0.4444 | 0.6810 | 0.3448 | 0.7540 |
| 147 | Murray Middle School | 342.0 | 6.0 | 0.4777 | 0.7324 | 0.3595 | 0.2157 | 0.3945 | 0.5565 | 0.4015 | 0.5977 |
| 148 | Murray Middle School | 342.0 | 7.0 | 0.4526 | 0.8072 | 0.2550 | 0.2143 | 0.4000 | 0.5089 | 0.2500 | 0.7200 |
| 149 | Murray Middle School | 342.0 | 8.0 | 0.4516 | 0.7674 | 0.2443 | 0.2308 | 0.4828 | 0.4158 | 0.2417 | 0.7113 |
| 153 | Ramsey Middle School | 345.0 | 6.0 | 0.3939 | 0.7800 | 0.2635 | 0.1310 | 0.3368 | 0.4466 | 0.1789 | 0.7467 |
| 154 | Ramsey Middle School | 345.0 | 7.0 | 0.3230 | 0.7250 | 0.1901 | 0.1358 | 0.2556 | 0.4085 | 0.1927 | 0.5962 |
| 155 | Ramsey Middle School | 345.0 | 8.0 | 0.4419 | 0.7333 | 0.3386 | 0.2537 | 0.3958 | 0.5000 | 0.3143 | 0.6418 |
Math Data
Math.query('Num in (330,342,345)')
| School | Num | Grade | Prof | White_Prof | POC_Prof | Black_Prof | Male_Prof | Female_Prof | FRPL_Prof | NonFRPL_Prof | |
|---|---|---|---|---|---|---|---|---|---|---|---|
| 144 | Highland Park Middle School | 330.0 | 6.0 | 0.3941 | 0.7129 | 0.2024 | 0.2281 | 0.3881 | 0.4000 | 0.1360 | 0.6181 |
| 145 | Highland Park Middle School | 330.0 | 7.0 | 0.3808 | 0.6792 | 0.1753 | 0.1458 | 0.3358 | 0.4309 | 0.1008 | 0.6170 |
| 146 | Highland Park Middle School | 330.0 | 8.0 | 0.4008 | 0.7000 | 0.1825 | 0.1951 | 0.3333 | 0.4737 | 0.1607 | 0.6160 |
| 147 | Murray Middle School | 342.0 | 6.0 | 0.3516 | 0.6667 | 0.2157 | 0.1176 | 0.3394 | 0.3636 | 0.2370 | 0.5357 |
| 148 | Murray Middle School | 342.0 | 7.0 | 0.3030 | 0.5854 | 0.1477 | 0.1017 | 0.2712 | 0.3363 | 0.1203 | 0.5510 |
| 149 | Murray Middle School | 342.0 | 8.0 | 0.4112 | 0.6941 | 0.2248 | 0.1923 | 0.4464 | 0.3725 | 0.1780 | 0.6979 |
| 153 | Ramsey Middle School | 345.0 | 6.0 | 0.2150 | 0.5000 | 0.1200 | 0.0238 | 0.1856 | 0.2427 | 0.0645 | 0.4605 |
| 154 | Ramsey Middle School | 345.0 | 7.0 | 0.1914 | 0.5250 | 0.0820 | 0.0732 | 0.1319 | 0.2676 | 0.0734 | 0.4340 |
| 155 | Ramsey Middle School | 345.0 | 8.0 | 0.3547 | 0.6889 | 0.2362 | 0.1618 | 0.3438 | 0.3684 | 0.2115 | 0.5735 |
Science Data
Science.query('Num in (330,342,345)')
| School | Num | Grade | Prof | White_Prof | POC_Prof | Black_Prof | Male_Prof | Female_Prof | FRPL_Prof | NonFRPL_Prof | |
|---|---|---|---|---|---|---|---|---|---|---|---|
| 48 | Highland Park Middle School | 330.0 | 8 | 0.3712 | 0.6667 | 0.1579 | 0.1538 | 0.3362 | 0.4071 | 0.1402 | 0.5738 |
| 49 | Murray Middle School | 342.0 | 8 | 0.3430 | 0.6047 | 0.1570 | 0.1304 | 0.4159 | 0.2553 | 0.1364 | 0.5773 |
| 51 | Ramsey Middle School | 345.0 | 8 | 0.3353 | 0.7333 | 0.1953 | 0.2029 | 0.3895 | 0.2692 | 0.1887 | 0.5672 |
Enroll.query('Num in (344,315,310)')
| Num | School | Tot_Enroll | Male% | White% | Black% | Asian% | FRP% | ELL% | SPED% | Homeless% | |
|---|---|---|---|---|---|---|---|---|---|---|---|
| 44 | 310.0 | Battle Creek Middle | 750.0 | 53.20 | 6.13 | 34.67 | 38.93 | 77.87% | 31.33% | 15.73% | 2.40% |
| 45 | 315.0 | Farnsworth Aerospace Upper | 643.0 | 54.28 | 5.13 | 18.35 | 60.19 | 76.36% | 32.35% | 13.22% | 1.71% |
| 48 | 344.0 | Parkway Montessori/Community Middle | 450.0 | 50.89 | 14.22 | 24.22 | 42.67 | 76.22% | 22.67% | 21.33% | 1.78% |
Reading Data
Reading.query('Num in (344,315,310)')
| School | Num | Grade | Prof | White_Prof | POC_Prof | Black_Prof | Male_Prof | Female_Prof | FRPL_Prof | NonFRPL_Prof | |
|---|---|---|---|---|---|---|---|---|---|---|---|
| 137 | Battle Creek Middle | 310.0 | 6.0 | 0.2249 | NaN | NaN | 0.2391 | 0.2162 | 0.2376 | 0.2115 | 0.2927 |
| 138 | Battle Creek Middle | 310.0 | 7.0 | 0.2661 | 0.5714 | 0.2479 | 0.1910 | 0.1933 | 0.3333 | 0.2350 | 0.3958 |
| 139 | Battle Creek Middle | 310.0 | 8.0 | 0.2735 | 0.5000 | 0.2613 | 0.1928 | 0.2677 | 0.2804 | 0.2571 | 0.3220 |
| 140 | Farnsworth Aerospace Upper | 315.0 | 5.0 | 0.5000 | NaN | NaN | 0.4118 | 0.4444 | 0.5577 | 0.4819 | 0.5652 |
| 141 | Farnsworth Aerospace Upper | 315.0 | 6.0 | 0.2784 | NaN | NaN | 0.2500 | 0.2347 | 0.3333 | 0.2429 | 0.4167 |
| 142 | Farnsworth Aerospace Upper | 315.0 | 7.0 | 0.2965 | NaN | NaN | 0.2667 | 0.3107 | 0.2754 | 0.2756 | 0.3556 |
| 143 | Farnsworth Aerospace Upper | 315.0 | 8.0 | 0.2866 | NaN | NaN | 0.1429 | 0.2530 | 0.3210 | 0.2326 | 0.4857 |
| 150 | Parkway Montessori/Community Middle | 344.0 | 6.0 | 0.2789 | 0.4737 | 0.2500 | 0.2121 | 0.3165 | 0.2353 | 0.2455 | 0.3784 |
| 151 | Parkway Montessori/Community Middle | 344.0 | 7.0 | 0.2603 | 0.3158 | 0.2520 | 0.0811 | 0.1750 | 0.3636 | 0.2743 | 0.2121 |
| 152 | Parkway Montessori/Community Middle | 344.0 | 8.0 | 0.3538 | 0.7500 | 0.2818 | 0.1600 | 0.2500 | 0.4429 | 0.3000 | 0.5333 |
Math Data
Math.query('Num in (344,315,310)')
| School | Num | Grade | Prof | White_Prof | POC_Prof | Black_Prof | Male_Prof | Female_Prof | FRPL_Prof | NonFRPL_Prof | |
|---|---|---|---|---|---|---|---|---|---|---|---|
| 137 | Battle Creek Middle | 310.0 | 6.0 | 0.0683 | NaN | NaN | 0.0870 | 0.0743 | 0.0594 | 0.0625 | 0.0976 |
| 138 | Battle Creek Middle | 310.0 | 7.0 | 0.2048 | 0.1538 | 0.2076 | 0.0899 | 0.1849 | 0.2231 | 0.1791 | 0.3125 |
| 139 | Battle Creek Middle | 310.0 | 8.0 | 0.2383 | 0.4167 | 0.2287 | 0.0964 | 0.2362 | 0.2407 | 0.2273 | 0.2712 |
| 140 | Farnsworth Aerospace Upper | 315.0 | 5.0 | 0.3458 | NaN | NaN | 0.1667 | 0.4000 | 0.2885 | 0.3452 | 0.3478 |
| 141 | Farnsworth Aerospace Upper | 315.0 | 6.0 | 0.1534 | NaN | NaN | 0.1111 | 0.1327 | 0.1795 | 0.1071 | 0.3333 |
| 142 | Farnsworth Aerospace Upper | 315.0 | 7.0 | 0.2176 | NaN | NaN | 0.0667 | 0.2451 | 0.1765 | 0.2000 | 0.2667 |
| 143 | Farnsworth Aerospace Upper | 315.0 | 8.0 | 0.2112 | NaN | NaN | 0.0345 | 0.1687 | 0.2564 | 0.1654 | 0.3824 |
| 150 | Parkway Montessori/Community Middle | 344.0 | 6.0 | 0.1096 | 0.2632 | 0.0866 | 0.0303 | 0.1392 | 0.0746 | 0.0818 | 0.1944 |
| 151 | Parkway Montessori/Community Middle | 344.0 | 7.0 | 0.1862 | 0.2632 | 0.1746 | 0.0278 | 0.1500 | 0.2308 | 0.1964 | 0.1515 |
| 152 | Parkway Montessori/Community Middle | 344.0 | 8.0 | 0.2824 | 0.6500 | 0.2162 | 0.1600 | 0.2097 | 0.3478 | 0.2277 | 0.4667 |
Science Data
Science.query('Num in (344,315,310)')
| School | Num | Grade | Prof | White_Prof | POC_Prof | Black_Prof | Male_Prof | Female_Prof | FRPL_Prof | NonFRPL_Prof | |
|---|---|---|---|---|---|---|---|---|---|---|---|
| 45 | Battle Creek Middle | 310.0 | 8 | 0.1234 | 0.3333 | 0.1121 | 0.0964 | 0.1181 | 0.1296 | 0.1017 | 0.1897 |
| 46 | Farnsworth Aerospace Upper | 315.0 | 5 | 0.3178 | NaN | NaN | 0.2778 | 0.3636 | 0.2692 | 0.3095 | 0.3478 |
| 47 | Farnsworth Aerospace Upper | 315.0 | 8 | 0.1534 | NaN | NaN | 0.0345 | 0.1585 | 0.1481 | 0.1172 | 0.2857 |
| 50 | Parkway Montessori/Community Middle | 344.0 | 8 | 0.1563 | 0.5000 | 0.0926 | 0.0000 | 0.1017 | 0.2029 | 0.1212 | 0.2759 |


Reading.query('Num==0 and Grade in (9,10,11,12)')
| School | Num | Grade | Prof | White_Prof | POC_Prof | Black_Prof | Male_Prof | Female_Prof | FRPL_Prof | NonFRPL_Prof | |
|---|---|---|---|---|---|---|---|---|---|---|---|
| 167 | Sp_District_All | 0.0 | 10.0 | 0.4586 | 0.7739 | 0.3704 | 0.2714 | 0.4244 | 0.4929 | 0.3416 | 0.6713 |
| 174 | Mpls_District_All | 0.0 | 10.0 | 0.4187 | 0.7016 | 0.2360 | 0.1768 | 0.3891 | 0.4569 | 0.2162 | 0.6480 |
| 181 | State_All | 0.0 | 10.0 | 0.6040 | 0.6712 | 0.4460 | 0.3413 | 0.5560 | 0.6544 | 0.4095 | 0.6959 |
Math Data
Math.query('Num==0 and Grade in (9,10,11,12)')
| School | Num | Grade | Prof | White_Prof | POC_Prof | Black_Prof | Male_Prof | Female_Prof | FRPL_Prof | NonFRPL_Prof | |
|---|---|---|---|---|---|---|---|---|---|---|---|
| 167 | Sp_District_All | 0.0 | 11.0 | 0.2735 | 0.5640 | 0.2190 | 0.1262 | 0.2925 | 0.2503 | 0.2011 | 0.4486 |
| 174 | Mpls_District_All | 0.0 | 11.0 | 0.2715 | 0.6119 | 0.1111 | 0.0648 | 0.2713 | 0.2718 | 0.1007 | 0.5126 |
| 181 | State_All | 0.0 | 11.0 | 0.4502 | 0.5219 | 0.2802 | 0.1688 | 0.4441 | 0.4568 | 0.2366 | 0.5460 |
Science Data
Science.query('Num==0 and Grade in (9,10,11,12)')
| School | Num | Grade | Prof | White_Prof | POC_Prof | Black_Prof | Male_Prof | Female_Prof | FRPL_Prof | NonFRPL_Prof |
|---|
Enroll.query('Num in (220,210,212,215,230)')
| Num | School | Tot_Enroll | Male% | White% | Black% | Asian% | FRP% | ELL% | SPED% | Homeless% | |
|---|---|---|---|---|---|---|---|---|---|---|---|
| 50 | 210.0 | Central Senior High | 1795.0 | 46.46 | 41.06 | 28.86 | 19.33 | 45.91% | 10.92% | 10.42% | 1.45% |
| 51 | 212.0 | Como Park Senior High | 1307.0 | 51.64 | 19.05 | 34.74 | 32.59 | 64.35% | 36.80% | 12.78% | 1.68% |
| 52 | 215.0 | Harding Senior High | 1908.0 | 51.78 | 6.08 | 21.07 | 54.40 | 73.17% | 33.75% | 12.32% | 1.47% |
| 53 | 220.0 | Highland Park Senior High | 1328.0 | 50.60 | 35.69 | 22.59 | 14.83 | 45.56% | 15.44% | 9.94% | 0.38% |
| 54 | 230.0 | Johnson Senior High | 1295.0 | 56.99 | 10.12 | 22.93 | 52.20 | 75.98% | 24.09% | 15.83% | 1.08% |
Reading Data
Reading.query('Num in (220,210,212,215,230)')
| School | Num | Grade | Prof | White_Prof | POC_Prof | Black_Prof | Male_Prof | Female_Prof | FRPL_Prof | NonFRPL_Prof | |
|---|---|---|---|---|---|---|---|---|---|---|---|
| 156 | Central Senior High | 210.0 | 10.0 | 0.6639 | 0.8667 | 0.4949 | 0.4167 | 0.6201 | 0.7065 | 0.4161 | 0.8364 |
| 157 | Como Park Senior High | 212.0 | 10.0 | 0.2915 | 0.7193 | 0.1632 | 0.1548 | 0.2212 | 0.3507 | 0.1781 | 0.4554 |
| 158 | Harding Senior High | 215.0 | 10.0 | 0.4005 | 0.4545 | 0.3972 | 0.3231 | 0.3436 | 0.4615 | 0.3891 | 0.4314 |
| 159 | Highland Park Senior High | 220.0 | 10.0 | 0.6339 | 0.8296 | 0.5025 | 0.3770 | 0.5954 | 0.6748 | 0.4275 | 0.7778 |
| 160 | Johnson Senior High | 230.0 | 10.0 | 0.4613 | 0.6585 | 0.4297 | 0.2055 | 0.4333 | 0.4898 | 0.4135 | 0.6500 |
Math Data
Math.query('Num in (220,210,212,215,230)')
| School | Num | Grade | Prof | White_Prof | POC_Prof | Black_Prof | Male_Prof | Female_Prof | FRPL_Prof | NonFRPL_Prof | |
|---|---|---|---|---|---|---|---|---|---|---|---|
| 156 | Central Senior High | 210.0 | 11.0 | 0.4663 | 0.7692 | 0.2920 | 0.1458 | 0.5579 | 0.3614 | 0.2234 | 0.7381 |
| 157 | Como Park Senior High | 212.0 | 11.0 | 0.2235 | 0.5455 | 0.1507 | 0.1224 | 0.2277 | 0.2179 | 0.1591 | 0.4043 |
| 158 | Harding Senior High | 215.0 | 11.0 | 0.2104 | 0.2273 | 0.2092 | 0.1290 | 0.2105 | 0.2102 | 0.1837 | 0.2745 |
| 159 | Highland Park Senior High | 220.0 | 11.0 | 0.4612 | 0.6782 | 0.3418 | 0.3077 | 0.5250 | 0.4000 | 0.2931 | 0.6124 |
| 160 | Johnson Senior High | 230.0 | 11.0 | 0.2574 | 0.4231 | 0.2398 | 0.1739 | 0.2948 | 0.1919 | 0.2407 | 0.3214 |
Science Data
Science.query('Num in (220,210,212,215,230)')
| School | Num | Grade | Prof | White_Prof | POC_Prof | Black_Prof | Male_Prof | Female_Prof | FRPL_Prof | NonFRPL_Prof | |
|---|---|---|---|---|---|---|---|---|---|---|---|
| 52 | Central Senior High | 210.0 | HS | 0.4960 | 0.7243 | 0.2784 | 0.1566 | 0.4833 | 0.5075 | 0.2715 | 0.6447 |
| 53 | Como Park Senior High | 212.0 | HS | 0.3296 | 0.6667 | 0.2164 | 0.1667 | 0.3871 | 0.2674 | 0.2243 | 0.4861 |
| 54 | Harding Senior High | 215.0 | HS | 0.2500 | 0.4118 | 0.2390 | 0.1591 | 0.2828 | 0.2114 | 0.2199 | 0.3247 |
| 55 | Highland Park Senior High | 220.0 | HS | 0.4507 | 0.7041 | 0.3172 | 0.2879 | 0.4027 | 0.5037 | 0.2537 | 0.6267 |
| 56 | Johnson Senior High | 230.0 | HS | 0.2466 | 0.4750 | 0.2109 | 0.0882 | 0.2632 | 0.2292 | 0.2119 | 0.3833 |
Run Code
#Run Code
import pandas as pd
import numpy as np
import warnings
warnings.filterwarnings('ignore')
import matplotlib as mpl
import matplotlib.pyplot as plt
%matplotlib inline
import requests # library to handle requests
import folium
import seaborn as sns
import scipy.stats as stats #used to get correlation coefficient

#load data
Enroll= pd.read_csv('Data/SPEnrollment.csv')
Math= pd.read_csv('Data/SPMath.csv')
Reading= pd.read_csv('Data/SPReading.csv')
Science= pd.read_csv('Data/SPScience.csv')
HL= pd.read_csv('Data/TCHomeless.csv')
Add= pd.read_csv('Data/AddSchool.csv')
School= pd.read_csv('Data/SchoolProf.csv')


def plot_Homeless():
    # generate a new map
    FG_map = folium.Map(location=[44.988326, -93.162926], zoom_start=12,tiles="OpenStreetMap")
    A=HL.query('Homeless_Count>3 and Num!=527')

    print('This map displays 2019 Homeless Student Count > 3 from October 1st,2019 Enrollment')
    for index, row in A.iterrows():
        popup_text = "School: {}<br> Address: {}<br> Homeless_Count: {}<br> Homeless%: {}<br> Total Enrollment: {}"
        popup_text = popup_text.format(row["School"],row["Address"], row['Homeless_Count'],row['Homeless%'],row['Tot_Enroll'] )
        folium.CircleMarker(location=(row["Latitude"],row["Longitude"]),
                            radius=row['Homeless_Count'],
                            color="#E37222",
                            popup=popup_text,
                            fill=True).add_to(FG_map)

    return FG_map

def plot_School_White(Subject='Math'):
    Index =['School','Latitude','Longitude', 'Total_Tested','Proficiency','Address','Subject','Ranking','White%']

    FG_map = folium.Map(location=[44.958326, -93.122926], zoom_start=12,tiles="OpenStreetMap")

    B= School[(School['Subject'] == Subject)]
    B=B.query('School_Num not in (1581,1386)')
    B4=B.query('Ranking == 4')
    B3=B.query('Ranking == 3')
    B2=B.query('Ranking == 2')
    B1=B.query('Ranking == 1')

    print('This map displays 2019 {} Proficiency under normalized White%'.format(Subject))
    for index, row in B4.iterrows():
        popup_text = "School: {}<br> Address: {}<br> Tested: {}<br> Proficiency: {}<br> White%: {}"
        popup_text = popup_text.format(row["School"],row["Address"], row['Total_Tested'], row['Proficiency'], row['White%'])
        folium.CircleMarker(location=(row["Latitude"],row["Longitude"]),
                            radius=row['White%']/2,
                            color="#0000ff",
                            popup=popup_text,
                            fill=True).add_to(FG_map)

    for index, row in B3.iterrows():
        popup_text = "School: {}<br> Address: {}<br> Tested: {}<br> Proficiency: {}<br> White%: {}"
        popup_text = popup_text.format(row["School"],row["Address"], row['Total_Tested'], row['Proficiency'], row['White%'])
        folium.CircleMarker(location=(row["Latitude"],row["Longitude"]),
                            radius=row['White%']/2,
                            color="#007849",
                            popup=popup_text,
                            fill=True).add_to(FG_map)

    for index, row in B2.iterrows():
        popup_text = "School: {}<br> Address: {}<br> Tested: {}<br> Proficiency: {}<br> White%: {}"
        popup_text = popup_text.format(row["School"],row["Address"], row['Total_Tested'], row['Proficiency'], row['White%'])
        folium.CircleMarker(location=(row["Latitude"],row["Longitude"]),
                            radius=row['White%']/2,
                            color="#E37222",
                            popup=popup_text,
                            fill=True).add_to(FG_map)

    for index, row in B1.iterrows():
        popup_text = "School: {}<br> Address: {}<br> Tested: {}<br> Proficiency: {}<br> White%: {}"
        popup_text = popup_text.format(row["School"],row["Address"], row['Total_Tested'], row['Proficiency'], row['White%'])
        folium.CircleMarker(location=(row["Latitude"],row["Longitude"]),
                            radius=row['White%']/2,
                            color="#ff0000",
                            popup=popup_text,
                            fill=True).add_to(FG_map)

    return FG_map

#Black
def plot_School_Black(Subject='Math'):
    Index =['School','Latitude','Longitude', 'Total_Tested','Proficiency','Address','Subject','Ranking','Black%']

    FG_map = folium.Map(location=[44.958326, -93.122926], zoom_start=12,tiles="OpenStreetMap")

    B= School[(School['Subject'] == Subject)]
    B=B.query('School_Num not in (1581,1386)')
    B4=B.query('Ranking == 4')
    B3=B.query('Ranking == 3')
    B2=B.query('Ranking == 2')
    B1=B.query('Ranking == 1')

    print('This map displays 2019 {} Proficiency under normalized Black%'.format(Subject))
    for index, row in B4.iterrows():
        popup_text = "School: {}<br> Address: {}<br> Tested: {}<br> Proficiency: {}<br> Black%: {}"
        popup_text = popup_text.format(row["School"],row["Address"], row['Total_Tested'], row['Proficiency'], row['Black%'])
        folium.CircleMarker(location=(row["Latitude"],row["Longitude"]),
                            radius=row['Black%']/2,
                            color="#0000ff",
                            popup=popup_text,
                            fill=True).add_to(FG_map)

    for index, row in B3.iterrows():
        popup_text = "School: {}<br> Address: {}<br> Tested: {}<br> Proficiency: {}<br> Black%: {}"
        popup_text = popup_text.format(row["School"],row["Address"], row['Total_Tested'], row['Proficiency'], row['Black%'])
        folium.CircleMarker(location=(row["Latitude"],row["Longitude"]),
                            radius=row['Black%']/2,
                            color="#007849",
                            popup=popup_text,
                            fill=True).add_to(FG_map)

    for index, row in B2.iterrows():
        popup_text = "School: {}<br> Address: {}<br> Tested: {}<br> Proficiency: {}<br> Black%: {}"
        popup_text = popup_text.format(row["School"],row["Address"], row['Total_Tested'], row['Proficiency'], row['Black%'])
        folium.CircleMarker(location=(row["Latitude"],row["Longitude"]),
                            radius=row['Black%']/2,
                            color="#E37222",
                            popup=popup_text,
                            fill=True).add_to(FG_map)

    for index, row in B1.iterrows():
        popup_text = "School: {}<br> Address: {}<br> Tested: {}<br> Proficiency: {}<br> Black%: {}"
        popup_text = popup_text.format(row["School"],row["Address"], row['Total_Tested'], row['Proficiency'], row['Black%'])
        folium.CircleMarker(location=(row["Latitude"],row["Longitude"]),
                            radius=row['Black%']/2,
                            color="#ff0000",
                            popup=popup_text,
                            fill=True).add_to(FG_map)

    return FG_map

#Asian
def plot_School_Asian(Subject='Math'):
    Index =['School','Latitude','Longitude', 'Total_Tested','Proficiency','Address','Subject','Ranking','Asian%']

    FG_map = folium.Map(location=[44.958326, -93.122926], zoom_start=12,tiles="OpenStreetMap")

    B= School[(School['Subject'] == Subject)]
    B=B.query('School_Num not in (1581,1386)')
    B4=B.query('Ranking == 4')
    B3=B.query('Ranking == 3')
    B2=B.query('Ranking == 2')
    B1=B.query('Ranking == 1')

    print('This map displays 2019 {} Proficiency under normalized Asian%'.format(Subject))
    for index, row in B4.iterrows():
        popup_text = "School: {}<br> Address: {}<br> Tested: {}<br> Proficiency: {}<br> Asian%: {}"
        popup_text = popup_text.format(row["School"],row["Address"], row['Total_Tested'], row['Proficiency'], row['Asian%'])
        folium.CircleMarker(location=(row["Latitude"],row["Longitude"]),
                            radius=row['Asian%']/2,
                            color="#0000ff",
                            popup=popup_text,
                            fill=True).add_to(FG_map)

    for index, row in B3.iterrows():
        popup_text = "School: {}<br> Address: {}<br> Tested: {}<br> Proficiency: {}<br> Asian%: {}"
        popup_text = popup_text.format(row["School"],row["Address"], row['Total_Tested'], row['Proficiency'], row['Asian%'])
        folium.CircleMarker(location=(row["Latitude"],row["Longitude"]),
                            radius=row['Asian%']/2,
                            color="#007849",
                            popup=popup_text,
                            fill=True).add_to(FG_map)

    for index, row in B2.iterrows():
        popup_text = "School: {}<br> Address: {}<br> Tested: {}<br> Proficiency: {}<br> Asian%: {}"
        popup_text = popup_text.format(row["School"],row["Address"], row['Total_Tested'], row['Proficiency'], row['Asian%'])
        folium.CircleMarker(location=(row["Latitude"],row["Longitude"]),
                            radius=row['Asian%']/2,
                            color="#E37222",
                            popup=popup_text,
                            fill=True).add_to(FG_map)

    for index, row in B1.iterrows():
        popup_text = "School: {}<br> Address: {}<br> Tested: {}<br> Proficiency: {}<br> Asian%: {}"
        popup_text = popup_text.format(row["School"],row["Address"], row['Total_Tested'], row['Proficiency'], row['Asian%'])
        folium.CircleMarker(location=(row["Latitude"],row["Longitude"]),
                            radius=row['Asian%']/2,
                            color="#ff0000",
                            popup=popup_text,
                            fill=True).add_to(FG_map)

    return FG_map

#ELL
def plot_School_ELL(Subject='Math'):
    Index =['School','Latitude','Longitude', 'Total_Tested','Proficiency','Address','Subject','Ranking','ELL%']

    FG_map = folium.Map(location=[44.958326, -93.122926], zoom_start=12,tiles="OpenStreetMap")

    B= School[(School['Subject'] == Subject)]
    B=B.query('School_Num not in (1581,1386)')
    B4=B.query('Ranking == 4')
    B3=B.query('Ranking == 3')
    B2=B.query('Ranking == 2')
    B1=B.query('Ranking == 1')

    print('This map displays 2019 {} Proficiency under normalized ELL%'.format(Subject))
    for index, row in B4.iterrows():
        popup_text = "School: {}<br> Address: {}<br> Tested: {}<br> Proficiency: {}<br> ELL%: {}"
        popup_text = popup_text.format(row["School"],row["Address"], row['Total_Tested'], row['Proficiency'], row['ELL%'])
        folium.CircleMarker(location=(row["Latitude"],row["Longitude"]),
                            radius=row['ELL%']/2,
                            color="#0000ff",
                            popup=popup_text,
                            fill=True).add_to(FG_map)

    for index, row in B3.iterrows():
        popup_text = "School: {}<br> Address: {}<br> Tested: {}<br> Proficiency: {}<br> ELL%: {}"
        popup_text = popup_text.format(row["School"],row["Address"], row['Total_Tested'], row['Proficiency'], row['ELL%'])
        folium.CircleMarker(location=(row["Latitude"],row["Longitude"]),
                            radius=row['ELL%']/2,
                            color="#007849",
                            popup=popup_text,
                            fill=True).add_to(FG_map)

    for index, row in B2.iterrows():
        popup_text = "School: {}<br> Address: {}<br> Tested: {}<br> Proficiency: {}<br> ELL%: {}"
        popup_text = popup_text.format(row["School"],row["Address"], row['Total_Tested'], row['Proficiency'], row['ELL%'])
        folium.CircleMarker(location=(row["Latitude"],row["Longitude"]),
                            radius=row['ELL%']/2,
                            color="#E37222",
                            popup=popup_text,
                            fill=True).add_to(FG_map)

    for index, row in B1.iterrows():
        popup_text = "School: {}<br> Address: {}<br> Tested: {}<br> Proficiency: {}<br> ELL%: {}"
        popup_text = popup_text.format(row["School"],row["Address"], row['Total_Tested'], row['Proficiency'], row['ELL%'])
        folium.CircleMarker(location=(row["Latitude"],row["Longitude"]),
                            radius=row['ELL%']/2,
                            color="#ff0000",
                            popup=popup_text,
                            fill=True).add_to(FG_map)

    return FG_map

#SPED
def plot_School_SPED(Subject='Math'):
    Index =['School','Latitude','Longitude', 'Total_Tested','Proficiency','Address','Subject','Ranking','SPED%']

    FG_map = folium.Map(location=[44.958326, -93.122926], zoom_start=12,tiles="OpenStreetMap")

    B= School[(School['Subject'] == Subject)]
    B=B.query('School_Num not in (1581,1386)')
    B4=B.query('Ranking == 4')
    B3=B.query('Ranking == 3')
    B2=B.query('Ranking == 2')
    B1=B.query('Ranking == 1')

    print('This map displays 2019 {} Proficiency under normalized SPED%'.format(Subject))
    for index, row in B4.iterrows():
        popup_text = "School: {}<br> Address: {}<br> Tested: {}<br> Proficiency: {}<br> SPED%: {}"
        popup_text = popup_text.format(row["School"],row["Address"], row['Total_Tested'], row['Proficiency'], row['SPED%'])
        folium.CircleMarker(location=(row["Latitude"],row["Longitude"]),
                            radius=row['SPED%'/2],
                            color="#0000ff",
                            popup=popup_text,
                            fill=True).add_to(FG_map)

    for index, row in B3.iterrows():
        popup_text = "School: {}<br> Address: {}<br> Tested: {}<br> Proficiency: {}<br> SPED%: {}"
        popup_text = popup_text.format(row["School"],row["Address"], row['Total_Tested'], row['Proficiency'], row['SPED%'])
        folium.CircleMarker(location=(row["Latitude"],row["Longitude"]),
                            radius=row['SPED%'/2],
                            color="#007849",
                            popup=popup_text,
                            fill=True).add_to(FG_map)

    for index, row in B2.iterrows():
        popup_text = "School: {}<br> Address: {}<br> Tested: {}<br> Proficiency: {}<br> SPED%: {}"
        popup_text = popup_text.format(row["School"],row["Address"], row['Total_Tested'], row['Proficiency'], row['SPED%'])
        folium.CircleMarker(location=(row["Latitude"],row["Longitude"]),
                            radius=row['SPED%'/2],
                            color="#E37222",
                            popup=popup_text,
                            fill=True).add_to(FG_map)

    for index, row in B1.iterrows():
        popup_text = "School: {}<br> Address: {}<br> Tested: {}<br> Proficiency: {}<br> SPED%: {}"
        popup_text = popup_text.format(row["School"],row["Address"], row['Total_Tested'], row['Proficiency'], row['SPED%'])
        folium.CircleMarker(location=(row["Latitude"],row["Longitude"]),
                            radius=row['SPED%'/2],
                            color="#ff0000",
                            popup=popup_text,
                            fill=True).add_to(FG_map)

    return FG_map


#FRPL
def plot_School_FRPL(Subject='Math'):
    Index =['School','Latitude','Longitude', 'Total_Tested','Proficiency','Address','Subject','Ranking','FRPL%']

    FG_map = folium.Map(location=[44.958326, -93.122926], zoom_start=12,tiles="OpenStreetMap")

    B= School[(School['Subject'] == Subject)]
    B=B.query('School_Num not in (1581,1386)')
    B4=B.query('Ranking == 4')
    B3=B.query('Ranking == 3')
    B2=B.query('Ranking == 2')
    B1=B.query('Ranking == 1')

    print('This map displays 2019 {} Proficiency under normalized FRPL%'.format(Subject))
    for index, row in B4.iterrows():
        popup_text = "School: {}<br> Address: {}<br> Tested: {}<br> Proficiency: {}<br> FRPL%: {}"
        popup_text = popup_text.format(row["School"],row["Address"], row['Total_Tested'], row['Proficiency'], row['FRPL%'])
        folium.CircleMarker(location=(row["Latitude"],row["Longitude"]),
                            radius=row['FRPL%']/2,
                            color="#0000ff",
                            popup=popup_text,
                            fill=True).add_to(FG_map)

    for index, row in B3.iterrows():
        popup_text = "School: {}<br> Address: {}<br> Tested: {}<br> Proficiency: {}<br> FRPL%: {}"
        popup_text = popup_text.format(row["School"],row["Address"], row['Total_Tested'], row['Proficiency'], row['FRPL%'])
        folium.CircleMarker(location=(row["Latitude"],row["Longitude"]),
                            radius=row['FRPL%']/2,
                            color="#007849",
                            popup=popup_text,
                            fill=True).add_to(FG_map)

    for index, row in B2.iterrows():
        popup_text = "School: {}<br> Address: {}<br> Tested: {}<br> Proficiency: {}<br> FRPL%: {}"
        popup_text = popup_text.format(row["School"],row["Address"], row['Total_Tested'], row['Proficiency'], row['FRPL%'])
        folium.CircleMarker(location=(row["Latitude"],row["Longitude"]),
                            radius=row['FRPL%']/2,
                            color="#E37222",
                            popup=popup_text,
                            fill=True).add_to(FG_map)

    for index, row in B1.iterrows():
        popup_text = "School: {}<br> Address: {}<br> Tested: {}<br> Proficiency: {}<br> FRPL%: {}"
        popup_text = popup_text.format(row["School"],row["Address"], row['Total_Tested'], row['Proficiency'], row['FRPL%'])
        folium.CircleMarker(location=(row["Latitude"],row["Longitude"]),
                            radius=row['FRPL%']/2,
                            color="#ff0000",
                            popup=popup_text,
                            fill=True).add_to(FG_map)

    return FG_map
def plot_School_White(Subject='Math'):
    Index =['School','Latitude','Longitude', 'Total_Tested','Proficiency','Address','Subject','Ranking','White%']

    FG_map = folium.Map(location=[44.958326, -93.122926], zoom_start=12,tiles="OpenStreetMap")

    B= School[(School['Subject'] == Subject)]
    B=B.query('School_Num not in (1581,1386)')
    B4=B.query('Ranking == 4')
    B3=B.query('Ranking == 3')
    B2=B.query('Ranking == 2')
    B1=B.query('Ranking == 1')

    print('This map displays 2019 {} Proficiency under normalized White%'.format(Subject))
    for index, row in B4.iterrows():
        popup_text = "School: {}<br> Address: {}<br> Tested: {}<br> Proficiency: {}<br> White%: {}"
        popup_text = popup_text.format(row["School"],row["Address"], row['Total_Tested'], row['Proficiency'], row['White%'])
        folium.CircleMarker(location=(row["Latitude"],row["Longitude"]),
                            radius=row['White%']/2,
                            color="#0000ff",
                            popup=popup_text,
                            fill=True).add_to(FG_map)

    for index, row in B3.iterrows():
        popup_text = "School: {}<br> Address: {}<br> Tested: {}<br> Proficiency: {}<br> White%: {}"
        popup_text = popup_text.format(row["School"],row["Address"], row['Total_Tested'], row['Proficiency'], row['White%'])
        folium.CircleMarker(location=(row["Latitude"],row["Longitude"]),
                            radius=row['White%']/2,
                            color="#007849",
                            popup=popup_text,
                            fill=True).add_to(FG_map)

    for index, row in B2.iterrows():
        popup_text = "School: {}<br> Address: {}<br> Tested: {}<br> Proficiency: {}<br> White%: {}"
        popup_text = popup_text.format(row["School"],row["Address"], row['Total_Tested'], row['Proficiency'], row['White%'])
        folium.CircleMarker(location=(row["Latitude"],row["Longitude"]),
                            radius=row['White%']/2,
                            color="#E37222",
                            popup=popup_text,
                            fill=True).add_to(FG_map)

    for index, row in B1.iterrows():
        popup_text = "School: {}<br> Address: {}<br> Tested: {}<br> Proficiency: {}<br> White%: {}"
        popup_text = popup_text.format(row["School"],row["Address"], row['Total_Tested'], row['Proficiency'], row['White%'])
        folium.CircleMarker(location=(row["Latitude"],row["Longitude"]),
                            radius=row['White%']/2,
                            color="#ff0000",
                            popup=popup_text,
                            fill=True).add_to(FG_map)

    return FG_map

#Black
def plot_School_Black(Subject='Math'):
    Index =['School','Latitude','Longitude', 'Total_Tested','Proficiency','Address','Subject','Ranking','Black%']

    FG_map = folium.Map(location=[44.958326, -93.122926], zoom_start=12,tiles="OpenStreetMap")

    B= School[(School['Subject'] == Subject)]
    B=B.query('School_Num not in (1581,1386)')
    B4=B.query('Ranking == 4')
    B3=B.query('Ranking == 3')
    B2=B.query('Ranking == 2')
    B1=B.query('Ranking == 1')

    print('This map displays 2019 {} Proficiency under normalized Black%'.format(Subject))
    for index, row in B4.iterrows():
        popup_text = "School: {}<br> Address: {}<br> Tested: {}<br> Proficiency: {}<br> Black%: {}"
        popup_text = popup_text.format(row["School"],row["Address"], row['Total_Tested'], row['Proficiency'], row['Black%'])
        folium.CircleMarker(location=(row["Latitude"],row["Longitude"]),
                            radius=row['Black%']/2,
                            color="#0000ff",
                            popup=popup_text,
                            fill=True).add_to(FG_map)

    for index, row in B3.iterrows():
        popup_text = "School: {}<br> Address: {}<br> Tested: {}<br> Proficiency: {}<br> Black%: {}"
        popup_text = popup_text.format(row["School"],row["Address"], row['Total_Tested'], row['Proficiency'], row['Black%'])
        folium.CircleMarker(location=(row["Latitude"],row["Longitude"]),
                            radius=row['Black%']/2,
                            color="#007849",
                            popup=popup_text,
                            fill=True).add_to(FG_map)

    for index, row in B2.iterrows():
        popup_text = "School: {}<br> Address: {}<br> Tested: {}<br> Proficiency: {}<br> Black%: {}"
        popup_text = popup_text.format(row["School"],row["Address"], row['Total_Tested'], row['Proficiency'], row['Black%'])
        folium.CircleMarker(location=(row["Latitude"],row["Longitude"]),
                            radius=row['Black%']/2,
                            color="#E37222",
                            popup=popup_text,
                            fill=True).add_to(FG_map)

    for index, row in B1.iterrows():
        popup_text = "School: {}<br> Address: {}<br> Tested: {}<br> Proficiency: {}<br> Black%: {}"
        popup_text = popup_text.format(row["School"],row["Address"], row['Total_Tested'], row['Proficiency'], row['Black%'])
        folium.CircleMarker(location=(row["Latitude"],row["Longitude"]),
                            radius=row['Black%']/2,
                            color="#ff0000",
                            popup=popup_text,
                            fill=True).add_to(FG_map)

    return FG_map

#Asian
def plot_School_Asian(Subject='Math'):
    Index =['School','Latitude','Longitude', 'Total_Tested','Proficiency','Address','Subject','Ranking','Asian%']

    FG_map = folium.Map(location=[44.958326, -93.122926], zoom_start=12,tiles="OpenStreetMap")

    B= School[(School['Subject'] == Subject)]
    B=B.query('School_Num not in (1581,1386)')
    B4=B.query('Ranking == 4')
    B3=B.query('Ranking == 3')
    B2=B.query('Ranking == 2')
    B1=B.query('Ranking == 1')

    print('This map displays 2019 {} Proficiency under normalized Asian%'.format(Subject))
    for index, row in B4.iterrows():
        popup_text = "School: {}<br> Address: {}<br> Tested: {}<br> Proficiency: {}<br> Asian%: {}"
        popup_text = popup_text.format(row["School"],row["Address"], row['Total_Tested'], row['Proficiency'], row['Asian%'])
        folium.CircleMarker(location=(row["Latitude"],row["Longitude"]),
                            radius=row['Asian%']/2,
                            color="#0000ff",
                            popup=popup_text,
                            fill=True).add_to(FG_map)

    for index, row in B3.iterrows():
        popup_text = "School: {}<br> Address: {}<br> Tested: {}<br> Proficiency: {}<br> Asian%: {}"
        popup_text = popup_text.format(row["School"],row["Address"], row['Total_Tested'], row['Proficiency'], row['Asian%'])
        folium.CircleMarker(location=(row["Latitude"],row["Longitude"]),
                            radius=row['Asian%']/2,
                            color="#007849",
                            popup=popup_text,
                            fill=True).add_to(FG_map)

    for index, row in B2.iterrows():
        popup_text = "School: {}<br> Address: {}<br> Tested: {}<br> Proficiency: {}<br> Asian%: {}"
        popup_text = popup_text.format(row["School"],row["Address"], row['Total_Tested'], row['Proficiency'], row['Asian%'])
        folium.CircleMarker(location=(row["Latitude"],row["Longitude"]),
                            radius=row['Asian%']/2,
                            color="#E37222",
                            popup=popup_text,
                            fill=True).add_to(FG_map)

    for index, row in B1.iterrows():
        popup_text = "School: {}<br> Address: {}<br> Tested: {}<br> Proficiency: {}<br> Asian%: {}"
        popup_text = popup_text.format(row["School"],row["Address"], row['Total_Tested'], row['Proficiency'], row['Asian%'])
        folium.CircleMarker(location=(row["Latitude"],row["Longitude"]),
                            radius=row['Asian%']/2,
                            color="#ff0000",
                            popup=popup_text,
                            fill=True).add_to(FG_map)

    return FG_map

#ELL
def plot_School_ELL(Subject='Math'):
    Index =['School','Latitude','Longitude', 'Total_Tested','Proficiency','Address','Subject','Ranking','ELL%']

    FG_map = folium.Map(location=[44.958326, -93.122926], zoom_start=12,tiles="OpenStreetMap")

    B= School[(School['Subject'] == Subject)]
    B=B.query('School_Num not in (1581,1386)')
    B4=B.query('Ranking == 4')
    B3=B.query('Ranking == 3')
    B2=B.query('Ranking == 2')
    B1=B.query('Ranking == 1')

    print('This map displays 2019 {} Proficiency under normalized ELL%'.format(Subject))
    for index, row in B4.iterrows():
        popup_text = "School: {}<br> Address: {}<br> Tested: {}<br> Proficiency: {}<br> ELL%: {}"
        popup_text = popup_text.format(row["School"],row["Address"], row['Total_Tested'], row['Proficiency'], row['ELL%'])
        folium.CircleMarker(location=(row["Latitude"],row["Longitude"]),
                            radius=row['ELL%']/2,
                            color="#0000ff",
                            popup=popup_text,
                            fill=True).add_to(FG_map)

    for index, row in B3.iterrows():
        popup_text = "School: {}<br> Address: {}<br> Tested: {}<br> Proficiency: {}<br> ELL%: {}"
        popup_text = popup_text.format(row["School"],row["Address"], row['Total_Tested'], row['Proficiency'], row['ELL%'])
        folium.CircleMarker(location=(row["Latitude"],row["Longitude"]),
                            radius=row['ELL%']/2,
                            color="#007849",
                            popup=popup_text,
                            fill=True).add_to(FG_map)

    for index, row in B2.iterrows():
        popup_text = "School: {}<br> Address: {}<br> Tested: {}<br> Proficiency: {}<br> ELL%: {}"
        popup_text = popup_text.format(row["School"],row["Address"], row['Total_Tested'], row['Proficiency'], row['ELL%'])
        folium.CircleMarker(location=(row["Latitude"],row["Longitude"]),
                            radius=row['ELL%']/2,
                            color="#E37222",
                            popup=popup_text,
                            fill=True).add_to(FG_map)

    for index, row in B1.iterrows():
        popup_text = "School: {}<br> Address: {}<br> Tested: {}<br> Proficiency: {}<br> ELL%: {}"
        popup_text = popup_text.format(row["School"],row["Address"], row['Total_Tested'], row['Proficiency'], row['ELL%'])
        folium.CircleMarker(location=(row["Latitude"],row["Longitude"]),
                            radius=row['ELL%']/2,
                            color="#ff0000",
                            popup=popup_text,
                            fill=True).add_to(FG_map)

    return FG_map

#SPED
def plot_School_SPED(Subject='Math'):
    Index =['School','Latitude','Longitude', 'Total_Tested','Proficiency','Address','Subject','Ranking','SPED%']

    FG_map = folium.Map(location=[44.958326, -93.122926], zoom_start=12,tiles="OpenStreetMap")

    B= School[(School['Subject'] == Subject)]
    B=B.query('School_Num not in (1581,1386)')
    B4=B.query('Ranking == 4')
    B3=B.query('Ranking == 3')
    B2=B.query('Ranking == 2')
    B1=B.query('Ranking == 1')

    print('This map displays 2019 {} Proficiency under normalized SPED%'.format(Subject))
    for index, row in B4.iterrows():
        popup_text = "School: {}<br> Address: {}<br> Tested: {}<br> Proficiency: {}<br> SPED%: {}"
        popup_text = popup_text.format(row["School"],row["Address"], row['Total_Tested'], row['Proficiency'], row['SPED%'])
        folium.CircleMarker(location=(row["Latitude"],row["Longitude"]),
                            radius=row['SPED%']/2,
                            color="#0000ff",
                            popup=popup_text,
                            fill=True).add_to(FG_map)

    for index, row in B3.iterrows():
        popup_text = "School: {}<br> Address: {}<br> Tested: {}<br> Proficiency: {}<br> SPED%: {}"
        popup_text = popup_text.format(row["School"],row["Address"], row['Total_Tested'], row['Proficiency'], row['SPED%'])
        folium.CircleMarker(location=(row["Latitude"],row["Longitude"]),
                            radius=row['SPED%']/2,
                            color="#007849",
                            popup=popup_text,
                            fill=True).add_to(FG_map)

    for index, row in B2.iterrows():
        popup_text = "School: {}<br> Address: {}<br> Tested: {}<br> Proficiency: {}<br> SPED%: {}"
        popup_text = popup_text.format(row["School"],row["Address"], row['Total_Tested'], row['Proficiency'], row['SPED%'])
        folium.CircleMarker(location=(row["Latitude"],row["Longitude"]),
                            radius=row['SPED%']/2,
                            color="#E37222",
                            popup=popup_text,
                            fill=True).add_to(FG_map)

    for index, row in B1.iterrows():
        popup_text = "School: {}<br> Address: {}<br> Tested: {}<br> Proficiency: {}<br> SPED%: {}"
        popup_text = popup_text.format(row["School"],row["Address"], row['Total_Tested'], row['Proficiency'], row['SPED%'])
        folium.CircleMarker(location=(row["Latitude"],row["Longitude"]),
                            radius=row['SPED%']/2,
                            color="#ff0000",
                            popup=popup_text,
                            fill=True).add_to(FG_map)

    return FG_map


#FRPL
def plot_School_FRPL(Subject='Math'):
    Index =['School','Latitude','Longitude', 'Total_Tested','Proficiency','Address','Subject','Ranking','FRPL%']

    FG_map = folium.Map(location=[44.958326, -93.122926], zoom_start=12,tiles="OpenStreetMap")

    B= School[(School['Subject'] == Subject)]
    B=B.query('School_Num not in (1581,1386)')
    B4=B.query('Ranking == 4')
    B3=B.query('Ranking == 3')
    B2=B.query('Ranking == 2')
    B1=B.query('Ranking == 1')

    print('This map displays 2019 {} Proficiency under normalized FRPL%'.format(Subject))
    for index, row in B4.iterrows():
        popup_text = "School: {}<br> Address: {}<br> Tested: {}<br> Proficiency: {}<br> FRPL%: {}"
        popup_text = popup_text.format(row["School"],row["Address"], row['Total_Tested'], row['Proficiency'], row['FRPL%'])
        folium.CircleMarker(location=(row["Latitude"],row["Longitude"]),
                            radius=row['FRPL%']/2,
                            color="#0000ff",
                            popup=popup_text,
                            fill=True).add_to(FG_map)

    for index, row in B3.iterrows():
        popup_text = "School: {}<br> Address: {}<br> Tested: {}<br> Proficiency: {}<br> FRPL%: {}"
        popup_text = popup_text.format(row["School"],row["Address"], row['Total_Tested'], row['Proficiency'], row['FRPL%'])
        folium.CircleMarker(location=(row["Latitude"],row["Longitude"]),
                            radius=row['FRPL%']/2,
                            color="#007849",
                            popup=popup_text,
                            fill=True).add_to(FG_map)

    for index, row in B2.iterrows():
        popup_text = "School: {}<br> Address: {}<br> Tested: {}<br> Proficiency: {}<br> FRPL%: {}"
        popup_text = popup_text.format(row["School"],row["Address"], row['Total_Tested'], row['Proficiency'], row['FRPL%'])
        folium.CircleMarker(location=(row["Latitude"],row["Longitude"]),
                            radius=row['FRPL%']/2,
                            color="#E37222",
                            popup=popup_text,
                            fill=True).add_to(FG_map)

    for index, row in B1.iterrows():
        popup_text = "School: {}<br> Address: {}<br> Tested: {}<br> Proficiency: {}<br> FRPL%: {}"
        popup_text = popup_text.format(row["School"],row["Address"], row['Total_Tested'], row['Proficiency'], row['FRPL%'])
        folium.CircleMarker(location=(row["Latitude"],row["Longitude"]),
                            radius=row['FRPL%']/2,
                            color="#ff0000",
                            popup=popup_text,
                            fill=True).add_to(FG_map)

    return FG_map
plot_School_FRPL()
This map displays 2019 Math Proficiency under normalized FRPL%
B=School[(School['Subject'] == 'Science')]

B=B.query('School_Num not in (1581,1386)')
B4=B.query('Ranking == 4')
B3=B.query('Ranking == 3')
B2=B.query('Ranking == 2')
B1=B.query('Ranking == 1')

B1
| School | School_Num | Grade | Total_Tested | Proficiency | White% | Asian% | Black% | ELL% | SPED% | FRPL% | Ranking | Address | Latitude | Longitude | Subject | |
|---|---|---|---|---|---|---|---|---|---|---|---|---|---|---|---|---|
| 108 | Battle Creek Middle | 310.0 | 8.0 | 235.0 | 12.34 | 5.0 | 40.0 | 35.0 | 35.0 | 15.0 | 75.0 | 1.0 | 2121 N Park Dr, St Paul, MN 55119 | 44.945684 | -93.011786 | Science |
| 109 | Benjamin E Mays Magnet | 424.0 | 5.0 | 65.0 | 9.23 | 0.0 | 11.0 | 68.0 | 12.0 | 17.0 | 82.0 | 1.0 | 560 Concordia Ave, St Paul, MN 55103 | 44.950302 | -93.122300 | Science |
| 110 | Bruce F Vento Elementary | 449.0 | 5.0 | 83.0 | 14.46 | 2.0 | 47.0 | 31.0 | 33.0 | 16.0 | 94.0 | 1.0 | 409 Case Ave E, St Paul, MN 55130 | 44.970897 | -93.082901 | Science |
| 112 | Cherokee Heights Elementary School | 428.0 | 5.0 | 27.0 | 14.81 | 11.0 | 4.0 | 30.0 | 22.0 | 15.0 | 85.0 | 1.0 | 694 S Charlton St, St Paul, MN 55107 | 44.925156 | -93.095431 | Science |
| 114 | Creative Arts Secondary School | 211.0 | 8.0 | 49.0 | 20.41 | 20.0 | 18.0 | 33.0 | 8.0 | 10.0 | 61.0 | 1.0 | 65 E Kellogg Blvd, St Paul, MN 55101 | 44.945128 | -93.090919 | Science |
| 116 | Crossroads Science Program | 466.0 | 5.0 | 49.0 | 20.41 | 6.0 | 24.0 | 51.0 | 16.0 | 16.0 | 86.0 | 1.0 | 543 Front Ave, St Paul, MN 55117 | 44.970910 | -93.122748 | Science |
| 117 | Daytons Bluff Elementary | 433.0 | 5.0 | 47.0 | 10.64 | 4.0 | 21.0 | 53.0 | 23.0 | 17.0 | 87.0 | 1.0 | 262 Bates Ave, St Paul, MN 55106 | 44.954667 | -93.066688 | Science |
| 118 | Eastern Heights Elementary | 452.0 | 5.0 | 50.0 | 20.00 | 14.0 | 38.0 | 16.0 | 38.0 | 26.0 | 76.0 | 1.0 | 2001 Margaret St, St Paul, MN 55119 | 44.961587 | -93.016614 | Science |
| 120 | Four Seasons Elementary | 460.0 | 5.0 | 75.0 | 10.67 | 12.0 | 16.0 | 49.0 | 40.0 | 20.0 | 81.0 | 1.0 | 318 N Moore St, St Paul, MN 55104 | 44.950437 | -93.183536 | Science |
| 121 | Frost Lake Elementary School | 464.0 | 5.0 | 79.0 | 16.46 | 10.0 | 39.0 | 30.0 | 34.0 | 24.0 | 84.0 | 1.0 | 1505 Hoyt Ave E, St Paul, MN 55106 | 44.988560 | -93.036775 | Science |
| 122 | Galtier Elementary School | 467.0 | 5.0 | 22.0 | 0.00 | 18.0 | 14.0 | 45.0 | 23.0 | 23.0 | 77.0 | 1.0 | 1317 Charles Ave, St Paul, MN 55104 | 44.957900 | -93.156079 | Science |
| 124 | Hamline Elementary School | 482.0 | 5.0 | 44.0 | 20.45 | 14.0 | 11.0 | 57.0 | 18.0 | 14.0 | 68.0 | 1.0 | 1599 Englewood Ave, St Paul, MN 55104 | 44.964668 | -93.168084 | Science |
| 127 | Highwood Hills Elementary | 496.0 | 5.0 | 36.0 | 11.11 | 8.0 | 25.0 | 53.0 | 28.0 | 19.0 | 94.0 | 1.0 | 2188 Londin Ln E, St Paul, MN 55119 | 44.929363 | -93.008086 | Science |
| 129 | Humboldt High School | 225.0 | 8.0 | 154.0 | 5.19 | 6.0 | 47.0 | 27.0 | 52.0 | 12.0 | 86.0 | 1.0 | 30 Baker St E, St Paul, MN 55107 | 44.925973 | -93.084077 | Science |
| 130 | Jackson Preparatory Elementary | 500.0 | 5.0 | 51.0 | 21.57 | 2.0 | 51.0 | 31.0 | 43.0 | 12.0 | 88.0 | 1.0 | 437 Edmund Ave W, St Paul, MN 55103 | 44.958794 | -93.118125 | Science |
| 133 | John A. Johnson Achievement Plus El. | 415.0 | 5.0 | 54.0 | 18.52 | 7.0 | 28.0 | 33.0 | 28.0 | 17.0 | 89.0 | 1.0 | 740 York Ave, St Paul, MN 55106 | 44.968026 | -93.068801 | Science |
| 135 | Maxfield Elementary School | 524.0 | 5.0 | 40.0 | 7.50 | 8.0 | 5.0 | 78.0 | 2.0 | 10.0 | 78.0 | 1.0 | 380 N Victoria St, St Paul, MN 55104 | 44.952617 | -93.135536 | Science |
| 136 | Mississippi Creative Arts Elementary | 527.0 | 5.0 | 79.0 | 18.99 | 8.0 | 48.0 | 27.0 | 39.0 | 19.0 | 86.0 | 1.0 | 1575 L'Orient St, St Paul, MN 55117 | 44.988831 | -93.090887 | Science |
| 140 | Obama Service Learning Elementary | 578.0 | 5.0 | 46.0 | 4.35 | 2.0 | 11.0 | 70.0 | 11.0 | 22.0 | 96.0 | 1.0 | 707 Holly Ave, St Paul, MN 55104 | 44.943603 | -93.130054 | Science |
| 142 | Parkway Montessori/Community Middle | 344.0 | 8.0 | 128.0 | 15.62 | 16.0 | 51.0 | 19.0 | 27.0 | 15.0 | 77.0 | 1.0 | 1363 Bush Ave, St Paul, MN 55106 | 44.965483 | -93.042832 | Science |
| 143 | Paul & Sheila Wellstone Elementary | 552.0 | 5.0 | 94.0 | 18.09 | 2.0 | 16.0 | 14.0 | 44.0 | 19.0 | 83.0 | 1.0 | 1041 Marion St, St Paul, MN 55117 | 44.972856 | -93.110499 | Science |
| 144 | Phalen Lake Hmong Studies Magnet | 541.0 | 5.0 | 97.0 | 17.53 | 1.0 | 85.0 | 5.0 | 54.0 | 9.0 | 85.0 | 1.0 | 1089 N Cypress St, St Paul, MN 55106 | 44.973861 | -93.059345 | Science |
| 147 | Riverview West School Of Excellence | 551.0 | 5.0 | 50.0 | 8.00 | 2.0 | 2.0 | 26.0 | 40.0 | 10.0 | 72.0 | 1.0 | 160 Isabel St E, St Paul, MN 55107 | 44.932803 | -93.076796 | Science |
| 148 | Saint Paul Music Academy | 558.0 | 5.0 | 110.0 | 11.82 | 5.0 | 55.0 | 24.0 | 47.0 | 21.0 | 93.0 | 1.0 | 27 Geranium Ave E, St Paul, MN 55117 | 44.976042 | -93.100194 | Science |
| 150 | The Heights Community School | 488.0 | 5.0 | 69.0 | 10.14 | 10.0 | 33.0 | 26.0 | 26.0 | 12.0 | 67.0 | 1.0 | 1863 Clear Ave E, St Paul, MN 55119 | 44.982388 | -93.020926 | Science |
| 151 | Washington Tech Secondary Magnet | 252.0 | 8.0 | 302.0 | 13.25 | 6.0 | 53.0 | 26.0 | 46.0 | 10.0 | 89.0 | 1.0 | 1495 Rice St, St Paul, MN 55117 | 44.987037 | -93.111372 | Science |