
Table of contents 
Brief Introduction 
In this report, I will be using Minnesota Voting Data/Records to show insight on the 2019 Saint Paul city council elections. As part of the Saint Paul Open-Data Project, the coding will be accessible to everyone. This is only a data report, the qualitative and solution portion was excluded so readers can come up with their own conclusions. The data workbook can be viewed here.
The first report focused on the election result, this report will be providing additional insight on general voter pattern. There is a few new reporting tools that I explored that were different than the past.
- Data Analysis [Informational]: Include voting rate for different elections, Ward analysis, Youth voter rate, and Precinct analysis, Etymology Analysis
Disclaimer: I ran for Saint Paul city council for Ward 1 (election on November 5th, 2019).
Saint Paul Open Data Initiative 
This initiative focuses on taking public information/data from municipalities and organizations to create interactive reports and analysis to better inform and assist community members to take action. This is an open-source project meaning that all coding is accessible to everyone, and thus there is transparency on the results. It is currently all python-based. As always, I encourage other programmers and developers to participate in making this more accessible. You can learn more information on the project Github page as well as accessing documents.
Unlike my previous reports, the Minnesota voting records is not publicly available, but is publicly accessible. I will not provide the raw data on the project page as it contains sensitive personal information, you can contact the Minnesota Secretary of State for the voting records here, which also includes the columns provided.
If you use any material/graphs from the report, please give credit to me and the project
Reader's Note 
There are a few questions that I want you to consider when reviewing the data analysis:
- Why does our local elections matter?
- Was their any demographic shifts?
Section I: Data Analysis 
About the Data: 
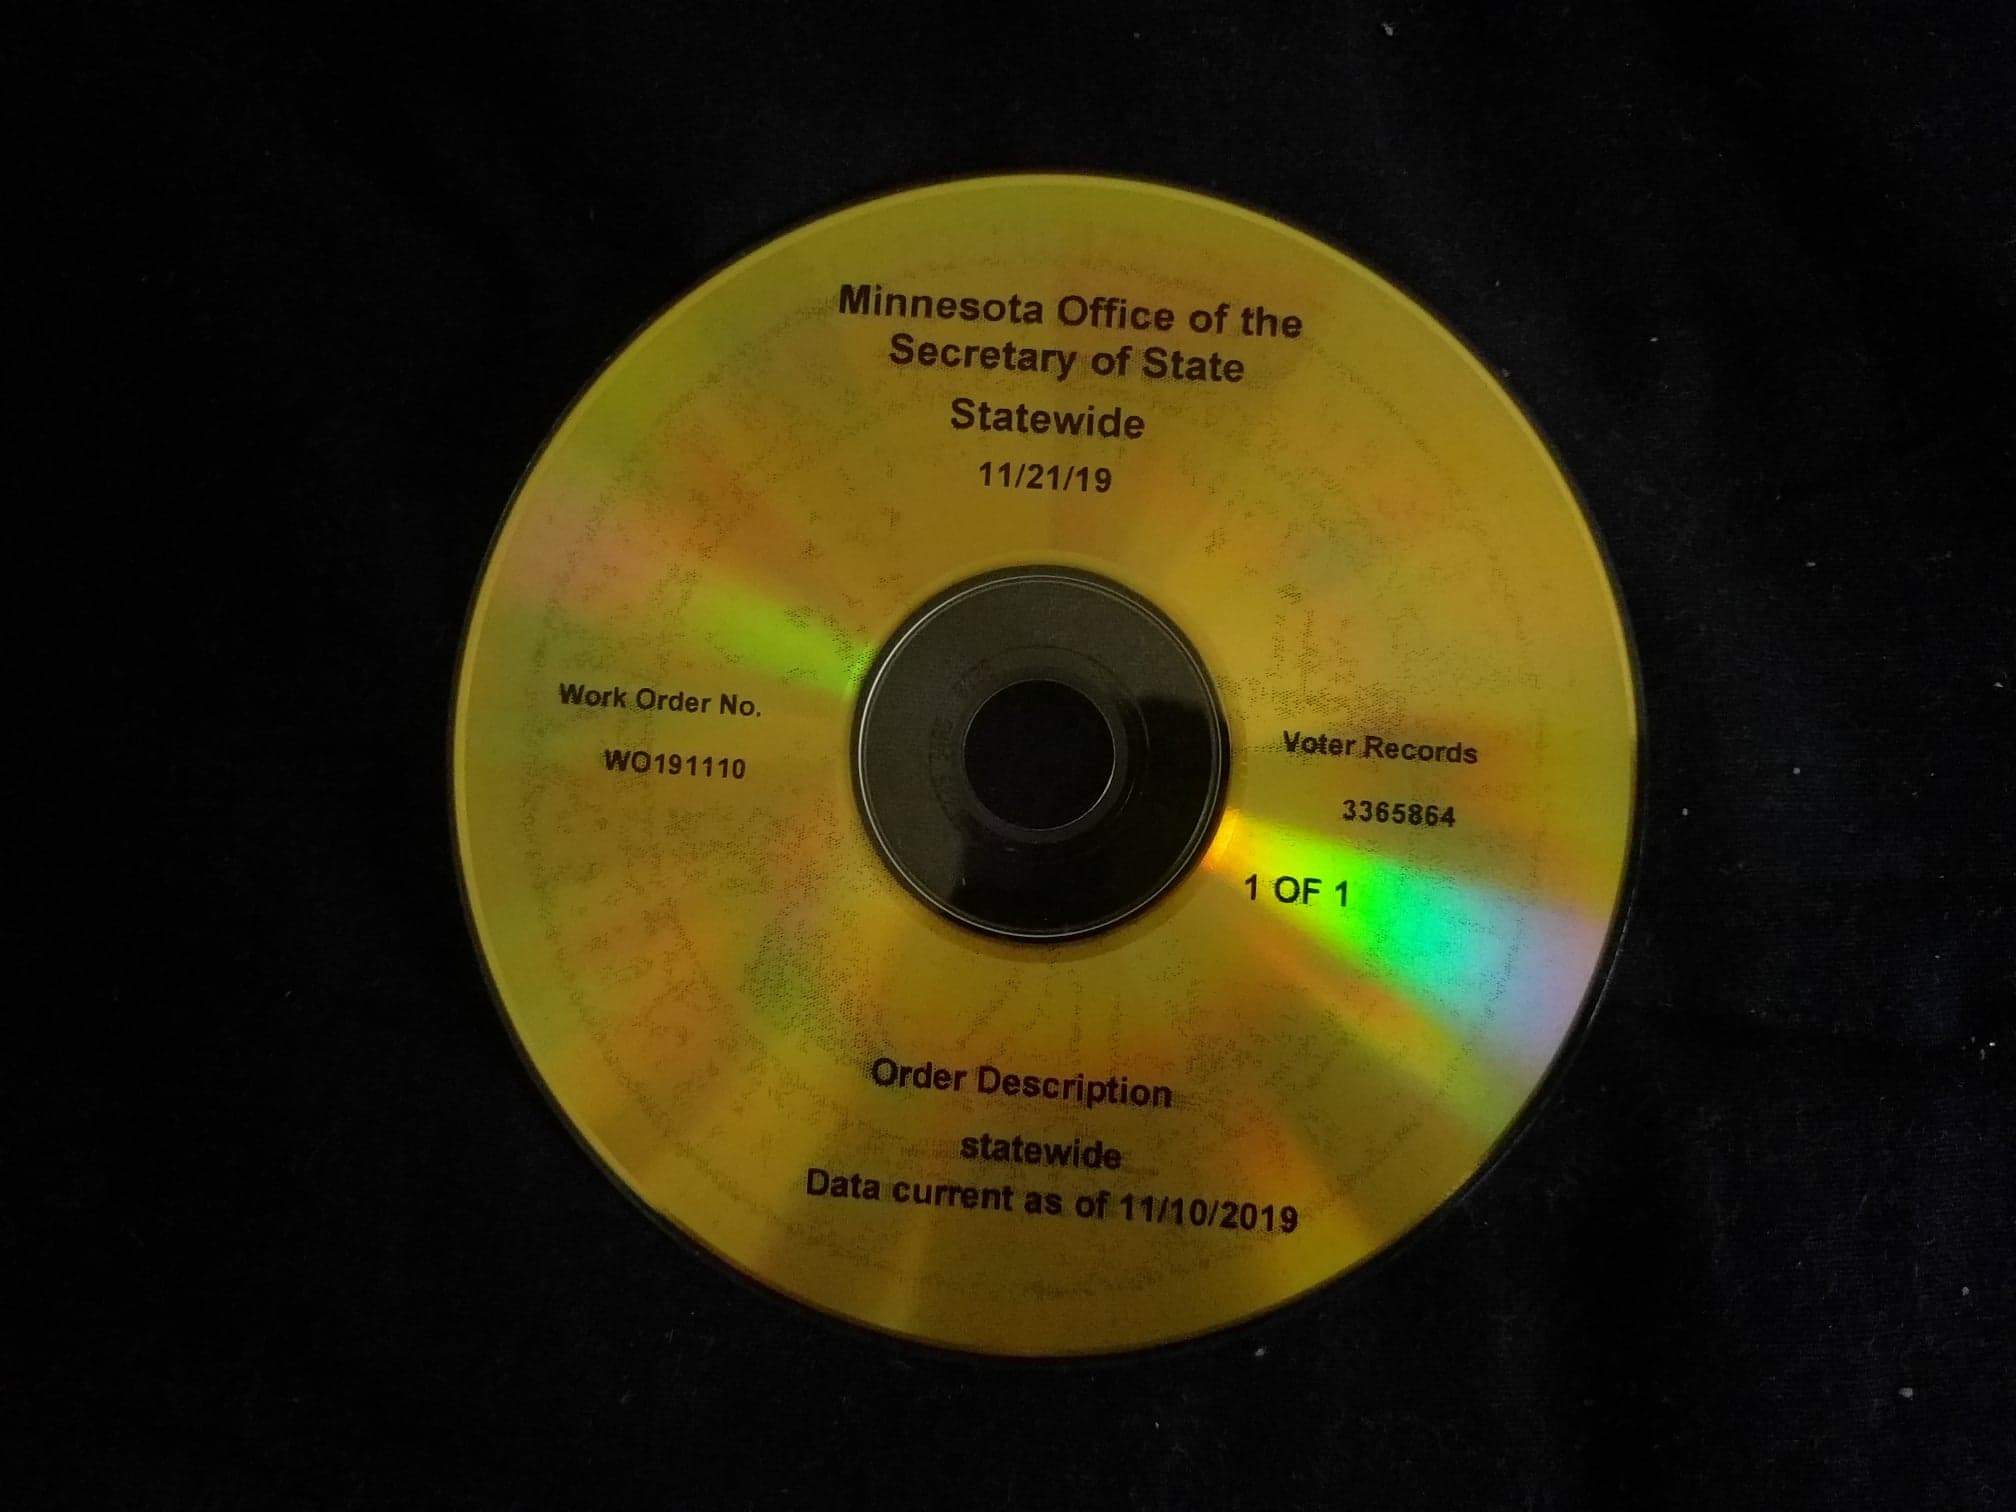
The data is taken from Minnesota voting records and the data was current of 11/10/2019 as indicated in the picture below. There are two datasets in the CD: Voter profile and Voting Records. This is the bare basic voting information obtained from the state that it is utilized by most campaigns. You can view the full data workbook here. In addition, I got geojson file for my map here Note: there is missing election data for voters in Ward 2-Precinct 5 & Ward 3- Precinct 13.
Background:
As a Saint Paul resident, I am represented by different layers of governance, whom I can vote for during an election. The layers of governance can be broken down into four categories: Federal, State, County, and Local. Only the local city election occur during the odd calendar years. The other government roles have the elections on even years and the available open seats are staggered. In Saint Paul, the city council elections shares the staggered term of the school board. The Saint Paul City Council member term is four years and is not staggered. In contrast, the sister city, Minneapolis, has the mayoral and city council election occurs at the same time calendar year.
Data Assumptions: 
Assumptions: The raw data contains the records of registered voters, so there might be some voters whom that have not registered within and/or outside Saint Paul. In addition, some voters may likely be deceased (i.e. there are 120 year olds), and their voter information has not been removed from the records. In both cases, the numbers are negligible and substantial data cleaning is unnecessary for this report. You can see the full python workbook for all the tables and charts here
Methodology:
Time Sensitivity on Registered Voters: It is sensitive to time, especially within the last three years. Time sensitivity is less for older populations as there is numerous years giving accurate number on the total potentional registered voters. It is recommended to do a youth analysis, after at least one major federal/state elections
Finding the approximate age of registered voters: For each registered voter, the year for date of birth was provided, which was used to determine their relative age. The actual age is important for 18 year olds, as they are not able to vote if they turn 18 after a general election, so they have 1/6 less representation
Finding the number of potential registered voters at a given election year: This is done through a post-hoc method where I take the voter registration of succeeding elections to determine the number of people in the age group that could have voted. This is similar to the time sensitivity
Age/Voter Demographics: 
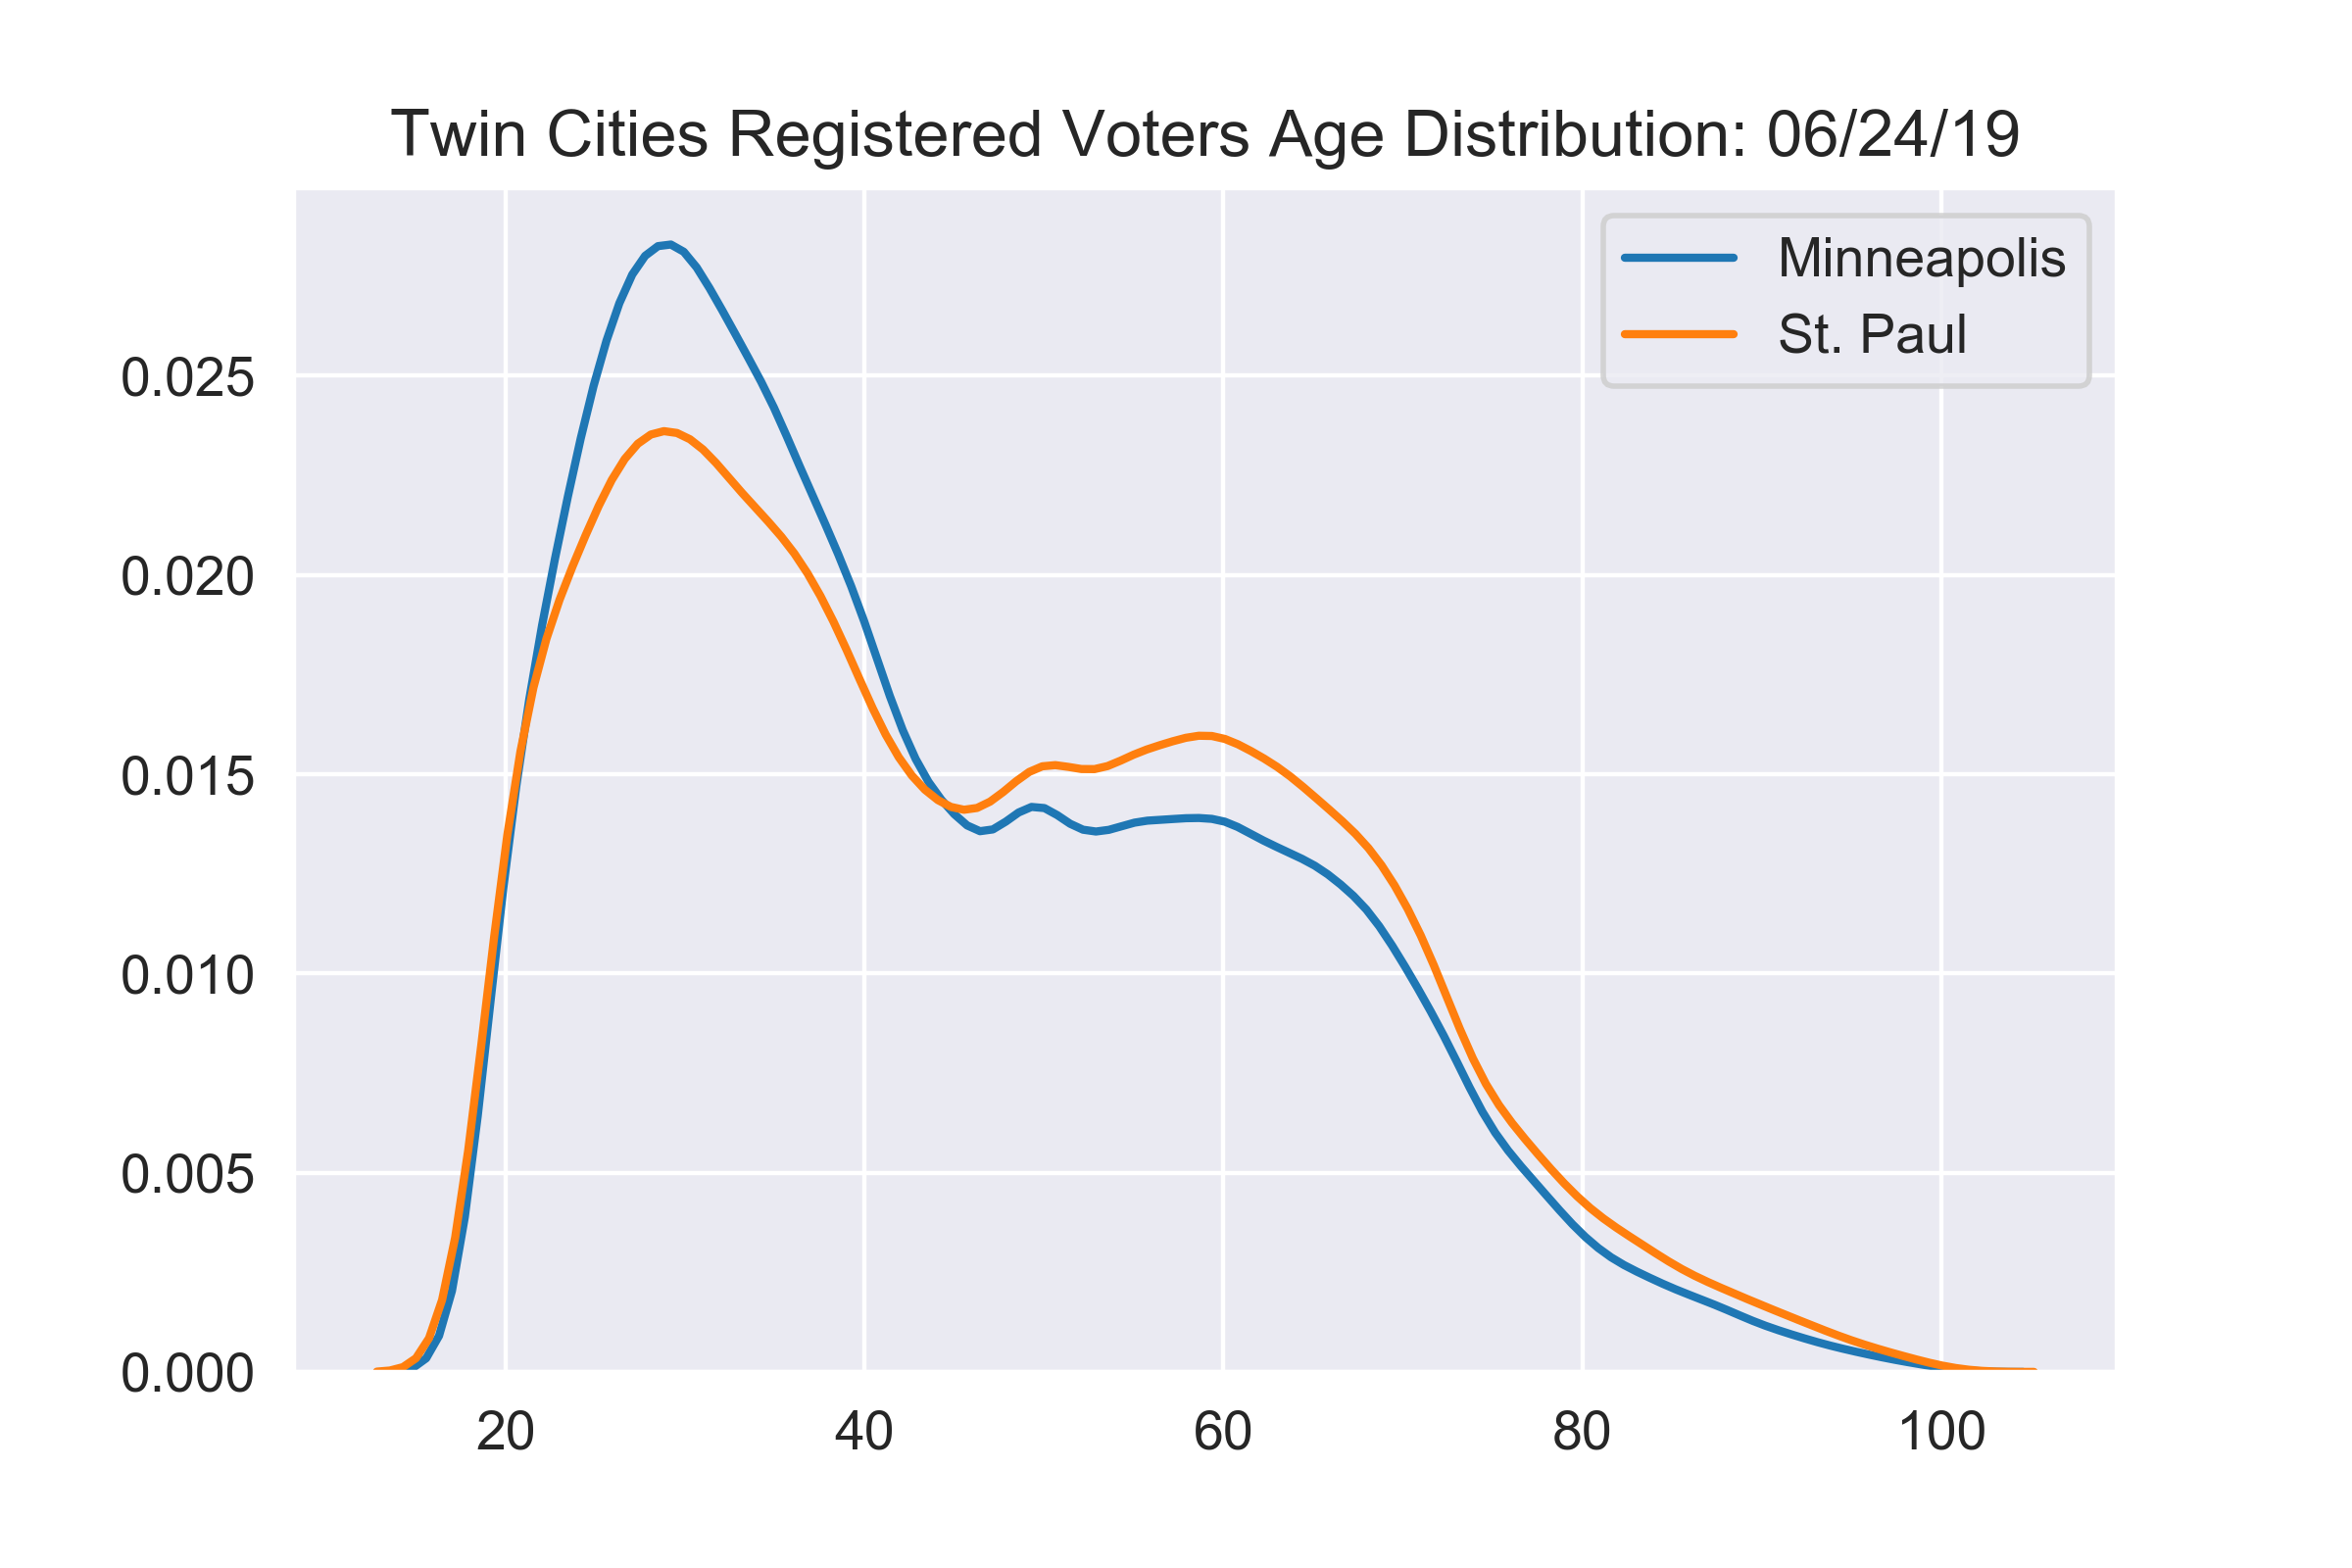
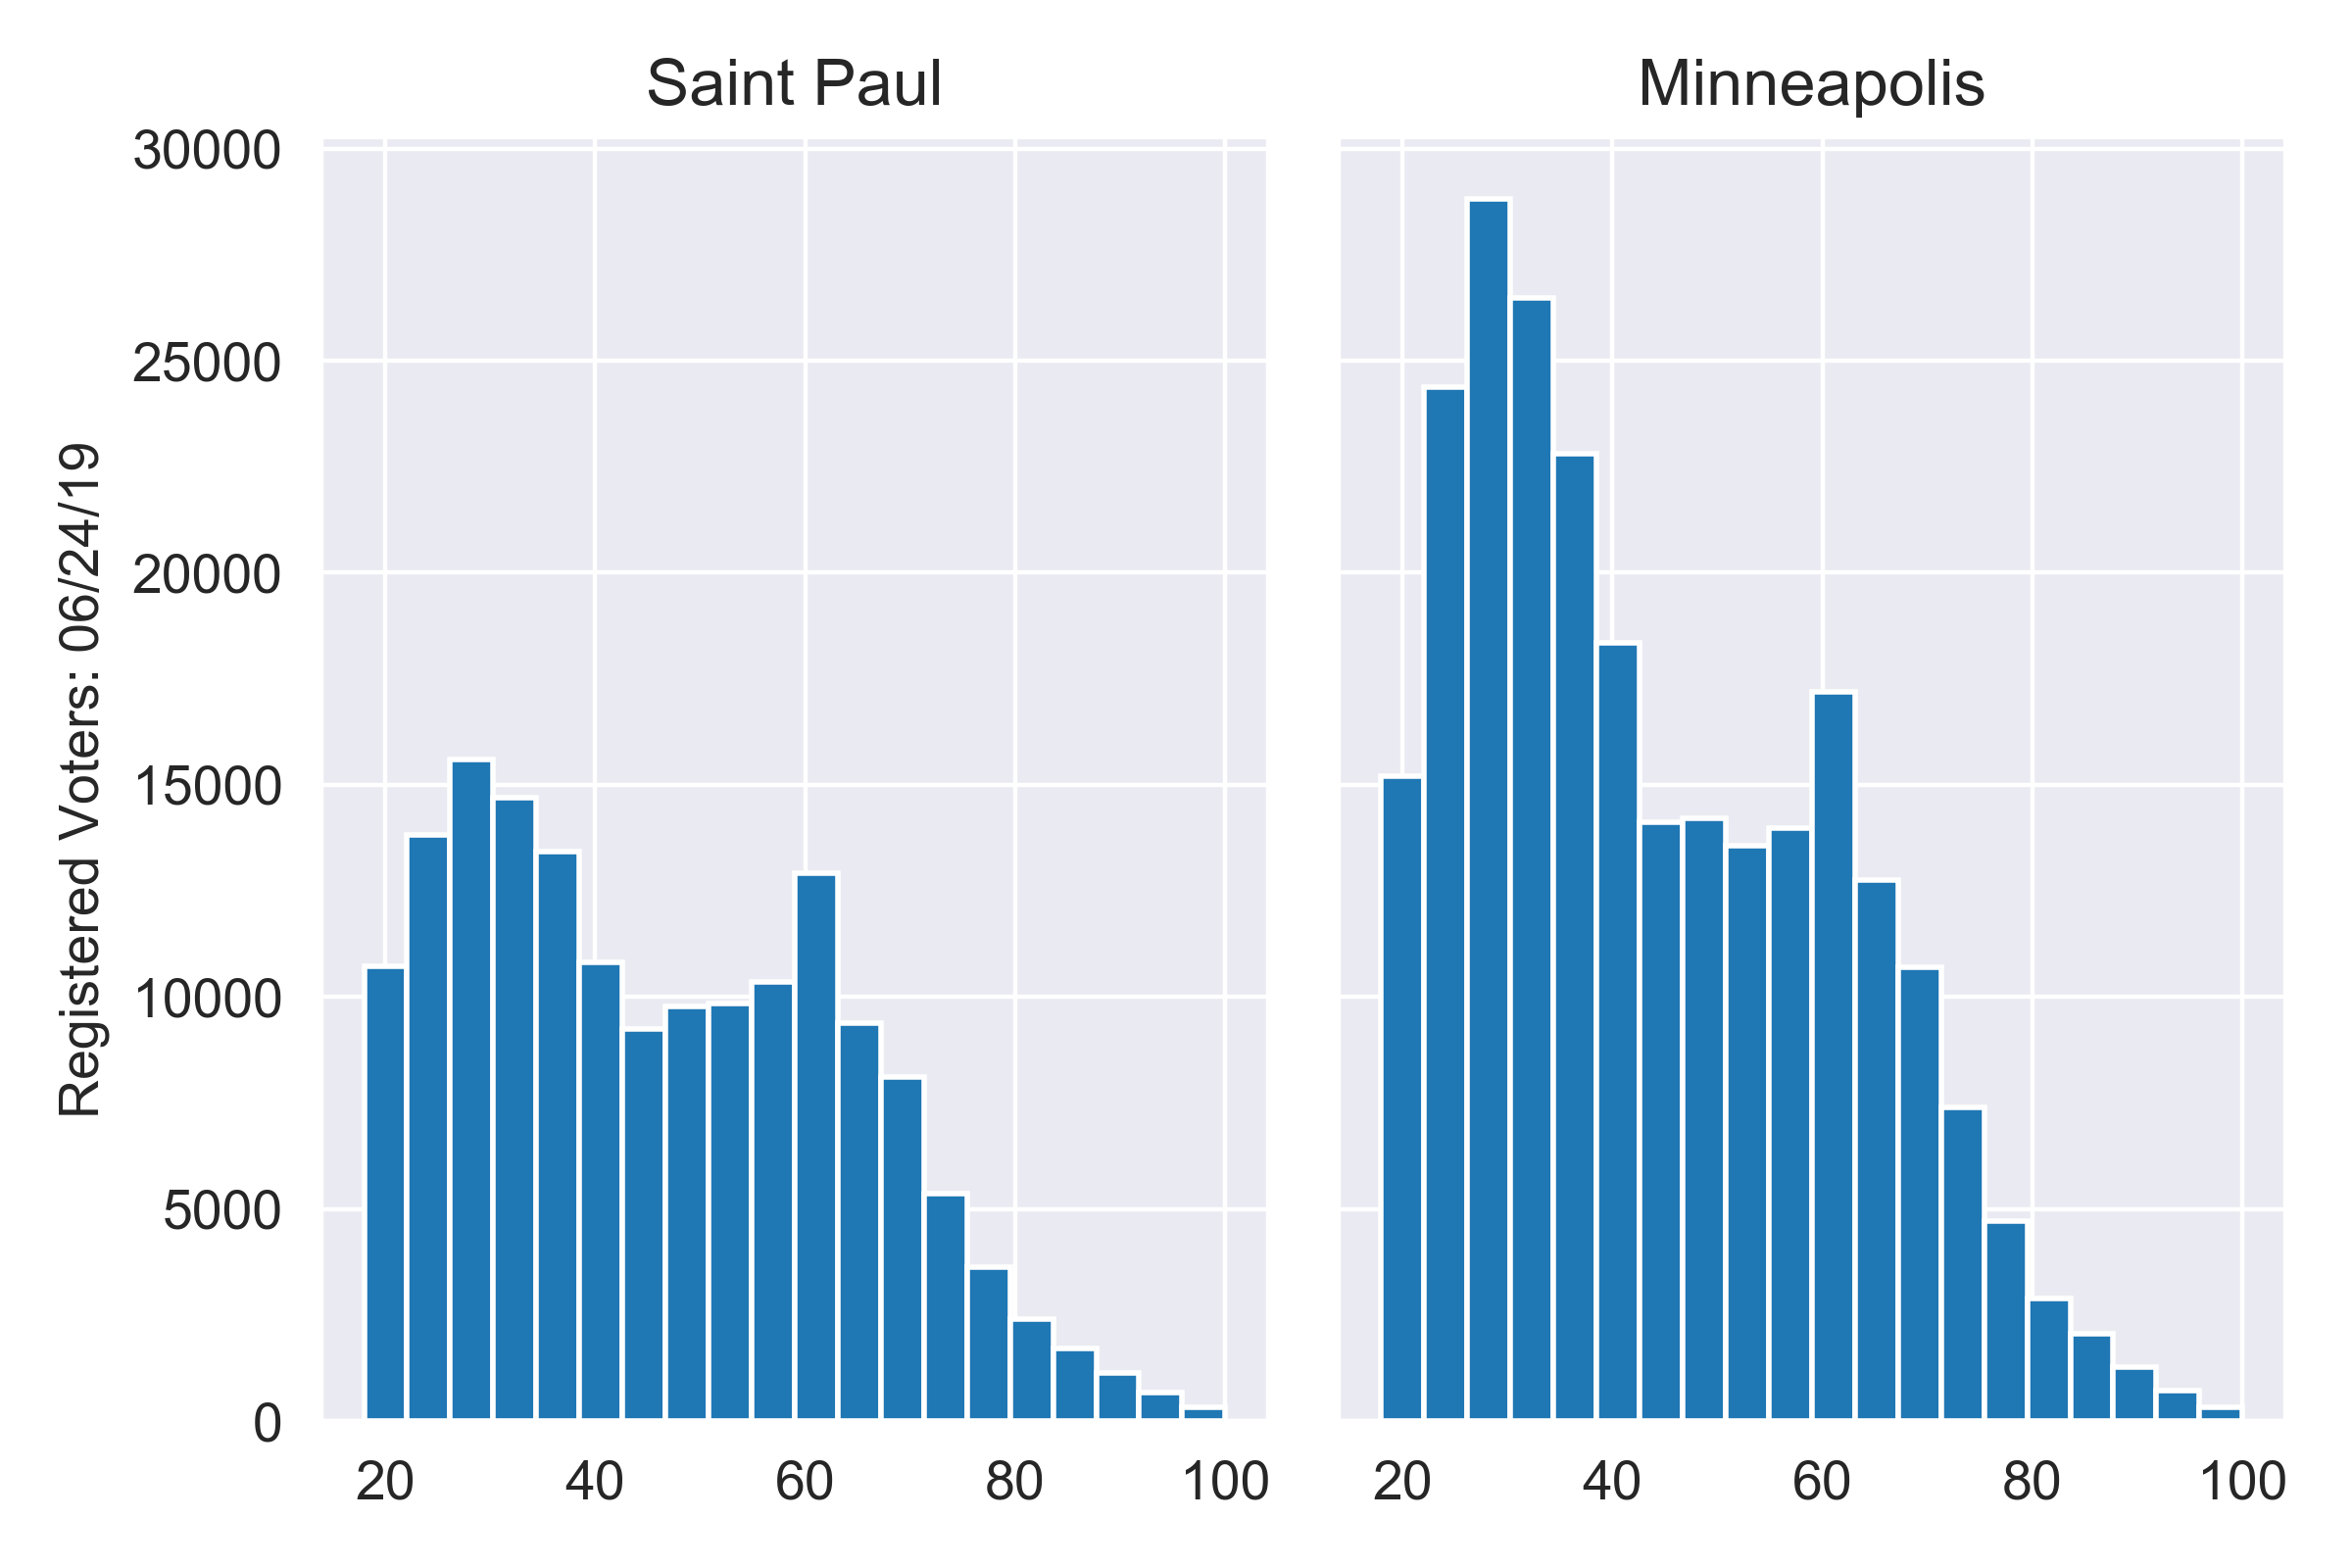
First, let’s explore the age demographic relationship between Saint Paul and Minneapolis as these two cities are closely connected. From the plots below, we see that Minneapolis has greater concentration of younger voters than Saint Paul, and the total number of voters are higher in general. For both cities, the younger adults make up the bulk of voting population.
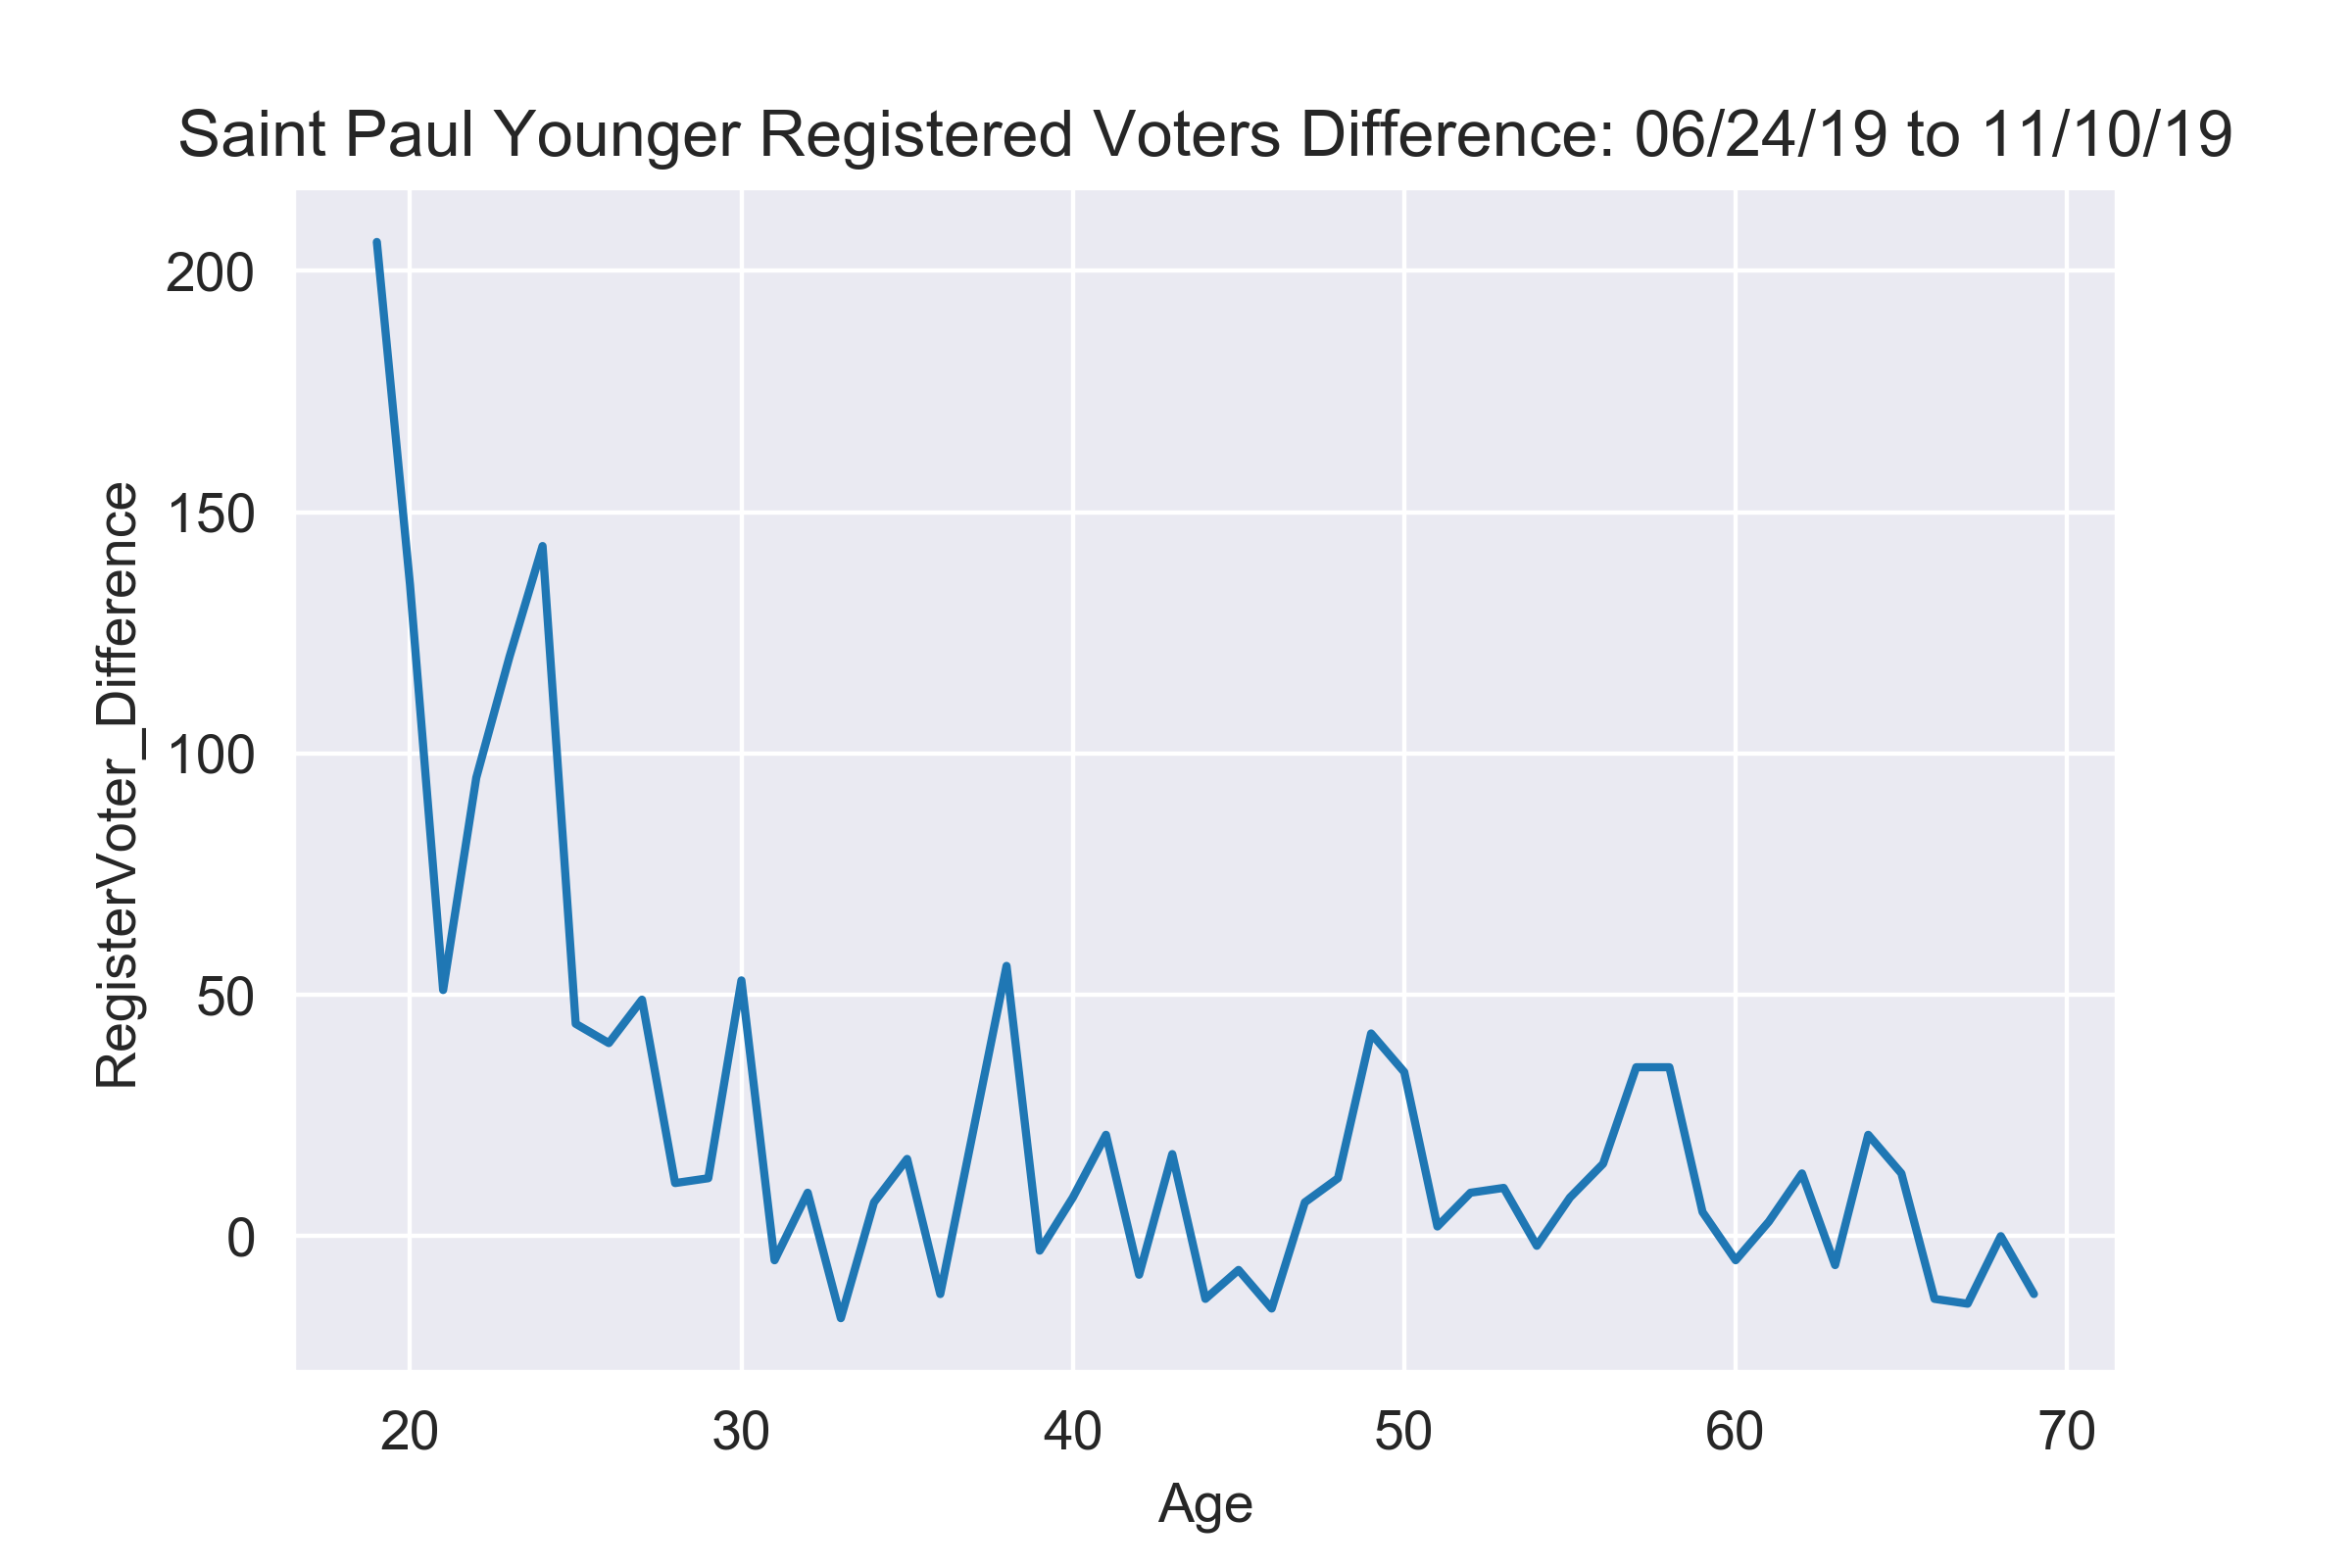
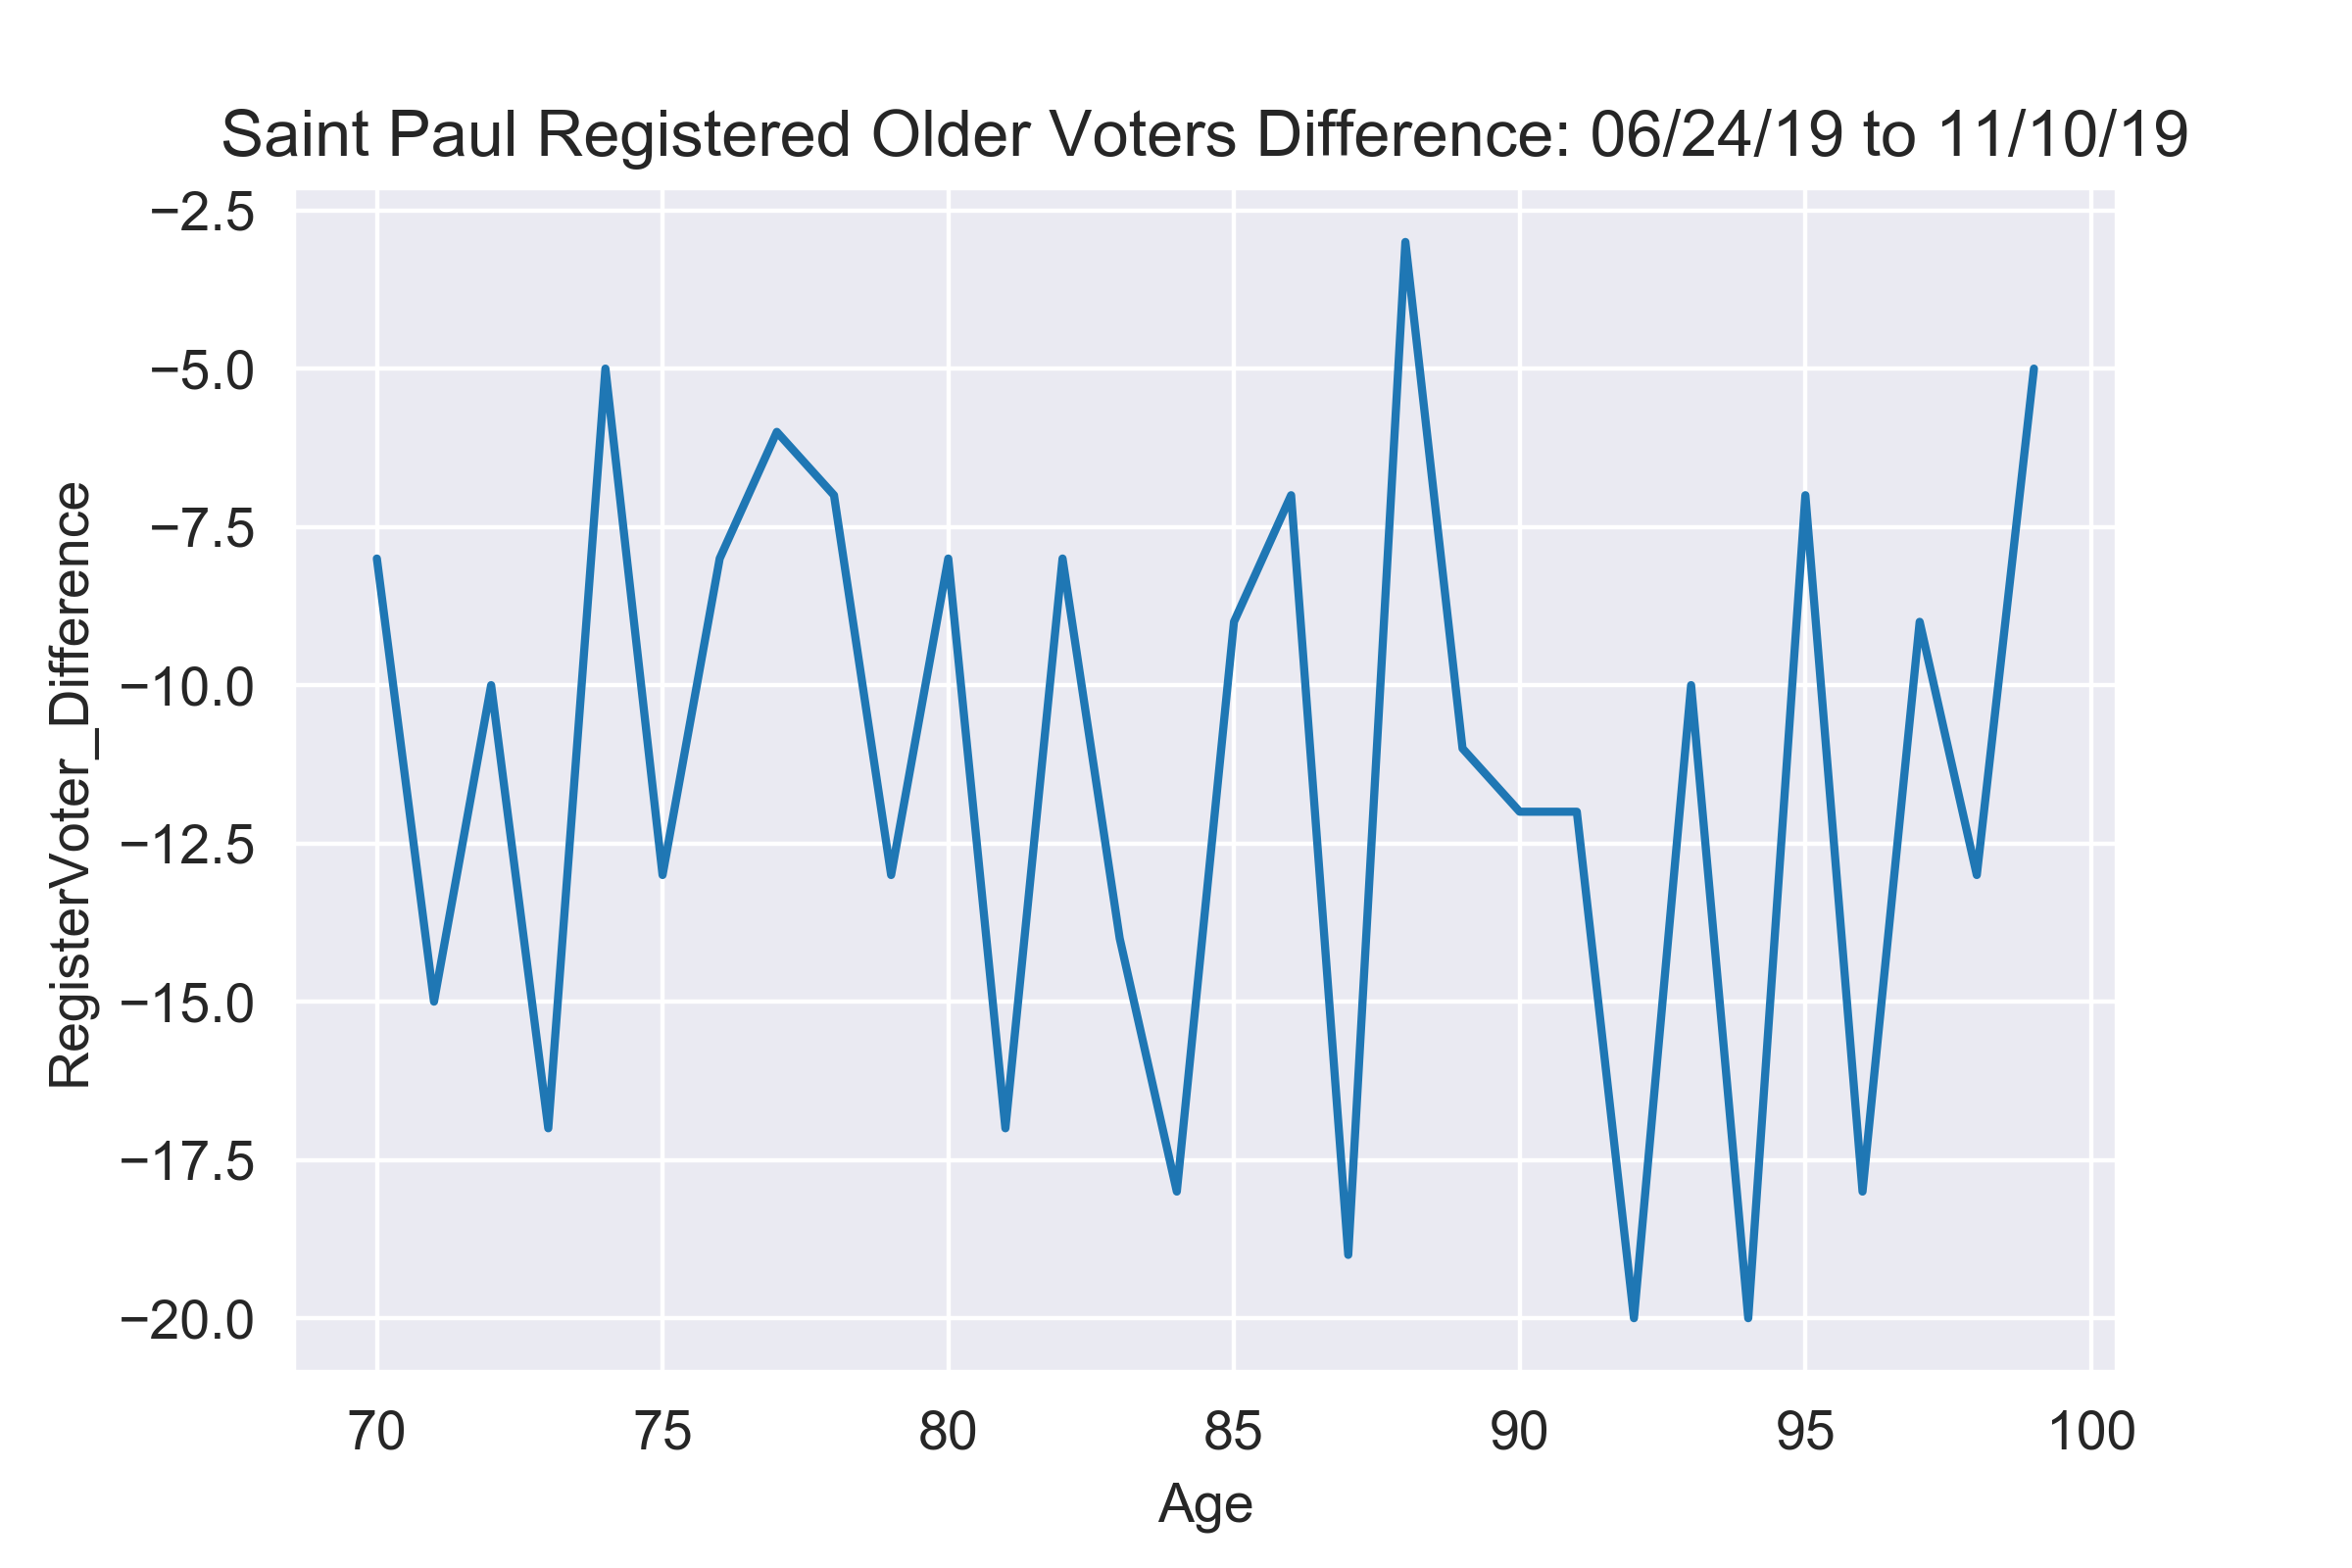
New Voter Registration from 06/24/19 to 11/29/19
From the graphs below we see that this election had increase number of registered voters for younger population and decrease for older people. One possibility for this is that old people are leaving their homes, and replace with younger population
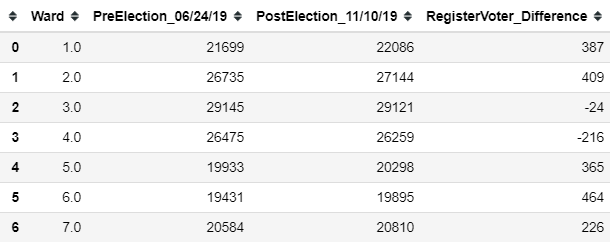
The table below shows the voter registry for the Wards, why Ward 4 had a drastic decrease in registry is interesting.
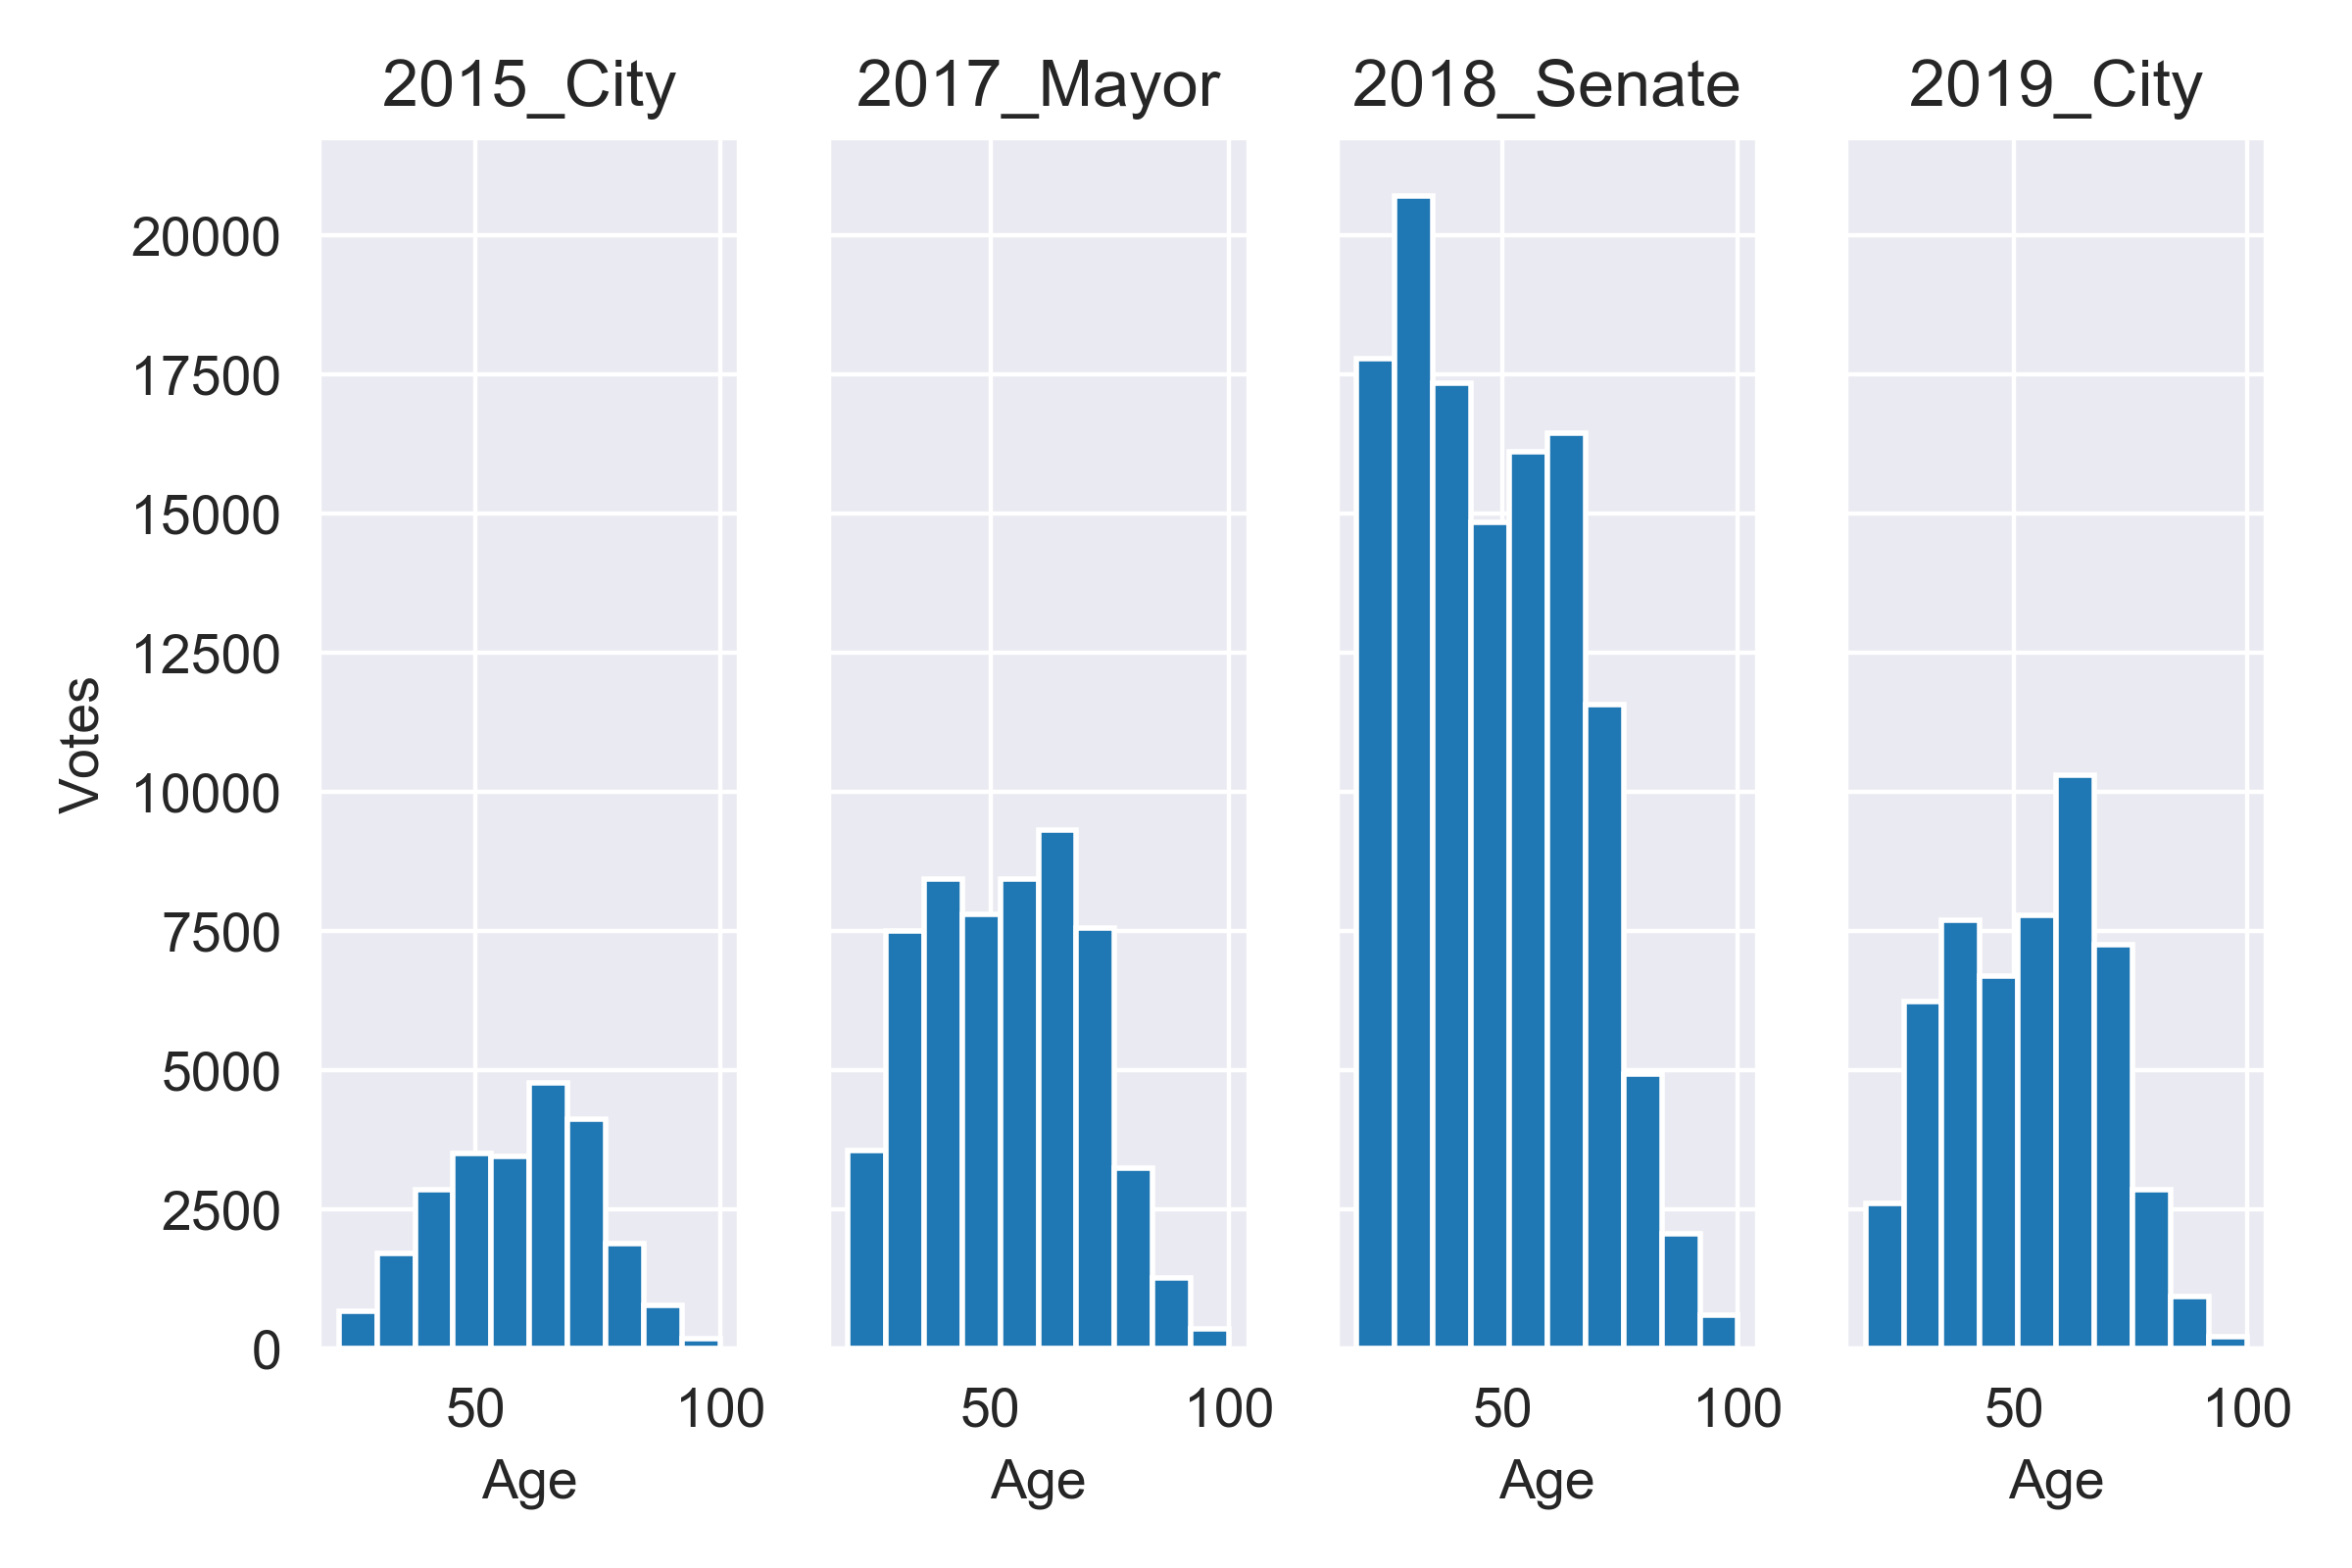
Voting Trends: 
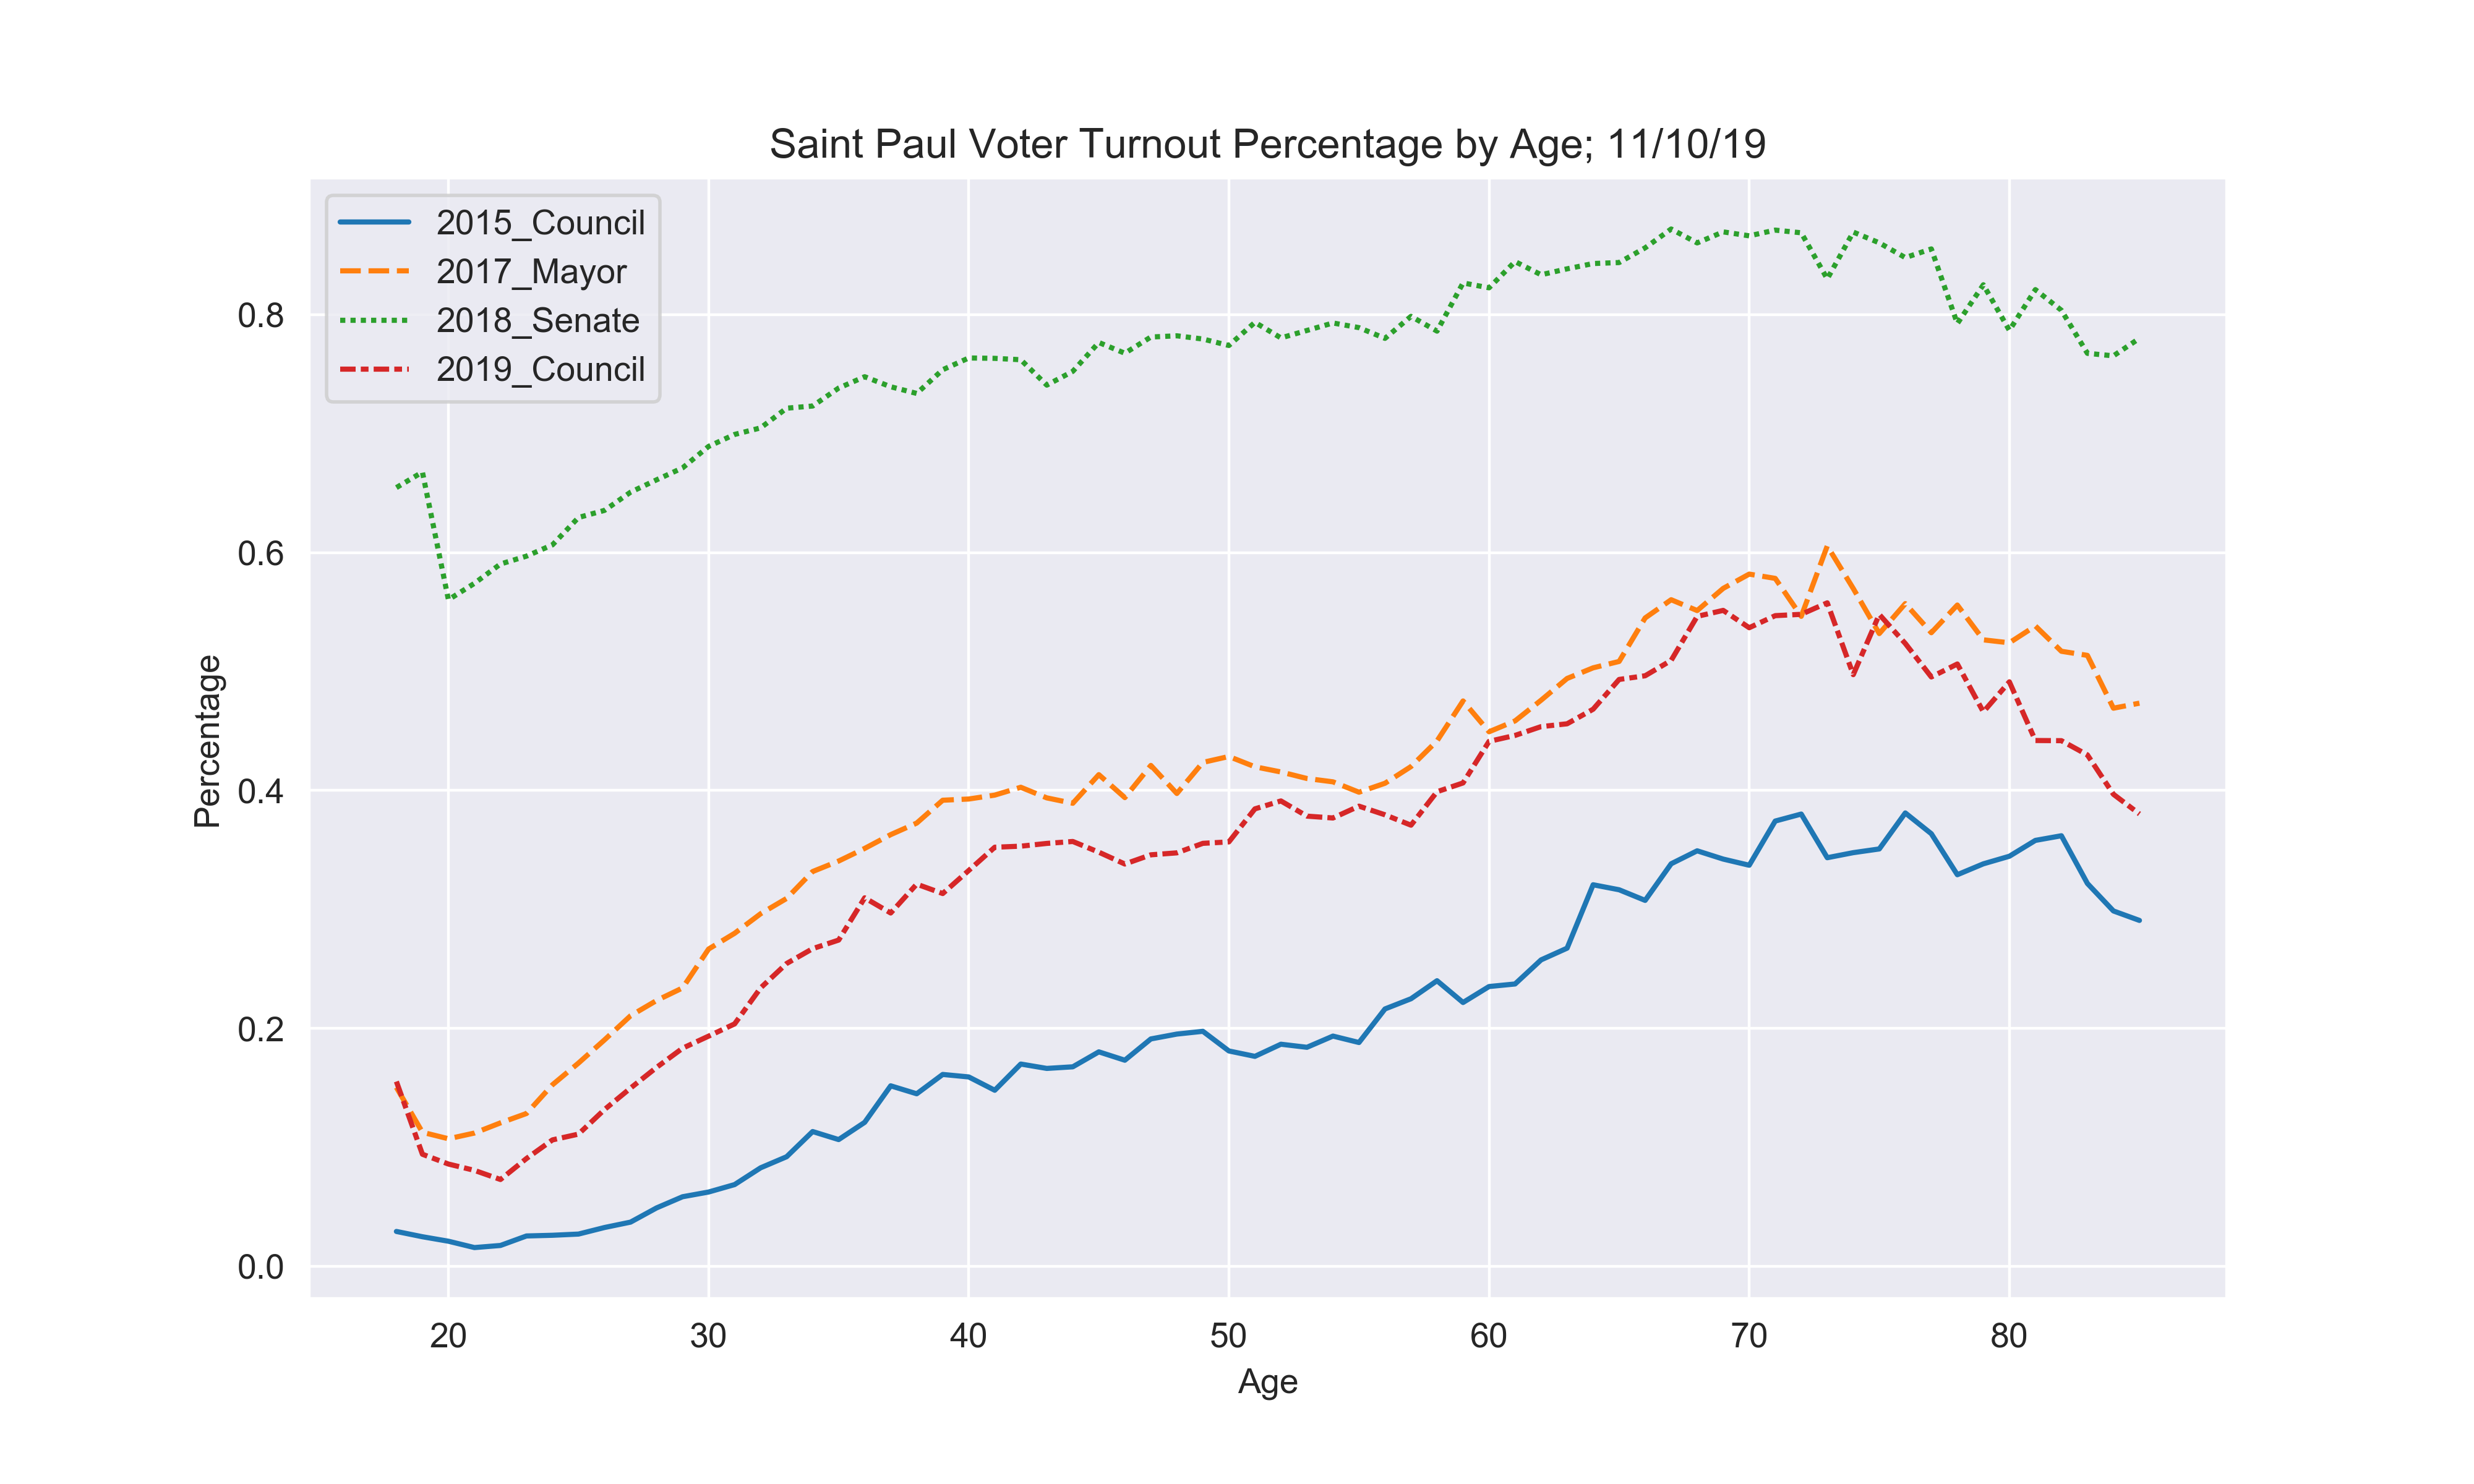
Local elections tend to have low turnout. Notice that 2019 city council elections mirrors that of the Mayor's election of 2017, but with greater proportion of older voters voting.
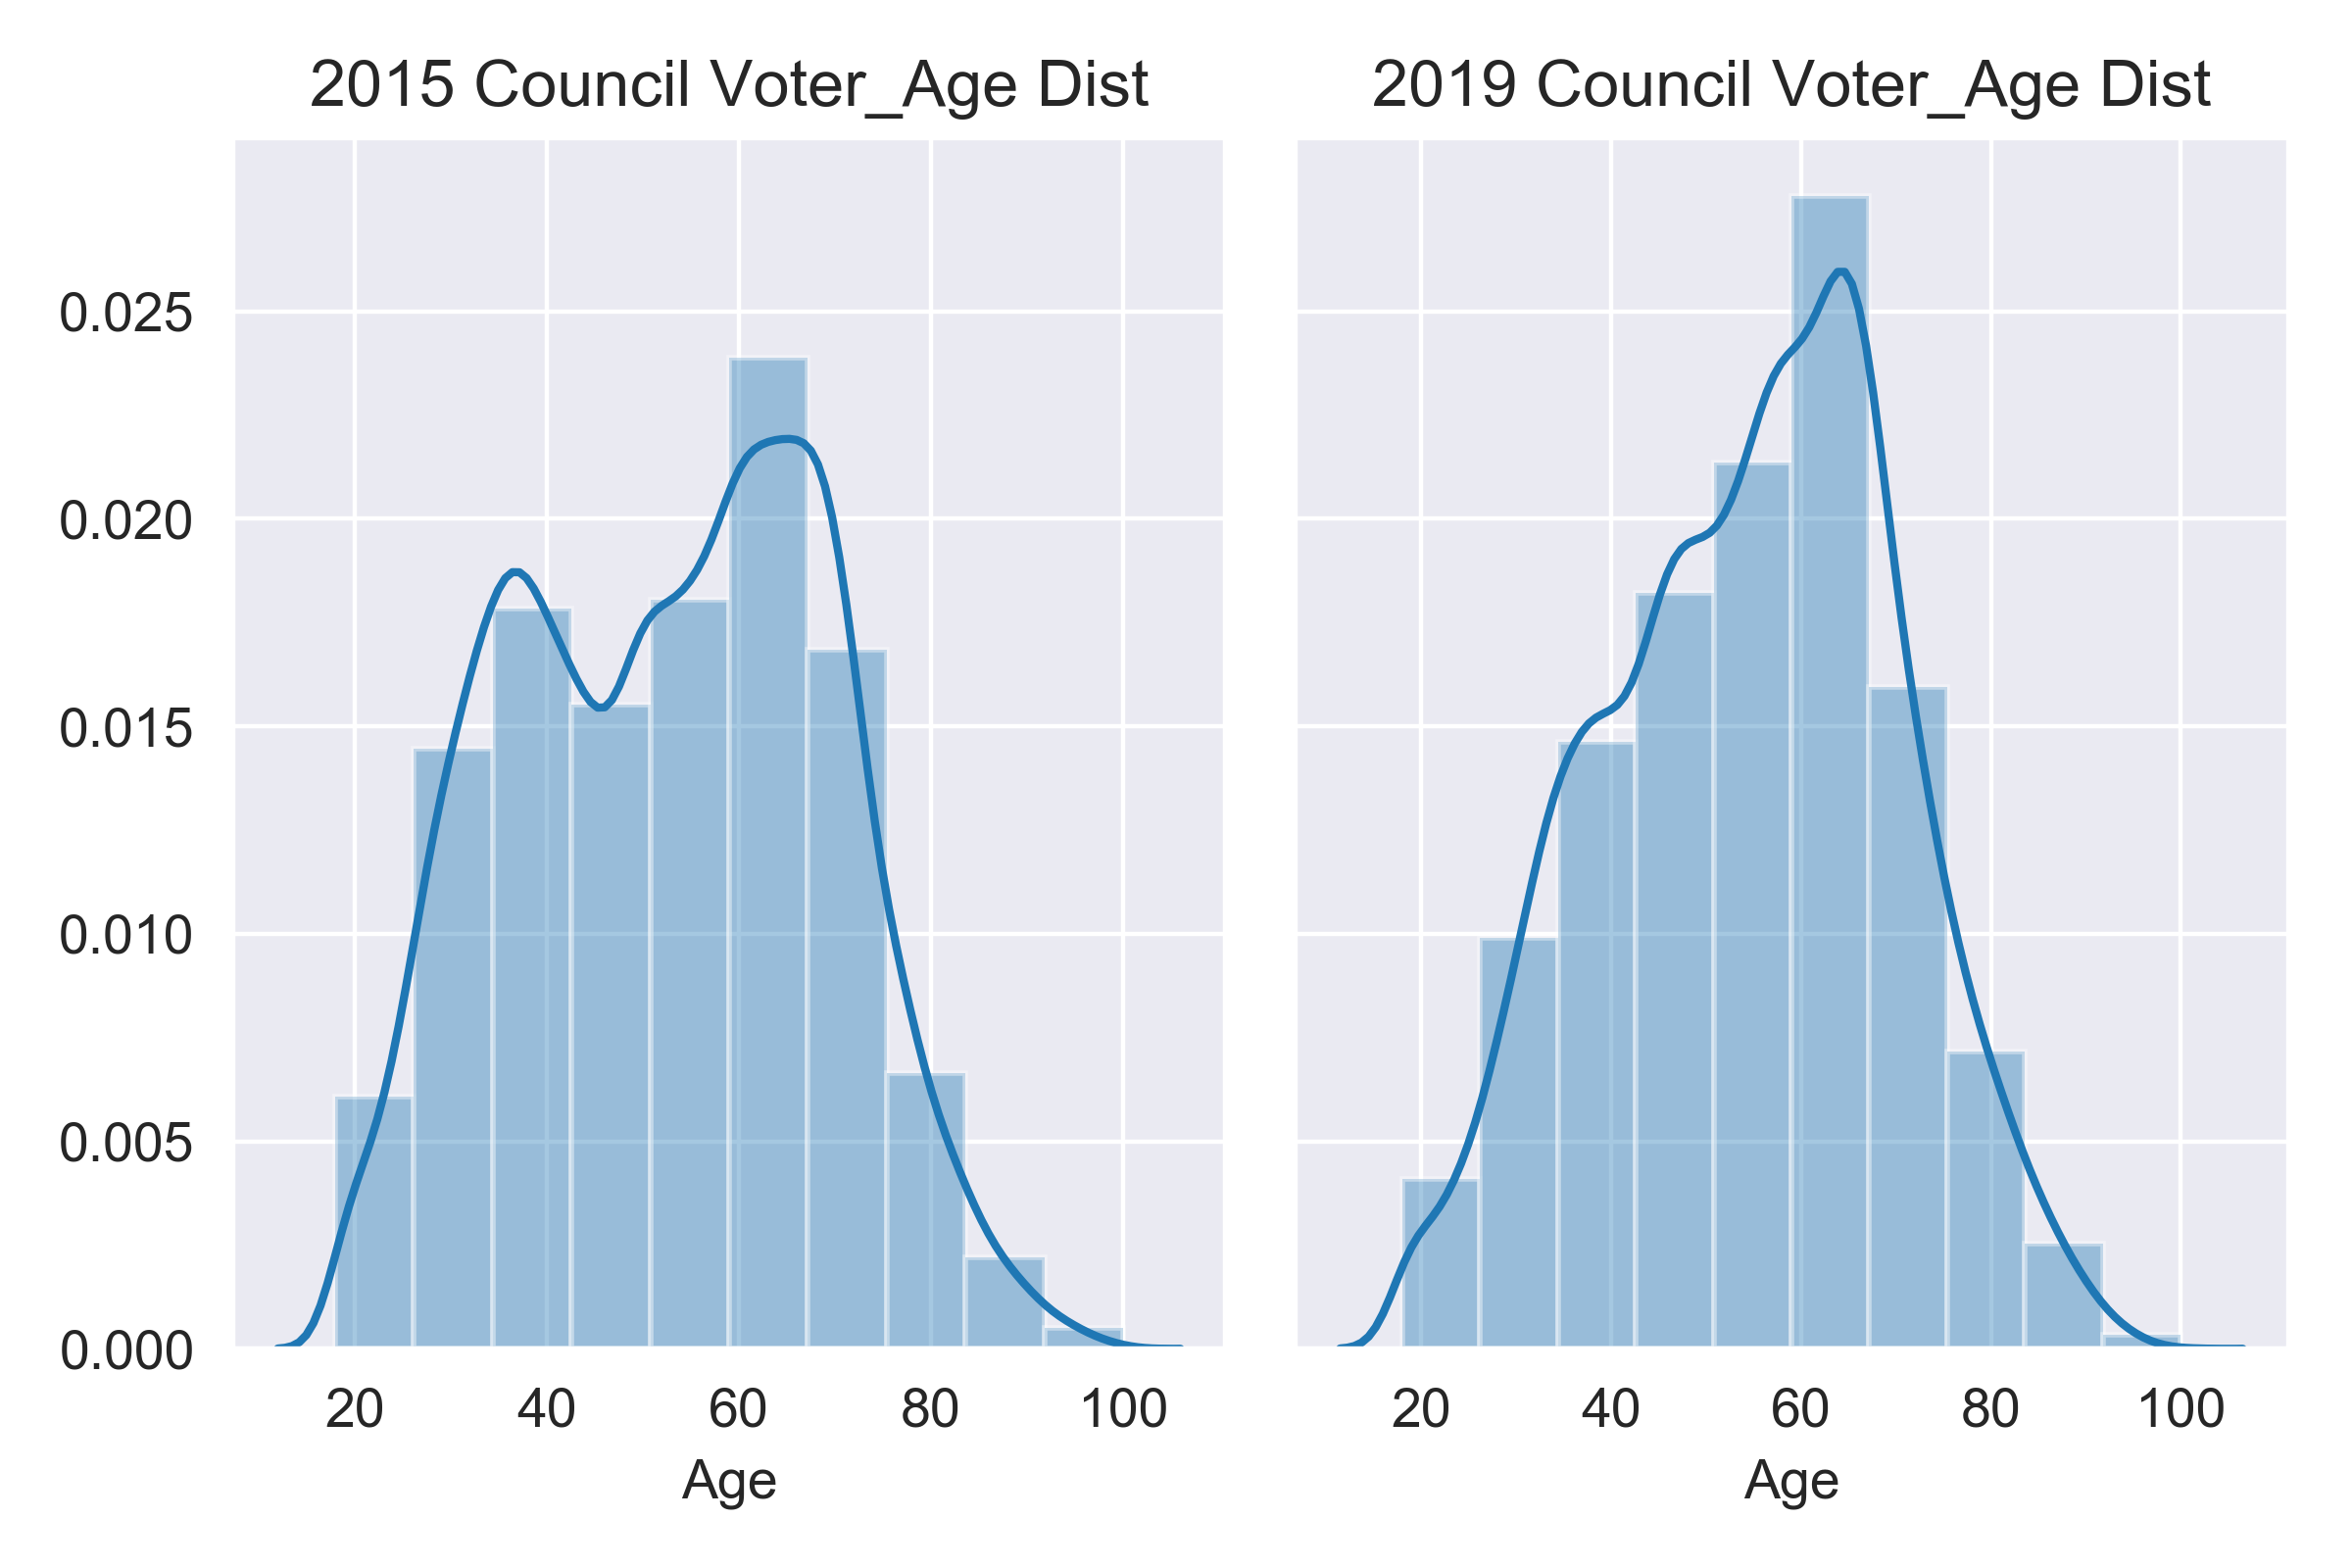
The following graph below compares voter age distribution for the city council election of the 2015 to 2019 city council election.
The following graph below shows the breakdown voter age breakdown of each ward.
Finally, the graph below plots the voter participation rate by age group. Notice, the Saint Paul young adult participation is low despite being the larger demographic and surprisingly 2019 city council follow close to the mayor's turnout
Ward/Youth Vote (Age18-21): 
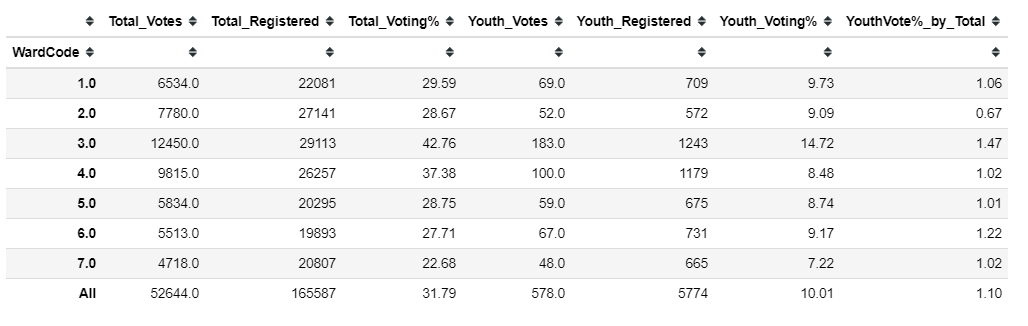
From the following tables below we see the voting and youth participation rate with Ward 3 having a higher voter turnout. The youth turnout is considerably better than 2015 results
Ward Statistics: 
The following table shows the Ward summary statistics. Here is a brief explanation of the columns.
- H_Density%: The percentage of people in the ward living in high density (>39 people in address) living spaces
- H_Density_Vote%: The voting% of people living in high density
- L_Density_Vote%: The voting% of people living in low density (<39 people)
- Vote_Mayor%: The percentage of voters that also voted in the Mayor Election
- Vote_State%: The percentage of voters that also voted in the Senate Election
- Vote_LastCity%: The percentage of voters that also voted in the 2015 city council Election
- Uncap_LastCity%: The percentage of voters that voted in 2015 city council, but not in 2019 city council
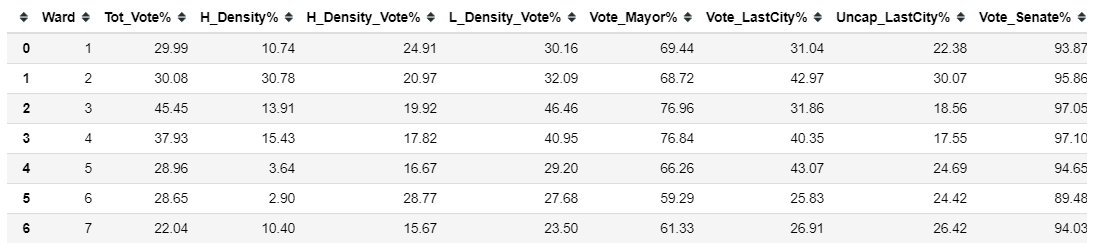
The Vote_LastCity% being low makes me wonder why didn't previous voters vote? Also Ward 6, seems to get the greatest increase of non-traditional voters. The close alignment of voting in city council and Senate could be higher due to DFL involvement where the DFL-endorsed candidate get access to the voter base and/or the DFL took a position in the trash referendum. Finally, all the information on table is broken by precinct in later section
The percentage of voters that also voted for the 2017 Mayor's election 
map_2019_SP_CityCouncilMayor_byPrecinct()
The percentage of voters that also voted for the 2015 City Council election 
map_2019_SP_CityCouncilLast_byPrecinct()
Saint Paul High-Density Registered Voter Map (>39 residents) 
Note: If white shaded indicates those precincts had no high density residents
map_2019_SP_CityCouncilDensity_byPrecinct()
Saint Paul City Council Density Vote% Difference Map (Minimum requirement of 5% of high density) 
Note: A negative number, such as -31, indicates that high density residents has voted more than 31% points than low density residents. Likewise, a score of 36 indicates that low density residents vote 36% points higher than high density residents
map_2019_SP_CityCouncilDensityDiff_byPrecinct()
Etymology Breakdown of LastName of Voters (Incomplete) 
There is a lot of information that is carried over by the names given to us by our parents. When you look at the etymology (origin of word) for names we learn about the influence of our descendents, culture, language, and faith's history. Furthermore, cultures can have different naming customs, that is passed on to generations. In America, the former-slaves, African Americans, lost their culture, which can be seen by them losing their names. For immigrant communities they often assimilate to the new country, which means changing their children's first name to the dominant culture which happen White/ Christian names. Finally, for some cultures the surname can provide information of descendent economic occupation within a society, such as Baker, and/or connection to a clan. So when encountering someone's name, we have some basic information of their latest cultural influence. This information can be used to determine some group effects, while protecting individual identity. The exploratory data analysis is to determine if there are interesting trends within these groups and what can we do with this information, which can be context and culturally explicit. The following below is the demographic history of Saint Paul.
As of the 2000 U.S. Census, there were 287,151 people, 112,109 households, and 60,999 families residing in the Saint Paul. The racial makeup of the city was 67.0% White, 11.7% African American, 1.1% Native American, 12.4% Asian (mostly Hmong), 0.1% Pacific Islander, 3.8% from other races, and 3.9% from two or more races. Hispanic or Latino people of any race were 7.9% of the population. In terms of people who specified European ancestry in the 2005–2007 American Community Survey, the city was 26.4% German, 13.8% Irish, 8.4% Norwegian, 7.0% Swedish, and 6.2% English. There is also a visible community of people of Sub-Saharan African ancestry, representing 4.2% of Saint Paul's population. (Wikipedia)
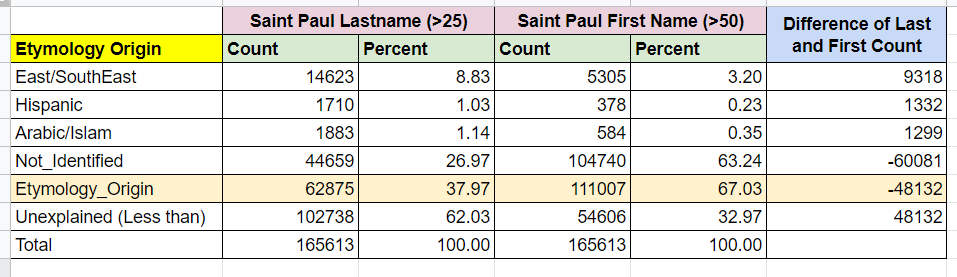
In this analysis, I could confidently differentiate (w/ Internet search and querying the raw data) the surnames of three common etymology categories appropriate in Saint Paul. This is a valid research method as a study used the name of the authors of academic papers to determine the impact of diversity in the number of citations. Note: I was not confidently be able to distinguish European origin because it is the dominant culture so there is inter-mixing, and they share common surnames for African-Amercians (i.e. due to slavery). My designations are available in this Google Spreadsheet. My methodology was identifying the most frequent surnames, on the registry list, last name (>25) and first names (>50). The list was astounding, as expected the most common first names tend to be Christian/biblical origin, while for surnames there was much greater frequency of East/South Asian origin. The table below are the aggregate data using categorizing first and last name. From the table, we see that there significantly more 'Not-Identified" first names and the first name column covered more of the sample size despite having a frequency criteria.
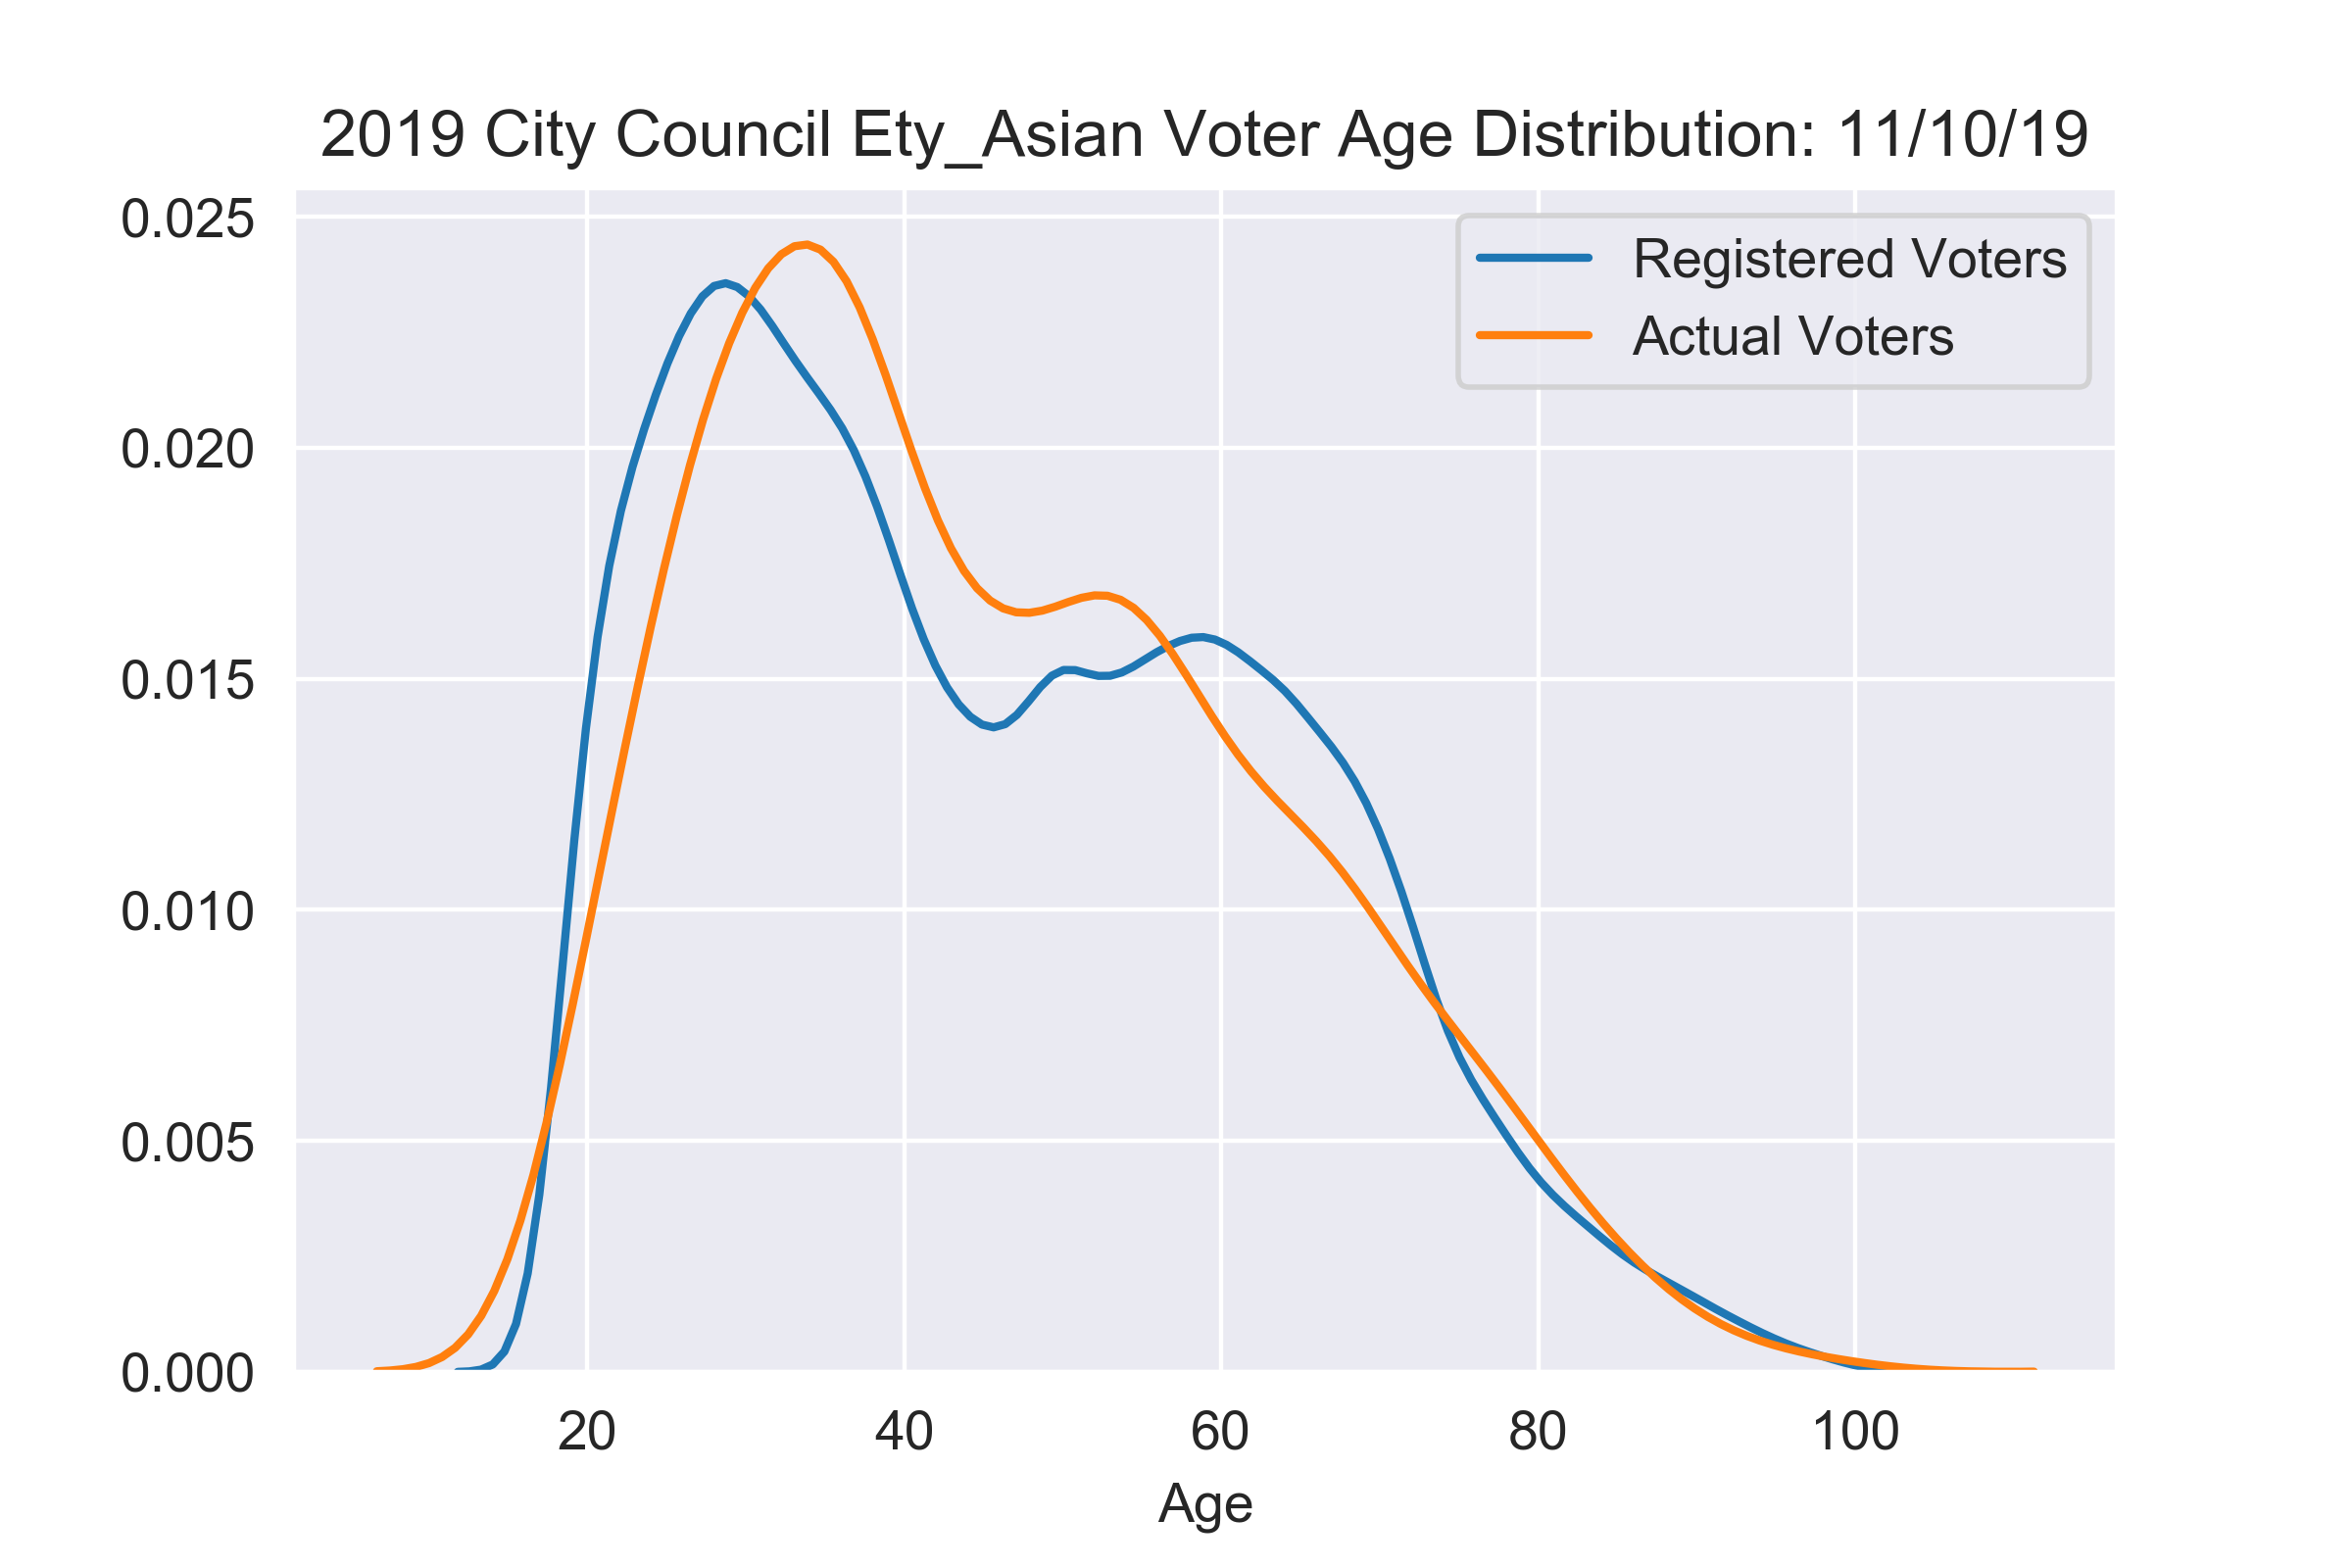
For the analysis itself, only the etymology category "East/SouthEast Asian" had a large enough sample size to do some preliminary analysis. I just used the last name to categorize. On the graph below, the registry and voting age distribution closely aligns. This was true for etymology of Hispanic and Arabic origin.
The following graph below shows the voting percentage. Notice that the young people have the same voting rate as the average American. There is a voting gap for older adults
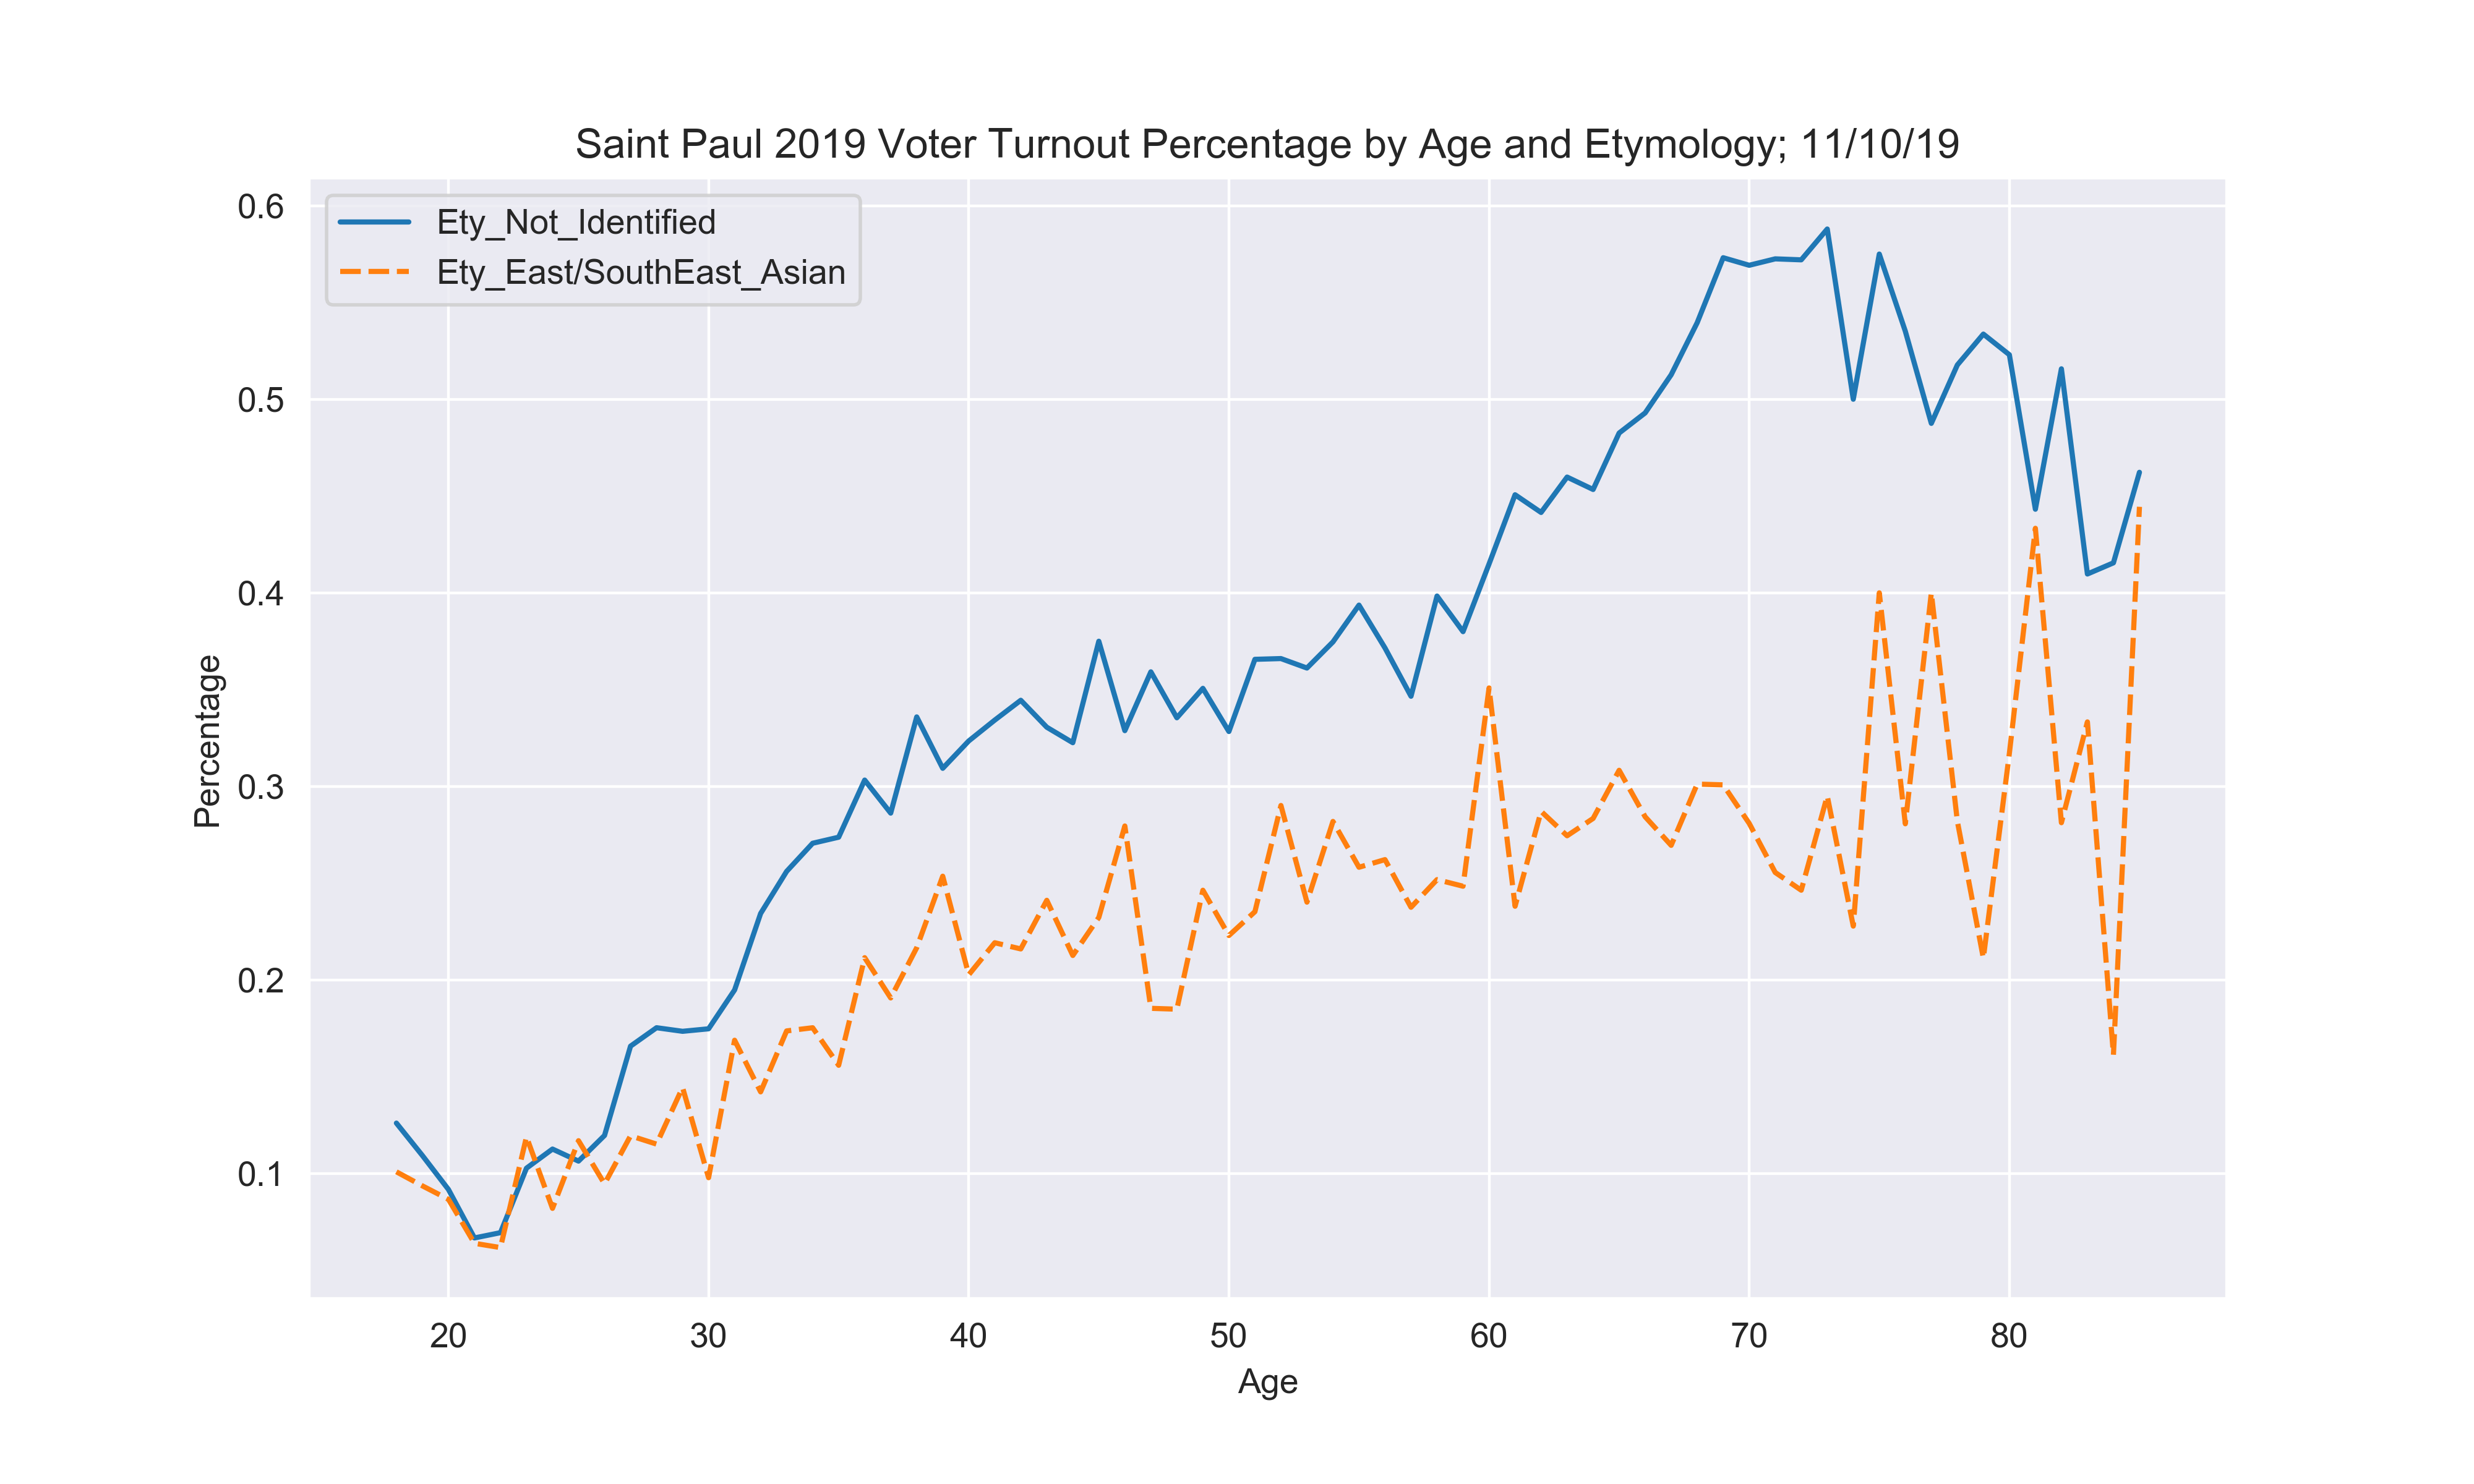
I have not looked further into data due to the general public sensitivity of racial/ethnic related data.
Precinct Analysis: Fragmentation 
This is essentially the Ward analysis, but broken down to each precinct.
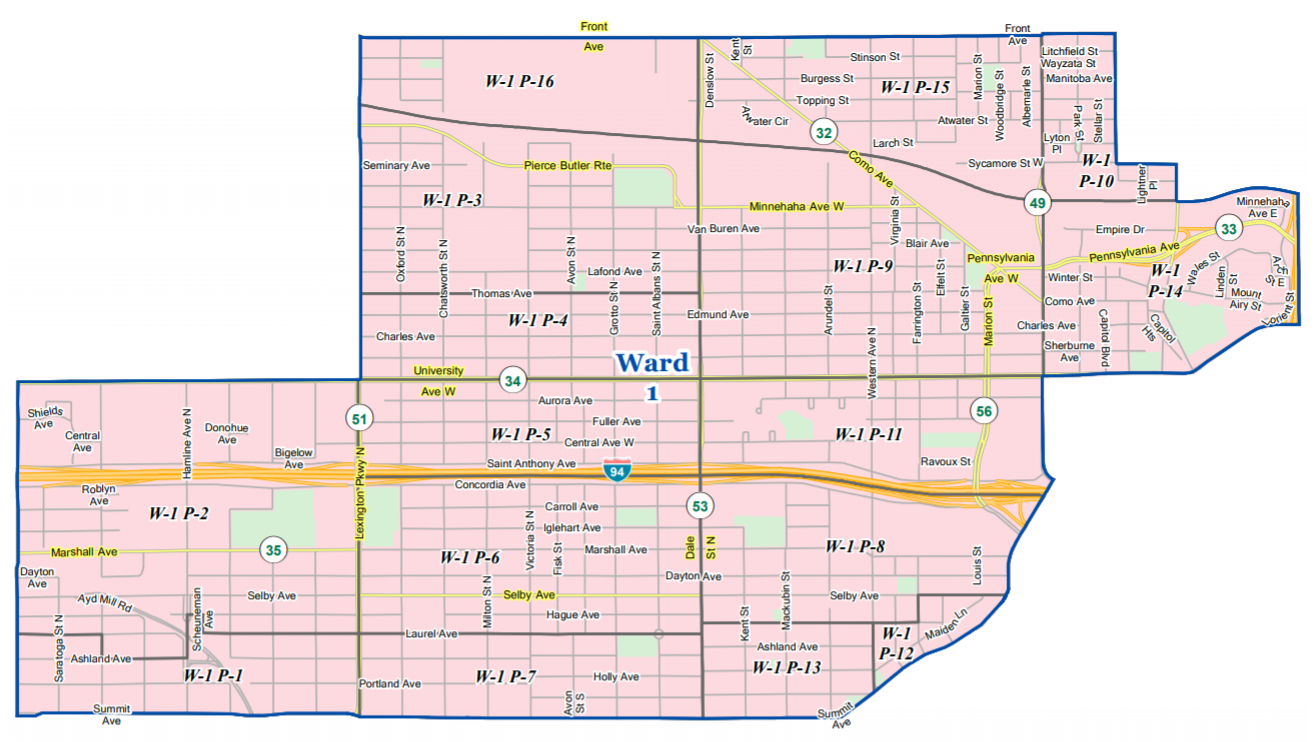
Ward 1 Precinct Analysis 
P19.query('Ward==1')
| Ward | Precinct | Tot_Vote% | LastCity_Vote% | H_Dens% | H_Dens_Vote% | L_Dens_Vote% | Vote_Mayor% | Vote_LastCity% | Vote_Sen% | |
|---|---|---|---|---|---|---|---|---|---|---|
| 0 | 1 | W-1 P-1 | 47.69 | 24.78 | 0.00 | 0.00 | 49.03 | 78.39 | 41.51 | 96.05 |
| 1 | 1 | W-1 P-2 | 35.35 | 13.10 | 31.22 | 27.27 | 40.01 | 66.50 | 27.38 | 94.00 |
| 2 | 1 | W-1 P-3 | 25.45 | 9.71 | 4.36 | 5.95 | 25.61 | 71.28 | 26.21 | 93.71 |
| 3 | 1 | W-1 P-4 | 25.72 | 10.57 | 0.00 | 0.00 | 24.93 | 71.26 | 31.32 | 90.80 |
| 4 | 1 | W-1 P-5 | 25.78 | 11.29 | 6.16 | 6.98 | 26.93 | 68.25 | 30.92 | 94.71 |
| 5 | 1 | W-1 P-6 | 32.71 | 12.51 | 2.30 | 10.77 | 32.08 | 72.62 | 28.40 | 95.62 |
| 6 | 1 | W-1 P-7 | 44.27 | 18.28 | 0.00 | 0.00 | 44.04 | 71.41 | 36.76 | 97.58 |
| 7 | 1 | W-1 P-8 | 29.75 | 12.79 | 16.54 | 20.96 | 30.38 | 70.89 | 26.99 | 96.75 |
| 8 | 1 | W-1 P-9 | 19.30 | 8.18 | 11.26 | 17.41 | 19.09 | 58.06 | 26.27 | 84.33 |
| 9 | 1 | W-1 P-10 | 20.85 | 7.92 | 0.00 | 0.00 | 18.94 | 56.18 | 32.58 | 85.39 |
| 10 | 1 | W-1 P-11 | 18.87 | 11.53 | 28.39 | 25.08 | 15.27 | 66.83 | 37.02 | 88.94 |
| 11 | 1 | W-1 P-12 | 44.21 | 20.12 | 14.63 | 61.22 | 43.01 | 80.39 | 42.48 | 98.04 |
| 12 | 1 | W-1 P-13 | 37.01 | 15.42 | 8.55 | 34.00 | 37.23 | 75.00 | 34.49 | 98.38 |
| 13 | 1 | W-1 P-14 | 25.56 | 13.62 | 26.50 | 38.85 | 18.45 | 54.70 | 27.78 | 84.62 |
| 14 | 1 | W-1 P-15 | 20.81 | 5.29 | 11.42 | 18.60 | 22.19 | 49.39 | 16.46 | 88.41 |
| 15 | 1 | W-1 P-16 | 29.10 | 13.19 | 0.00 | 0.00 | 28.69 | 77.14 | 42.86 | 97.14 |
map_2019_SP_CityCouncilMayor_byPrecinct(1)
map_2019_SP_CityCouncilLast_byPrecinct(1)
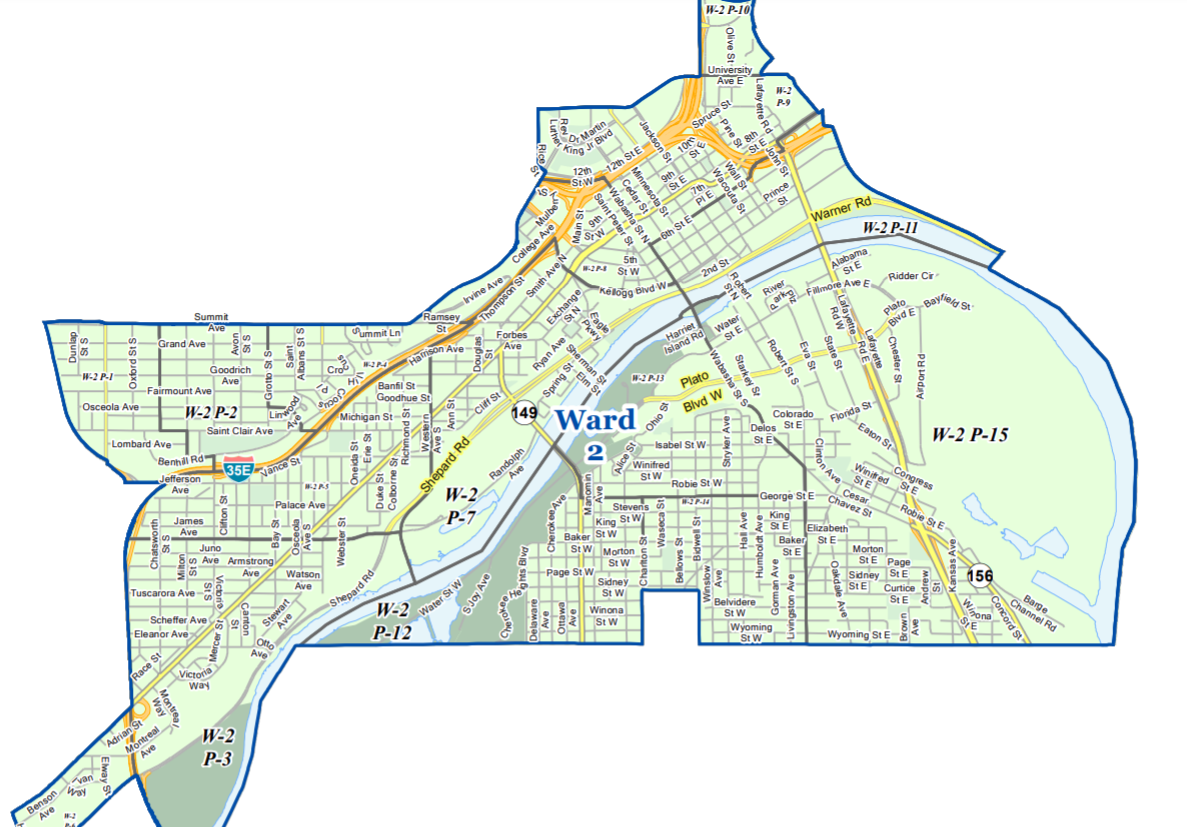
P19.query('Ward==2')
| Ward | Precinct | Tot_Vote% | LastCity_Vote% | H_Dens% | H_Dens_Vote% | L_Dens_Vote% | Vote_Mayor% | Vote_LastCity% | Vote_Sen% | |
|---|---|---|---|---|---|---|---|---|---|---|
| 16 | 2 | W-2 P-1 | 43.77 | 27.63 | 0.00 | 0.00 | 43.77 | 78.52 | 51.35 | 98.15 |
| 17 | 2 | W-2 P-2 | 43.82 | 27.22 | 0.00 | 0.00 | 44.20 | 76.79 | 48.28 | 96.55 |
| 18 | 2 | W-2 P-3 | 30.76 | 17.35 | 15.98 | 13.01 | 36.95 | 63.11 | 36.78 | 95.37 |
| 19 | 2 | W-2 P-4 | 32.39 | 19.62 | 0.00 | 0.00 | 32.71 | 77.32 | 44.58 | 97.24 |
| 20 | 2 | W-2 P-5 | 34.06 | 22.56 | 15.33 | 20.11 | 39.03 | 68.60 | 44.48 | 96.13 |
| 21 | 2 | W-2 P-6 | 30.77 | 17.25 | 73.88 | 26.25 | 39.88 | 66.13 | 36.56 | 95.16 |
| 22 | 2 | W-2 P-7 | 27.07 | 17.09 | 46.61 | 18.87 | 36.39 | 69.61 | 42.95 | 95.66 |
| 23 | 2 | W-2 P-8 | 21.69 | 12.96 | 71.47 | 19.21 | 25.94 | 68.59 | 35.74 | 92.42 |
| 24 | 2 | W-2 P-9 | 27.66 | 18.37 | 84.82 | 27.41 | 26.11 | 73.00 | 43.52 | 96.63 |
| 25 | 2 | W-2 P-11 | 23.87 | 12.35 | 94.45 | 21.81 | 26.38 | 66.67 | 37.96 | 94.75 |
| 26 | 2 | W-2 P-12 | 37.72 | 25.79 | 0.00 | 0.00 | 39.38 | 67.24 | 45.49 | 95.85 |
| 27 | 2 | W-2 P-13 | 32.06 | 23.13 | 13.60 | 0.00 | 0.00 | NaN | NaN | NaN |
| 28 | 2 | W-2 P-14 | 28.60 | 18.21 | 0.00 | 0.00 | 29.24 | 60.56 | 45.88 | 97.38 |
| 29 | 2 | W-2 P-15 | 17.83 | 11.27 | 8.73 | 12.03 | 19.21 | 53.02 | 36.26 | 92.20 |
map_2019_SP_CityCouncilMayor_byPrecinct(2)
map_2019_SP_CityCouncilLast_byPrecinct(2)
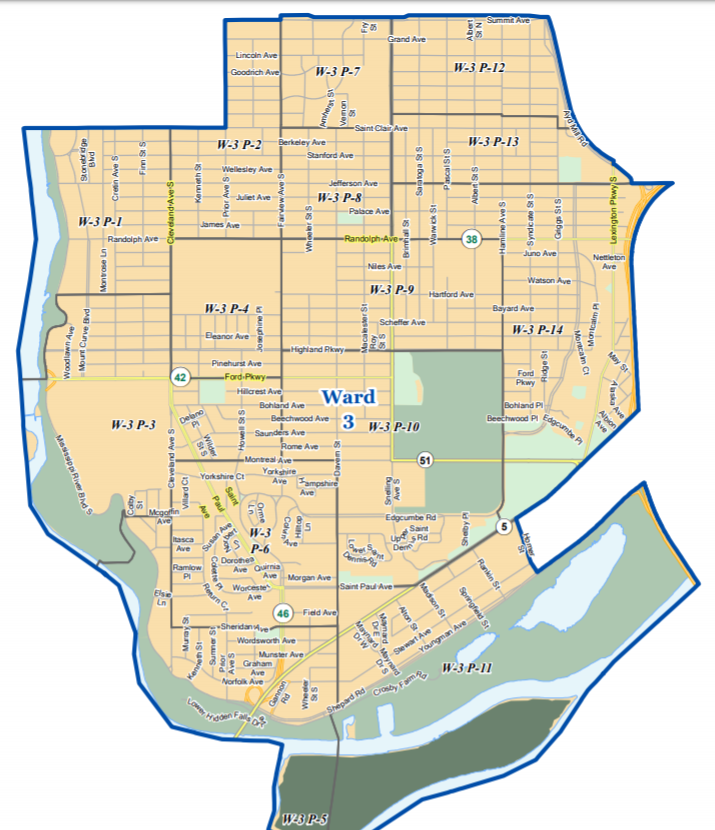
P19.query('Ward==3')
| Ward | Precinct | Tot_Vote% | LastCity_Vote% | H_Dens% | H_Dens_Vote% | L_Dens_Vote% | Vote_Mayor% | Vote_LastCity% | Vote_Sen% | |
|---|---|---|---|---|---|---|---|---|---|---|
| 30 | 3 | W-3 P-1 | 52.07 | 20.09 | 0.00 | 0.00 | 51.67 | 80.92 | 32.07 | 97.70 |
| 31 | 3 | W-3 P-2 | 50.14 | 21.65 | 0.00 | 0.00 | 49.94 | 80.08 | 36.24 | 97.44 |
| 32 | 3 | W-3 P-3 | 42.16 | 15.56 | 13.27 | 25.55 | 44.33 | 76.83 | 29.79 | 97.82 |
| 33 | 3 | W-3 P-4 | 45.18 | 23.11 | 35.72 | 26.18 | 53.64 | 79.00 | 38.67 | 97.50 |
| 34 | 3 | W-3 P-5 | 34.86 | 13.73 | 48.51 | 0.00 | 0.00 | NaN | NaN | NaN |
| 35 | 3 | W-3 P-6 | 44.75 | 16.20 | 0.00 | 0.00 | 44.13 | 76.27 | 30.30 | 97.56 |
| 36 | 3 | W-3 P-7 | 37.57 | 19.08 | 47.82 | 16.33 | 49.14 | 62.40 | 26.03 | 88.22 |
| 37 | 3 | W-3 P-8 | 54.17 | 20.63 | 3.28 | 18.87 | 55.97 | 77.88 | 32.39 | 97.52 |
| 38 | 3 | W-3 P-9 | 49.18 | 17.93 | 6.69 | 32.14 | 50.09 | 75.06 | 30.64 | 96.58 |
| 39 | 3 | W-3 P-10 | 49.24 | 17.77 | 0.00 | 0.00 | 49.31 | 82.56 | 30.36 | 97.07 |
| 40 | 3 | W-3 P-11 | 18.75 | 8.22 | 47.51 | 23.32 | 14.13 | 67.03 | 30.77 | 95.88 |
| 41 | 3 | W-3 P-12 | 51.38 | 18.91 | 0.00 | 0.00 | 51.49 | 77.62 | 32.01 | 97.22 |
| 42 | 3 | W-3 P-13 | 49.49 | 21.47 | 14.63 | 41.70 | 50.41 | 78.46 | 33.96 | 98.13 |
| 43 | 3 | W-3 P-14 | 51.51 | 18.66 | 4.20 | 51.32 | 51.72 | 75.53 | 30.45 | 97.49 |
map_2019_SP_CityCouncilMayor_byPrecinct(3)
map_2019_SP_CityCouncilLast_byPrecinct(3)
Ward 4 Precinct Analysis 
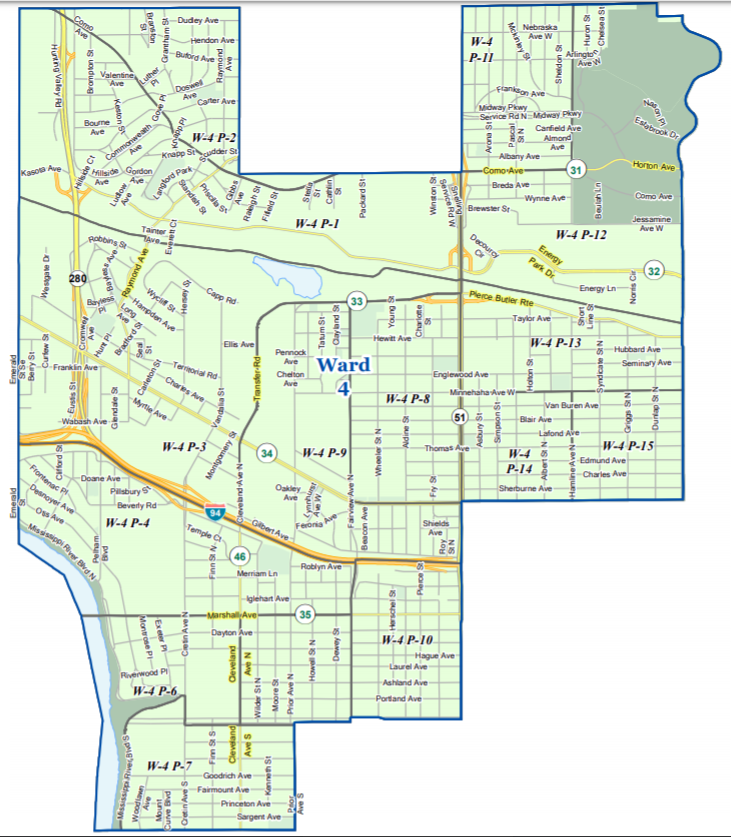
P19.query('Ward==4')
| Ward | Precinct | Tot_Vote% | LastCity_Vote% | H_Dens% | H_Dens_Vote% | L_Dens_Vote% | Vote_Mayor% | Vote_LastCity% | Vote_Sen% | |
|---|---|---|---|---|---|---|---|---|---|---|
| 44 | 4 | W-4 P-1 | 43.62 | 26.36 | 2.64 | 23.26 | 43.29 | 79.63 | 46.05 | 98.85 |
| 45 | 4 | W-4 P-2 | 51.18 | 37.82 | 5.61 | 68.42 | 50.47 | 83.07 | 57.53 | 95.98 |
| 46 | 4 | W-4 P-3 | 24.45 | 7.98 | 66.06 | 20.03 | 30.69 | 67.67 | 23.09 | 95.03 |
| 47 | 4 | W-4 P-4 | 42.14 | 20.66 | 0.00 | 0.00 | 42.16 | 75.73 | 38.52 | 98.15 |
| 48 | 4 | W-4 P-5 | 43.09 | 22.19 | 0.00 | 0.00 | 42.42 | 73.91 | 38.18 | 97.20 |
| 49 | 4 | W-4 P-6 | 26.44 | 13.34 | 44.40 | 5.25 | 37.83 | 75.07 | 35.18 | 97.78 |
| 50 | 4 | W-4 P-7 | 43.22 | 23.63 | 3.38 | 1.61 | 45.10 | 82.65 | 41.57 | 97.50 |
| 51 | 4 | W-4 P-8 | 36.33 | 18.84 | 0.00 | 0.00 | 35.96 | 76.47 | 40.43 | 97.12 |
| 52 | 4 | W-4 P-9 | 32.29 | 16.47 | 15.49 | 41.63 | 29.89 | 69.58 | 35.93 | 97.15 |
| 53 | 4 | W-4 P-10 | 46.10 | 22.79 | 0.00 | 0.00 | 43.71 | 79.98 | 42.63 | 97.64 |
| 54 | 4 | W-4 P-11 | 40.60 | 23.12 | 15.39 | 13.66 | 46.01 | 76.44 | 42.09 | 96.18 |
| 55 | 4 | W-4 P-12 | 27.86 | 11.02 | 36.75 | 14.73 | 36.07 | 73.06 | 31.43 | 96.12 |
| 56 | 4 | W-4 P-13 | 36.74 | 19.31 | 16.78 | 16.33 | 39.60 | 74.53 | 38.20 | 98.13 |
| 57 | 4 | W-4 P-14 | 38.80 | 20.86 | 0.00 | 0.00 | 37.76 | 79.60 | 46.03 | 97.47 |
| 58 | 4 | W-4 P-15 | 42.41 | 19.47 | 7.96 | 15.70 | 45.82 | 77.73 | 37.73 | 96.06 |
map_2019_SP_CityCouncilMayor_byPrecinct(4)
map_2019_SP_CityCouncilLast_byPrecinct(4)
Ward 5 Precinct Analysis 
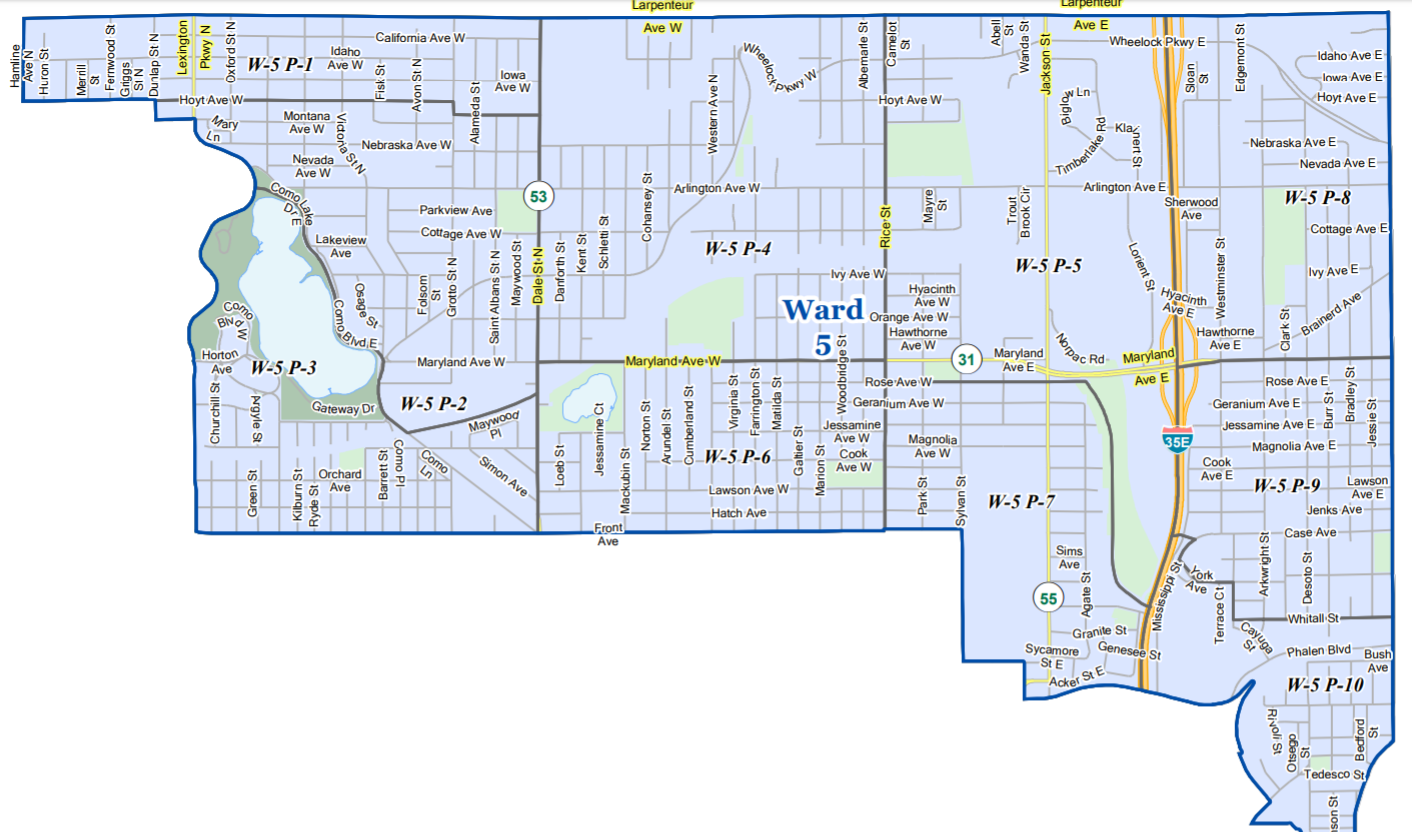
P19.query('Ward==5')
| Ward | Precinct | Tot_Vote% | LastCity_Vote% | H_Dens% | H_Dens_Vote% | L_Dens_Vote% | Vote_Mayor% | Vote_LastCity% | Vote_Sen% | |
|---|---|---|---|---|---|---|---|---|---|---|
| 59 | 5 | W-5 P-1 | 41.53 | 24.38 | 8.33 | 13.37 | 44.46 | 68.67 | 44.74 | 97.92 |
| 60 | 5 | W-5 P-2 | 50.02 | 37.99 | 5.43 | 16.91 | 52.36 | 77.45 | 57.44 | 97.86 |
| 61 | 5 | W-5 P-3 | 45.89 | 31.30 | 6.03 | 35.71 | 45.82 | 69.81 | 53.07 | 97.14 |
| 62 | 5 | W-5 P-4 | 23.69 | 13.60 | 1.69 | 14.75 | 23.69 | 63.50 | 41.43 | 93.31 |
| 63 | 5 | W-5 P-5 | 18.32 | 10.20 | 2.42 | 8.51 | 17.62 | 51.18 | 23.37 | 82.25 |
| 64 | 5 | W-5 P-6 | 24.56 | 10.94 | 0.00 | 0.00 | 24.44 | 58.30 | 29.79 | 92.34 |
| 65 | 5 | W-5 P-7 | 20.36 | 10.01 | 0.00 | 0.00 | 20.48 | 57.09 | 29.15 | 91.90 |
| 66 | 5 | W-5 P-8 | 17.29 | 9.53 | 5.79 | 10.42 | 17.89 | 60.37 | 32.49 | 92.86 |
| 67 | 5 | W-5 P-9 | 19.37 | 8.96 | 0.00 | 0.00 | 18.55 | 57.78 | 27.84 | 90.42 |
| 68 | 5 | W-5 P-10 | 14.98 | 7.59 | 7.88 | 7.69 | 13.65 | 57.47 | 24.14 | 95.40 |
map_2019_SP_CityCouncilMayor_byPrecinct(5)
map_2019_SP_CityCouncilLast_byPrecinct(5)
Ward 6 Precinct Analysis 
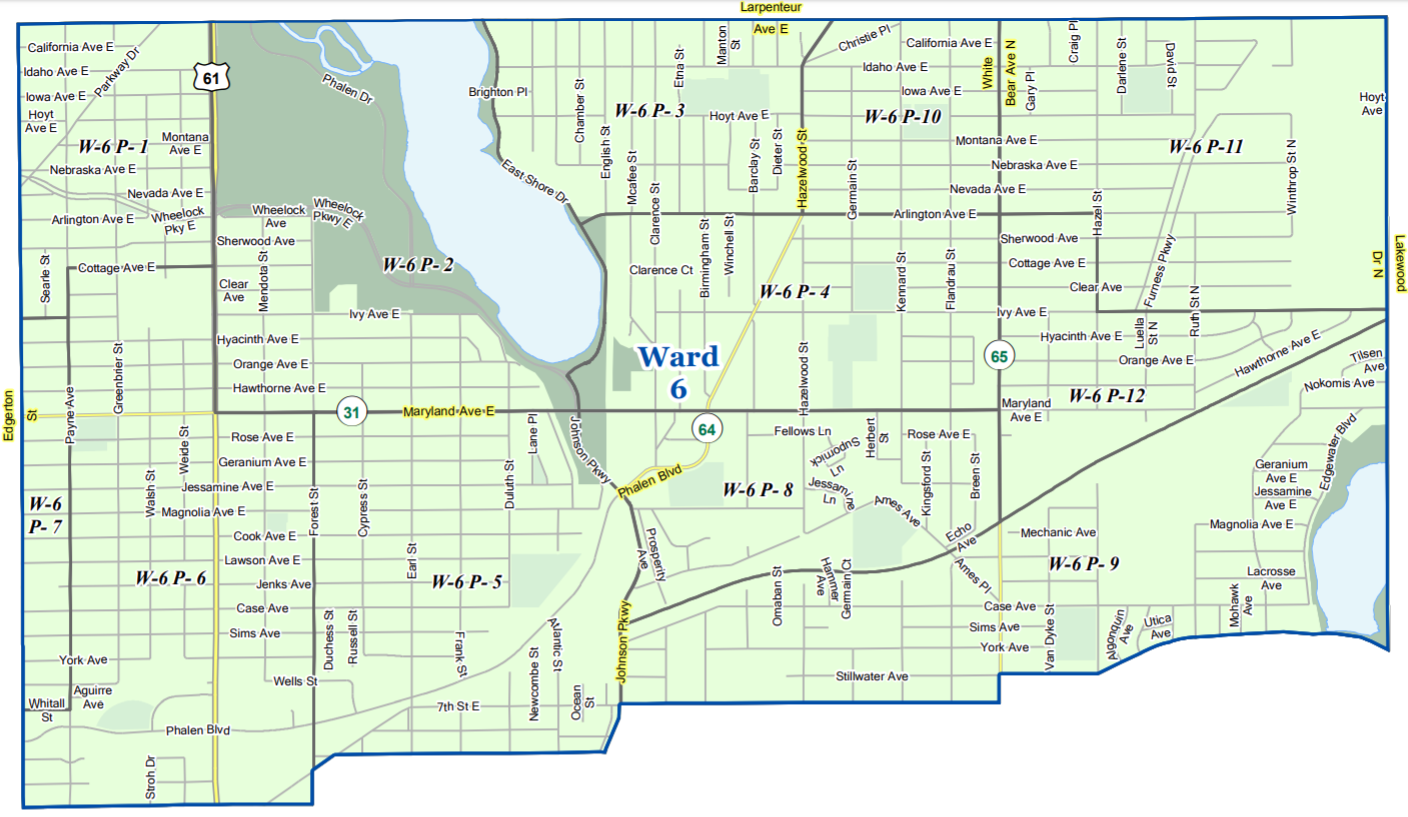
P19.query('Ward==6')
| Ward | Precinct | Tot_Vote% | LastCity_Vote% | H_Dens% | H_Dens_Vote% | L_Dens_Vote% | Vote_Mayor% | Vote_LastCity% | Vote_Sen% | |
|---|---|---|---|---|---|---|---|---|---|---|
| 69 | 6 | W-6 P-1 | 35.50 | 12.04 | 0.00 | 0.00 | 34.42 | 63.98 | 24.95 | 94.37 |
| 70 | 6 | W-6 P-2 | 46.02 | 19.74 | 0.00 | 0.00 | 46.34 | 70.58 | 32.99 | 96.09 |
| 71 | 6 | W-6 P-3 | 30.52 | 13.06 | 0.00 | 0.00 | 29.28 | 61.47 | 29.89 | 90.95 |
| 72 | 6 | W-6 P-4 | 25.84 | 9.05 | 6.80 | 5.93 | 26.61 | 58.20 | 26.40 | 86.60 |
| 73 | 6 | W-6 P-5 | 27.33 | 9.75 | 0.00 | 0.00 | 25.80 | 59.90 | 24.74 | 86.01 |
| 74 | 6 | W-6 P-6 | 25.68 | 7.78 | 2.17 | 19.30 | 23.86 | 57.78 | 20.22 | 86.68 |
| 75 | 6 | W-6 P-7 | 25.51 | 11.24 | 23.76 | 46.01 | 15.68 | 62.42 | 27.39 | 82.80 |
| 76 | 6 | W-6 P-8 | 20.60 | 8.54 | 7.01 | 33.91 | 18.41 | 59.69 | 28.12 | 78.44 |
| 77 | 6 | W-6 P-9 | 25.46 | 7.28 | 0.00 | 0.00 | 24.79 | 53.58 | 21.80 | 89.68 |
| 78 | 6 | W-6 P-10 | 27.08 | 11.77 | 10.46 | 30.84 | 26.31 | 61.31 | 29.56 | 91.24 |
| 79 | 6 | W-6 P-11 | 33.26 | 11.80 | 0.00 | 0.00 | 33.31 | 51.14 | 24.17 | 91.24 |
| 80 | 6 | W-6 P-12 | 27.17 | 9.17 | 0.00 | 0.00 | 26.95 | 53.11 | 24.22 | 93.17 |
map_2019_SP_CityCouncilMayor_byPrecinct(6)
map_2019_SP_CityCouncilLast_byPrecinct(6)
Ward 7 Precinct Analysis 
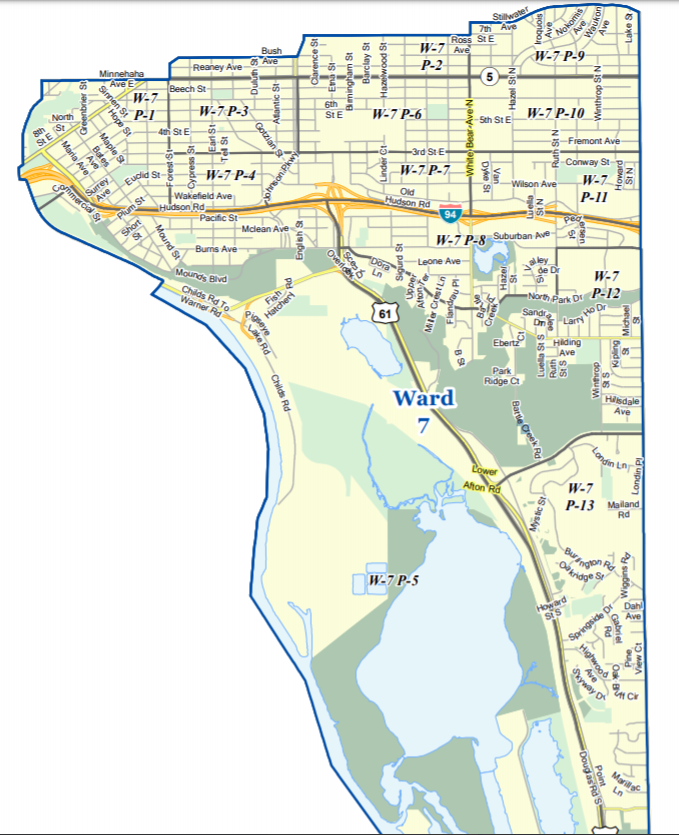
P19.query('Ward==7')
| Ward | Precinct | Tot_Vote% | LastCity_Vote% | H_Dens% | H_Dens_Vote% | L_Dens_Vote% | Vote_Mayor% | Vote_LastCity% | Vote_Sen% | |
|---|---|---|---|---|---|---|---|---|---|---|
| 81 | 7 | W-7 P-1 | 21.24 | 9.32 | 5.70 | 18.70 | 20.84 | 67.56 | 31.32 | 93.96 |
| 82 | 7 | W-7 P-2 | 20.08 | 5.69 | 0.00 | 0.00 | 21.10 | 50.18 | 18.41 | 90.97 |
| 83 | 7 | W-7 P-3 | 20.05 | 6.76 | 0.00 | 0.00 | 20.18 | 63.49 | 22.22 | 93.97 |
| 84 | 7 | W-7 P-4 | 19.96 | 8.39 | 13.60 | 14.84 | 21.03 | 62.11 | 28.95 | 95.79 |
| 85 | 7 | W-7 P-5 | 33.96 | 18.77 | 13.74 | 24.61 | 34.78 | 69.83 | 40.30 | 97.20 |
| 86 | 7 | W-7 P-6 | 18.79 | 6.05 | 0.00 | 0.00 | 19.70 | 57.49 | 16.38 | 89.90 |
| 87 | 7 | W-7 P-7 | 17.55 | 7.82 | 21.06 | 17.09 | 19.01 | 57.20 | 25.10 | 90.95 |
| 88 | 7 | W-7 P-8 | 19.76 | 8.19 | 11.27 | 4.52 | 22.86 | 61.04 | 23.71 | 94.28 |
| 89 | 7 | W-7 P-9 | 21.94 | 6.83 | 0.00 | 0.00 | 23.57 | 53.76 | 20.16 | 93.28 |
| 90 | 7 | W-7 P-10 | 22.18 | 7.70 | 0.00 | 0.00 | 23.83 | 54.18 | 22.77 | 92.22 |
| 91 | 7 | W-7 P-11 | 12.47 | 5.23 | 21.43 | 10.07 | 13.64 | 60.48 | 23.35 | 94.61 |
| 92 | 7 | W-7 P-12 | 22.46 | 10.37 | 20.11 | 11.65 | 25.54 | 66.78 | 30.40 | 95.85 |
| 93 | 7 | W-7 P-13 | 31.68 | 13.10 | 22.55 | 23.74 | 35.77 | 61.21 | 30.53 | 95.02 |
map_2019_SP_CityCouncilMayor_byPrecinct(7)
map_2019_SP_CityCouncilLast_byPrecinct(7)
Concluding Thoughts/ Summary 
From this supplemental report, here are some of the highlights:
- Voter Registry: It has increased in 2019 city council election, mostly toward younger voters
- Voter Age Distribution: Compared to the 2015 city council election, the 2019 city council had even greater concentration of older voters (60-70).
- Voter Turnout Across Age: It was very similar to that of the 2017 mayoral election.
- Percentage of Voters that also voted in Mayor’s election: it ranged from 50% to 80% across precincts with west of Saint Paul having greater alignment
- Percentage of Voters that also voted in Last City Council election: it ranged from 15% to 60% across precincts which is considerably lower than the citizens that vote in the mayor. Note, this should be expected since the overall voter turnout has increased
- Percentage of Voters that also voted in Senate’s election: it ranged from 90% to 98% across Wards; indicating not that many new voters came.
- Youth Vote% (Age 18-21): it’s around 10% for the city. However, it does not consider the potential total registered vote count which may double for the upcoming presidential election
- Density Metrics: There is voter turnout discrepancy between high density and low density residents. From the map, we see the wealthier precincts have low-density residents voting more frequently than the high-density residents. In ward 3, there was a difference of 26% points with low density residents voting more frequently.
- Etymology Metrics: Ethnic minorities follow more closely to the population demographics, while more traditional Americans have older people voting in much greater proportion. For the East/SouthEast Asian category, the youth voting rate is the same as the average population, but there is a voting participation gap for older voters.
Run Code (Prior to running report) 
#Run Code
import pandas as pd
import numpy as np
import warnings
warnings.filterwarnings('ignore')
import matplotlib as mpl
import matplotlib.pyplot as plt
%matplotlib inline
import requests # library to handle requests
import folium
import seaborn as sns
import scipy.stats as stats #used to get correlation coefficient

#load data
P_19= pd.read_csv('Data/2019Data/2019Precinct_Complete.csv')
P_19['H_Dens']= P_19['H_Density%']
Features= ['Ward','Precinct1', 'Tot_Vote%','LastCouncil_Vote%', 'H_Density%', 'H_Density_Vote%', 'L_Density_Vote%', 'Vote_Mayor%', 'Vote_LastCity%', 'Vote_Senate%']
P19= P_19[Features]
P19.columns= ['Ward','Precinct', 'Tot_Vote%','LastCity_Vote%', 'H_Dens%', 'H_Dens_Vote%', 'L_Dens_Vote%', 'Vote_Mayor%', 'Vote_LastCity%', 'Vote_Sen%']

Features= ['Ward','Precinct',  'H_Density%', 'Density_VoteDiff%', 'H_Dens']
PP= P_19[Features]

# Vote Maoor
def map_2019_SP_CityCouncilMayor_byPrecinct(Ward=0):
    #setup
    sp_geo = r'Shapefiles/SaintPaul_VotingPrecincts.json'

    if Ward==0:
        B=P_19
        A='City Council'
        zo= 12
    else:
        B= P_19[(P_19['Ward'] == Ward)]
        A= 'Ward ' + str(Ward) +' '
        zo=13

    #Set up Variable Zoom Locations
    data = [[0, [44.948530, -93.096058]], [1, [44.958326, -93.122926]], [2, [44.933159, -93.115535]], [3, [44.918270, -93.176131]], [4, [44.961494, -93.176991]], [5, [44.978117, -93.106602]], [6, [44.978945, -93.047281]], [7, [44.942040, -93.033178]]]

    #44.951655, -93.096323

    # Create the pandas DataFrame
    Loc = pd.DataFrame(data, columns = ['Ward', 'Location'])
    Loc.iloc[Ward,1:]


    # generate a new map
    SP_map = folium.Map(location=Loc.iloc[Ward,1], zoom_start=zo,tiles='Stamen Terrain') #tiles="OpenStreetMap")

    SP_map.choropleth(
        geo_data=sp_geo,
        data=B,
        columns=['Precinct','Vote_Mayor%'],
        key_on="feature.properties.Precinct",
        fill_color='YlOrRd',
        fill_opacity=0.7,
        line_opacity=0.2,
        legend_name='2019 Saint Paul ' + A +' Voter% that voted in 2017 Mayor: 11/10/19',
        highlight= True
    )

    # display map
    return SP_map

#council last

def map_2019_SP_CityCouncilLast_byPrecinct(Ward=0):
    #setup
    sp_geo = r'Shapefiles/SaintPaul_VotingPrecincts.json'

    if Ward==0:
        B=P_19
        A='City Council'
        zo= 12
    else:
        B= P_19[(P_19['Ward'] == Ward)]
        A= 'Ward ' + str(Ward) +' '
        zo=13

    #Set up Variable Zoom Locations
    data = [[0, [44.948530, -93.096058]], [1, [44.958326, -93.122926]], [2, [44.933159, -93.115535]], [3, [44.918270, -93.176131]], [4, [44.961494, -93.176991]], [5, [44.978117, -93.106602]], [6, [44.978945, -93.047281]], [7, [44.942040, -93.033178]]]

    #44.951655, -93.096323

    # Create the pandas DataFrame
    Loc = pd.DataFrame(data, columns = ['Ward', 'Location'])
    Loc.iloc[Ward,1:]


    # generate a new map
    SP_map = folium.Map(location=Loc.iloc[Ward,1], zoom_start=zo,tiles='Stamen Terrain') #tiles="OpenStreetMap")

    SP_map.choropleth(
        geo_data=sp_geo,
        data=B,
        columns=['Precinct','Vote_LastCity%'],
        key_on="feature.properties.Precinct",
        fill_color='YlOrRd',
        fill_opacity=0.7,
        line_opacity=0.2,
        legend_name='2019 Saint Paul ' + A +' Voter% that voted in 2015 city council: 11/10/19',
        highlight= True
    )

    # display map
    return SP_map

#High Density Percentage

def map_2019_SP_CityCouncilDensity_byPrecinct(Ward=0):
    #setup
    sp_geo = r'Shapefiles/SaintPaul_VotingPrecincts.json'

    if Ward==0:
        B=P_19.query('H_Dens >0')
        zo= 12
    else:
        B= P_19[(P_19['Ward'] == Ward)]
        zo=13

    #Set up Variable Zoom Locations
    data = [[0, [44.948530, -93.096058]], [1, [44.958326, -93.122926]], [2, [44.933159, -93.115535]], [3, [44.918270, -93.176131]], [4, [44.961494, -93.176991]], [5, [44.978117, -93.106602]], [6, [44.978945, -93.047281]], [7, [44.942040, -93.033178]]]

    #44.951655, -93.096323

    # Create the pandas DataFrame
    Loc = pd.DataFrame(data, columns = ['Ward', 'Location'])
    Loc.iloc[Ward,1:]


    # generate a new map
    SP_map = folium.Map(location=Loc.iloc[Ward,1], zoom_start=zo,tiles='Stamen Terrain') #tiles="OpenStreetMap")

    SP_map.choropleth(
        geo_data=sp_geo,
        data=B,
        columns=['Precinct','H_Density%'],
        key_on="feature.properties.Precinct",
        fill_color='YlOrRd',
        fill_opacity=0.7,
        line_opacity=0.2,
        legend_name='2019 Saint Paul High density registered voter%: 11/10/19',
        highlight= True
    )

    # display map
    return SP_map


#High Density Percentage

def map_2019_SP_CityCouncilDensityDiff_byPrecinct(Ward=0):
    #setup
    sp_geo = r'Shapefiles/SaintPaul_VotingPrecincts.json'

    if Ward==0:
        B=PP.query('H_Dens >5')
        A='City Council'
        zo= 12
    else:
        B= PP[(PP['Ward'] == Ward)]
        A= 'Ward ' + str(Ward) +' '
        zo=13

    #Set up Variable Zoom Locations
    data = [[0, [44.948530, -93.096058]], [1, [44.958326, -93.122926]], [2, [44.933159, -93.115535]], [3, [44.918270, -93.176131]], [4, [44.961494, -93.176991]], [5, [44.978117, -93.106602]], [6, [44.978945, -93.047281]], [7, [44.942040, -93.033178]]]

    #44.951655, -93.096323

    # Create the pandas DataFrame
    Loc = pd.DataFrame(data, columns = ['Ward', 'Location'])
    Loc.iloc[Ward,1:]


    # generate a new map
    SP_map = folium.Map(location=Loc.iloc[Ward,1], zoom_start=zo,tiles='Stamen Terrain') #tiles="OpenStreetMap")

    SP_map.choropleth(
        geo_data=sp_geo,
        data=B,
        columns=['Precinct','Density_VoteDiff%'],
        key_on="feature.properties.Precinct",
        fill_color='YlOrRd',
        fill_opacity=0.7,
        line_opacity=0.2,
        legend_name='2019 Saint Paul ' + A +' Density Vote% Difference: 11/10/19',
        highlight= True
    )

    # display map
    return SP_map