
## Table of contents <a name="content"></a>
* [Purpose](#purpose)
* [Data](#data)
* [Audience Participation](#audience)
* [Overview](#overview)
* [Plot: Minneapolis Rental Building Age by Building Size](#age)
* [Map: Minneapolis Tier 2 & 3 geo-coordinates](#tier)
* [Landlord/ Housing Provider Breakdown](#owner)
* [List: Dominant Providers](#big)
* [Map: Properties by Single Owner](#prop)
* [Plot: New Rental Housing Construction by Community](#new)
* [Map: New Rental Housing Construction](#newmap)
* [Interactive Community Data](#comm)
* [Map: Powderhorn](#powder)
* [Map: Northeast](#Northeast)
* [Map: Near North](#Near North)
* [Map: Camden](#Camden)
* [Map: Calhoun Isle](#Calhoun Isle)
* [Map: University](#University)
* [Map: Southwest](#Southwest)
* [Map: Central](#Central)
* [Map: Nokomis](#Nokomis)
* [Map: Longfellow](#Longfellow)
* [Map: Phillips](#Phillips)
* [Audience Participation Reminder](#reminder)
* [Functions_Run](#runall)
Table of contents 
- Purpose
- Data
- Frogtown All Crime
- Graph: Frogtown Longitudinal Crime Uptodate
- Table: Frogtown Longitudinal Crime Uptodate by Month
- Graph: Saint Paul Longitudinal Crime Uptodate
- Map: Frogtown 2018 Crime Map
- Map: Frogtown 2019 to Present Crime Map w/ Proactive visits
- Map: Frogtown Violent Crime 2017 to Present Crime Map
- Map: Frogtown Multicrime Map
- Frogtown Hotspots w/ map
- Frogtown Shooting Report/ include Covid Breakdown
- Saint Paul Shooting Report
- Concluding Remarks
- Functions
- Functions_Run
Purpose 
As a Frogtown resident, it is important that residents are aware on what is happening around our community and how we address it. Every year, there is commotion about safety. Some community members feel that the community is getting worse, while others are saying its getting better. While the city and police department might be saying something totally different. In our current political climate, it's controversial to talk about crime given it's strong correlation with poverty. Unfortunately, this can disenfranchise some community members whom are victims of crime and live in heavy crime areas on a daily basis. These reports and graphs are met to just shed light on the issue and encourage community members to see and interact with the data themselves. Hopefully, the community and/or agencies will take action. Note: Parts of Midway, Rondo, and Union City are included.
Some questions that you may consider:
- What are vulnerable areas or hotspots in the community?
- Are certain crimes more frequent in your area, and how should you or the community address it?
- What are some trends in the your community?
- What is the frequency of calling the police in nearby area? Is there over-reporting/ under-reporting?
- How can we address these issues as a community (i.e. organizing; etc)?
Open Source Data Initiative
It is important that data is accessible and provided to the public. This report and others will be available on Github allowing others to contribute, replicate, and use code for their own respective neighborhood. If anyone is interested in mapping out East Side, Payne Phalen, etc., please reach out to me.
You can use the data provided by this report, but understand that I'm not an official agency and not liable for incorrect data.
About the Dataset: 
The Crime Incident Report - Dataset was obtained from the Saint Paul Website. It is publicly available. The report contains incidents from Aug 14 2014 through the most recent date, as released by the Saint Paul Police Department.
A few notes about the dataset:
- The dataset have several human errors such as mis-categorizing addresses and address being designated to the wrong police grid.
- The dataset DOES NOT PROVIDE EXACT ADDRESSES/ GEO-COORDINATES. However, I've constructed an algorithm that get a reliable proxy address for most entries.
- The process included entering coordinate manually; if any residents are interested in mapping out their own community please feel free to connect with me.
- Google Maps geocoder was used
- The algorithm does not cover the intersections of Capitol Heights and Mt. Airy region. Some data was excluded from region due to inadequate mapping. They have many intersections and curved streets; it would take time to geo-code it.
- The analysis/algorithm is restricted near the Frogtown area.
Saint Paul Police grid w/ total crime numbers all years [excluding proactive visits] 
The dataset comprise this area.
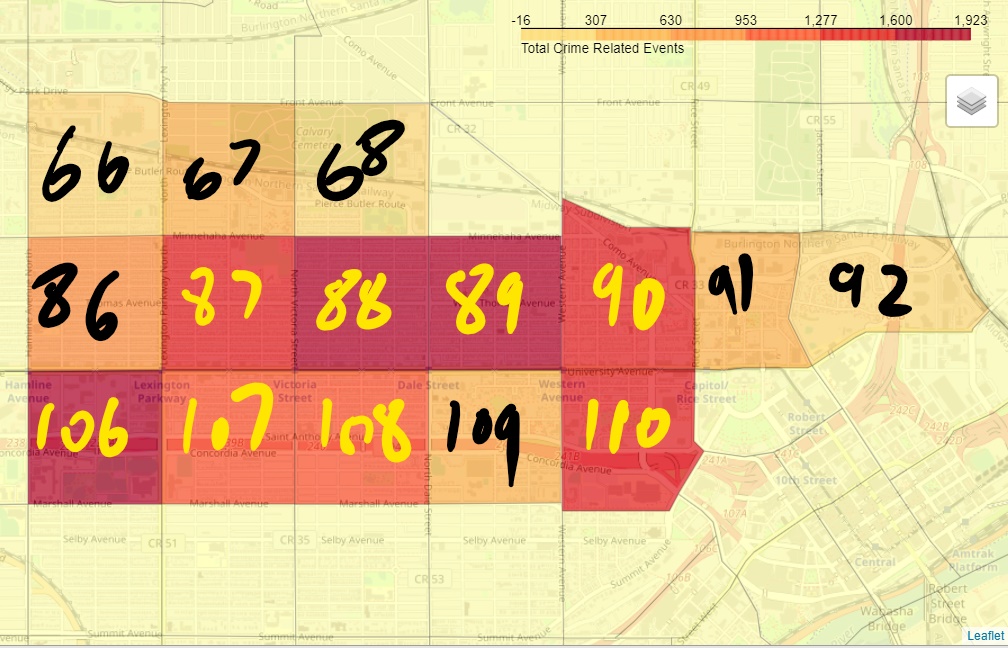
Display Total Incidents of all years
NOTE: The following changes were made in the crime category to consolidate categories
- Graffiti was combined into Vandalism
- Violent Crimes combined the categories: Rape, Homicide, Aggressive Assault
- Domestic Assault includes both Simple and Aggressive Assaults
- Community Engagement Events and Proactive Police Visit are not crimes. Proactive Police Visit is not response to 911 call. They will be excluded for vast majority of the analysis
print('List of Events in Frogtown (nearby) from 2019 to Present')
fg.query('Year>=2019')['Incident'].value_counts()
List of Events in Frogtown (nearby) from 2019 to Present
Proactive Police Visit 9268 Theft 1915 Vandalism 730 Auto Theft 693 Narcotics 533 Discharge 444 Burglary 426 Domestic Assault 386 Community Engagement Event 198 Robbery 178 Violent 165 Arson 26 Name: Incident, dtype: int64
Frogtown Yearly Crime Comparison Up to Current Date 
How much crime is there so far in comparison to the previous year on this date? Are certain areas increasing or decreasing? Note: the function can choose any day prior to the current date.
We choose the max date for the dataset. We can choose an earlier date if desired
plot_toDate_Year_Crime(Incident='All',Day=Max)
This graph maps All incidents up to 5/12/20XX

Frogtown Total Crimes toDate by Month 
What are some monthly trends
table_toDate_Month_Crime(Incident='All',Day=Max)
This table maps All incidents up to Day 9/10/20XX
| Month | 1 | 2 | 3 | 4 | ... | 6 | 7 | 8 | 9 | |||||||||||||
|---|---|---|---|---|---|---|---|---|---|---|---|---|---|---|---|---|---|---|---|---|---|---|
| Year | 2018 | 2019 | 2020 | 2018 | 2019 | 2020 | 2018 | 2019 | 2020 | 2018 | ... | 2020 | 2018 | 2019 | 2020 | 2018 | 2019 | 2020 | 2018 | 2019 | 2020 | |
| Community | Grid | |||||||||||||||||||||
| Midway | 66.0 | 1 | 0 | 0 | 1 | 1 | 0 | 0 | 1 | 1 | 2 | ... | 2 | 1 | 0 | 1 | 0 | 4 | 1 | 0 | 0 | 0 |
| 86.0 | 27 | 14 | 18 | 12 | 13 | 10 | 18 | 14 | 12 | 16 | ... | 25 | 19 | 30 | 23 | 19 | 20 | 13 | 7 | 6 | 2 | |
| Summit-University | 107.0 | 18 | 24 | 15 | 17 | 10 | 5 | 22 | 8 | 17 | 20 | ... | 29 | 24 | 13 | 24 | 19 | 22 | 12 | 9 | 1 | 4 |
| 108.0 | 10 | 25 | 19 | 23 | 12 | 22 | 15 | 17 | 15 | 20 | ... | 23 | 18 | 15 | 28 | 28 | 22 | 28 | 7 | 1 | 4 | |
| 109.0 | 10 | 3 | 8 | 6 | 8 | 6 | 2 | 5 | 5 | 6 | ... | 5 | 11 | 4 | 4 | 2 | 5 | 5 | 4 | 0 | 4 | |
| 110.0 | 22 | 17 | 14 | 19 | 17 | 15 | 22 | 8 | 11 | 18 | ... | 19 | 35 | 17 | 22 | 19 | 16 | 19 | 9 | 2 | 5 | |
| Thomas-Frogtown | 67.0 | 11 | 6 | 9 | 9 | 7 | 12 | 15 | 4 | 9 | 7 | ... | 7 | 11 | 9 | 16 | 10 | 13 | 2 | 4 | 2 | 2 |
| 68.0 | 5 | 3 | 4 | 0 | 3 | 6 | 8 | 2 | 9 | 1 | ... | 9 | 8 | 1 | 5 | 2 | 3 | 6 | 2 | 2 | 3 | |
| 87.0 | 27 | 19 | 25 | 33 | 21 | 13 | 14 | 18 | 27 | 19 | ... | 26 | 31 | 21 | 24 | 33 | 24 | 27 | 12 | 5 | 4 | |
| 88.0 | 18 | 26 | 28 | 26 | 19 | 33 | 25 | 15 | 36 | 26 | ... | 67 | 40 | 31 | 46 | 36 | 40 | 53 | 17 | 2 | 15 | |
| 89.0 | 50 | 32 | 41 | 24 | 20 | 36 | 26 | 14 | 37 | 29 | ... | 53 | 46 | 37 | 35 | 54 | 46 | 46 | 9 | 3 | 15 | |
| 90.0 | 32 | 16 | 22 | 18 | 20 | 20 | 29 | 15 | 27 | 16 | ... | 67 | 29 | 31 | 93 | 29 | 36 | 57 | 6 | 5 | 16 | |
| 91.0 | 6 | 3 | 4 | 4 | 1 | 3 | 3 | 3 | 4 | 14 | ... | 11 | 16 | 5 | 16 | 3 | 7 | 13 | 1 | 0 | 3 | |
| 92.0 | 0 | 0 | 1 | 0 | 0 | 1 | 1 | 1 | 0 | 2 | ... | 0 | 0 | 2 | 0 | 0 | 1 | 0 | 0 | 0 | 0 | |
| Union Park | 106.0 | 33 | 35 | 49 | 23 | 41 | 57 | 43 | 31 | 49 | 34 | ... | 18 | 47 | 49 | 15 | 44 | 65 | 16 | 9 | 9 | 13 |
15 rows × 27 columns
Saint Paul Yearly Crime Comparison Up to Current Date 
How do we compare to our neighbors and what are some trends?
plot_toDate_Days_SPCrime_Norm(Incident='Discharge',Day=Max)
This graph displays total Discharge normalized incidents of Saint Paul neighborhoods within 132 days from date 5/12/20XX

Frogtown Annual Crime Map (Default 2020) 
At least four crimes must occur in one location to be displayed
NOTE: It's interactive, click on the circles for more details on the total number and type of crimes committed
plot_Frogtown_year(2020)
Frogtown Violent Crimes Map from 2018 to Present 
Violent crimes are less salient or apparent to community members. We can see which areas/ blocks are safer.
- Orange= 2018
- Green= 2019
- Purple= 2020
plot_Frogtown_long_crime('Violent')
Frogtown 2020 Multi-Crime Map 
- Purple= Discharge
- Green= Autotheft
- Orange= Theft
- Blue= Burglary
- Brown= Narcotics
- Red= Vandalism
plot_multicrime_byYear(2020)
Hotspots near Frogtown from 2019 to present 
Notice the address codes are masked and count is limited to 15
B=fgc.query('Year in [2019,2020]')
B=B[['Block','Count']].groupby(['Block']).sum().reset_index()
B.columns=['Block_Intersection','Count']
B.query('Count>14').sort_values(['Count'], ascending=False)
| Block_Intersection | Count | |
|---|---|---|
| 204 | 130x university av w | 661 |
| 662 | 62x rice st | 85 |
| 231 | 17x charles av | 74 |
| 225 | 15x sherburne av | 67 |
| 281 | 27x lexington pa n | 63 |
| 170 | 124x stanthony av | 53 |
| 163 | 123x university av w | 51 |
| 1137 | 95x lexington pa n | 46 |
| 1249 | dale_university | 46 |
| 873 | 75x milton st n | 44 |
| 387 | 39x lexington pa n | 44 |
| 510 | 50x rice st | 35 |
| 996 | 83x university av w | 31 |
| 1302 | hamline_university | 30 |
| 235 | 19x edmund av | 30 |
| 365 | 37x lexington pa n | 29 |
| 290 | 28x ravoux st | 26 |
| 79 | 107x university av w | 26 |
| 1384 | rice_charles | 25 |
| 557 | 54x university av w | 25 |
| 649 | 61x university av w | 25 |
| 653 | 62x aurora av | 25 |
| 470 | 46x dale st n | 24 |
| 1160 | 97x university av w | 23 |
| 1057 | 88x university av w | 23 |
| 898 | 76x university av w | 23 |
| 1196 | arundel_university | 21 |
| 1387 | rice_sherburne | 20 |
| 619 | 59x university av w | 20 |
| 709 | 65x galtier st | 19 |
| 475 | 46x thomas av | 19 |
| 316 | 31x dale st n | 19 |
| 1248 | dale_thomas | 19 |
| 1172 | 98x university av w | 19 |
| 188 | 128x concordia av | 18 |
| 1339 | lexington_university | 18 |
| 443 | 44x galtier st | 18 |
| 482 | 47x marion st | 16 |
| 729 | 66x thomas av | 16 |
| 521 | 51x rice st | 16 |
| 425 | 42x rice st | 16 |
| 656 | 62x chatsworth st n | 16 |
| 813 | 71x sherburne av | 16 |
| 1420 | victoria_university | 16 |
| 438 | 43x university av w | 15 |
| 99 | 113x university av w | 15 |
| 435 | 43x lafond av | 15 |
| 749 | 67x thomas av | 15 |
Frogtown Hotspot Interactive map from 2019 to present 
- The bubbles are not to scale across the different categories to make this map more accessible. You may need to zoom in to distinguish points
- The graph is Interactive; if you click on a point, it will list the number and type of incidents in that area
- Legend
- Orange: Number of Incidents greater than 10 and less than 20
- Green: Number of Incidents greater than 20 and less than 50
- Purple: Number of Incident greater than 50
plot_Frogtown_hot_spot()
Frogtown Gun Discharge Reports
We hear it all the time from many people that our awareness of shootings is based on connection to social media and officials suggesting it is safer now than years prior. Is this true? Well, let's find out. It's worth noting that weather conditions can influence the frequency of when shootings occur. Finally, the discharge category excludes a firearm being used to assist in another crime.
Why focus on shootings?
Shootings can harm innocent bystanders and creates a significant sense of fear because it can be heard from a distance. It is one of the more salient crimes.
How is a discharge report determined?
If a police report was made, that means there were 2 or more witnesses and/or evidence was found (spent shell casings, bullet holes in cars, homes, etc).
First let's construct a table showing the total number of shootings up to current date in comparison to previous years. Notice that many grids are experiencing different trends, so it can be true that some neighbors are exposed to more shootings this year and others less.
plot_toDate_Year_Crime(Incident='Discharge',Day=Max)
This graph maps Discharge incidents up to 12/9/20XX

As a results of the the Covid outbreak and civil unrest, I have broken the data into three stages: preCovid, Covid only, and post_GeorgeFloyd murder
#PreCovid
plot_toDate_Days_FGCrime(Incident='Discharge',Day=CV, CDate=CV)
This graph displays total Discharge incidents of the Frogtown Grid within 73 days from date 3/14/20XX

#Covid Only
plot_toDate_Days_FGCrime(Incident='Discharge',Day=GE-CV, CDate=GE)
This graph displays total Discharge incidents of the Frogtown Grid within 73 days from date 5/25/20XX

#post-George Floyd
plot_toDate_Days_FGCrime(Incident='Discharge',Day=Max-GE, CDate=Max)
This graph displays total Discharge incidents of the Frogtown Grid within 93 days from date 8/26/20XX

Shootings within last 120 days
plot_Frogtown_long_crime_todate_2020(Incident='Discharge',Day=60, CDate=Max)
This map displays Discharge incidents within 60 days from date 8/26/20XX
The table below displays the number of shootings by grid in Frogtown broken by month over the last two years
table_toDate_Month_Crime(Incident='Discharge',Day=Max)
This table maps Discharge incidents up to Day 6/10/20XX
| Month | 1 | 2 | 3 | 4 | 5 | 6 | |||||||||||||
|---|---|---|---|---|---|---|---|---|---|---|---|---|---|---|---|---|---|---|---|
| Year | 2018 | 2019 | 2020 | 2018 | 2019 | 2020 | 2018 | 2019 | 2020 | 2018 | 2019 | 2020 | 2018 | 2019 | 2020 | 2018 | 2019 | 2020 | |
| Community | Grid | ||||||||||||||||||
| Midway | 66.0 | 0 | 0 | 0 | 0 | 0 | 0 | 0 | 0 | 0 | 1 | 0 | 0 | 0 | 0 | 1 | 0 | 0 | 1 |
| 86.0 | 0 | 1 | 1 | 0 | 0 | 1 | 0 | 1 | 0 | 0 | 1 | 1 | 2 | 0 | 3 | 0 | 0 | 6 | |
| Summit-University | 107.0 | 1 | 2 | 3 | 3 | 0 | 1 | 1 | 0 | 2 | 3 | 0 | 0 | 1 | 5 | 7 | 3 | 3 | 6 |
| 108.0 | 0 | 2 | 5 | 1 | 2 | 1 | 2 | 1 | 0 | 2 | 3 | 2 | 0 | 1 | 5 | 1 | 0 | 2 | |
| 109.0 | 0 | 0 | 0 | 1 | 0 | 0 | 0 | 0 | 1 | 0 | 0 | 0 | 0 | 0 | 4 | 0 | 0 | 0 | |
| 110.0 | 1 | 0 | 1 | 0 | 1 | 0 | 0 | 0 | 0 | 1 | 1 | 0 | 1 | 0 | 0 | 1 | 0 | 0 | |
| Thomas-Frogtown | 67.0 | 0 | 0 | 0 | 0 | 0 | 1 | 0 | 0 | 2 | 0 | 1 | 1 | 2 | 1 | 0 | 0 | 0 | 0 |
| 68.0 | 1 | 0 | 1 | 0 | 0 | 0 | 0 | 0 | 5 | 0 | 0 | 1 | 0 | 0 | 0 | 0 | 0 | 2 | |
| 87.0 | 1 | 3 | 3 | 1 | 1 | 0 | 1 | 1 | 3 | 2 | 7 | 1 | 2 | 4 | 7 | 0 | 0 | 3 | |
| 88.0 | 2 | 3 | 3 | 0 | 2 | 1 | 1 | 0 | 5 | 3 | 1 | 3 | 4 | 1 | 9 | 2 | 0 | 5 | |
| 89.0 | 6 | 1 | 9 | 1 | 1 | 7 | 0 | 1 | 8 | 0 | 2 | 9 | 5 | 4 | 10 | 4 | 1 | 4 | |
| 90.0 | 0 | 0 | 0 | 0 | 0 | 2 | 1 | 1 | 2 | 1 | 2 | 1 | 1 | 0 | 1 | 1 | 0 | 0 | |
| 91.0 | 0 | 0 | 0 | 0 | 0 | 0 | 1 | 1 | 0 | 3 | 0 | 0 | 0 | 1 | 2 | 0 | 0 | 0 | |
| Union Park | 106.0 | 1 | 0 | 0 | 0 | 1 | 0 | 0 | 0 | 0 | 0 | 0 | 0 | 0 | 0 | 2 | 0 | 0 | 3 |
Frogtown UptoDate gun discharge map 2020 to Present (interactive) 
A police Grid can cover a lot of area. From the map we can spot parts of the community that are currently vulnerable and those in the past.
- Orange= 2018
- Green= 2019
- Purple= 2020
plot_Frogtown_long_crime_todate(Incident='Discharge',Day=Max)
This map displays Discharge incidents up to 12/9/20XX
Frogtown UptoDate Daytime Discharge Map 
Daytime shooting are particularly concerning to our community as there as there are greater frequency of innocent bystanders being harmed and can influence community members behavior to go outside or parents decision to let their kids play.
- Orange= 2018
- Green= 2019
- Purple= 2020
plot_Frogtown_long_crime_daytime_todate(Incident='Discharge',Day=Max)
This map displays Discharge incidents up to 12/9/20XX from 7AM to 8PM
Frogtown yearly gun discharge from 2018 to Present 
- Orange= 2018
- Green= 2019
- Purple= 2020
plot_Frogtown_long_crime(Incident='Discharge')
Firearm Usage (Any crime involving it) 
Often firearms are used when committing another crime, but does not need to be fired.
print('The total crimes involving firearms in Frogtown Area')
fgc_fire['Incident'].value_counts()
The total crimes involving firearms in Frogtown Area
Discharge 1231 Robbery 271 Violent 251 Name: Incident, dtype: int64
plot_toDate_Year_Firearm(Day=Max)
This graph maps Firearm incidents up to 1/29/20XX

plot_toDate_Year_SPFirearm()
This graph maps Firearm incidents of Saint Paul neighborhoods up to 8/26/20XX

Saint Paul Discharge Incidents 
Similar to the Frogtown analysis, we will construct a normalized trend graph, and break the data to the Covid and civil unrest events
What are some trends at the city-wide level? (normalized per 10000)
plot_toDate_Days_SPCrime_Norm(Incident='Discharge')
This graph displays total Discharge normalized incidents of Saint Paul neighborhoods within 239 days from date 8/26/20XX

#PreCovid
plot_toDate_Days_SPCrime(Incident='Discharge',Day=CV, CDate=CV)
This graph displays total Discharge incidents of Saint Paul neighborhoods within 73 days from date 3/14/20XX

#Covid
plot_toDate_Days_SPCrime(Incident='Discharge',Day=GE-CV, CDate=GE)
This graph displays total Discharge incidents of Saint Paul neighborhoods within 73 days from date 5/25/20XX

#Post: GeorgeFloyd
plot_toDate_Days_SPCrime(Incident='Discharge',Day=Max-GE, CDate=Max)
This graph displays total Discharge incidents of Saint Paul neighborhoods within 16 days from date 6/10/20XX

Concluding Remarks 
From the data above, we can visually spot sections in the community and specific locations where crime is more frequent. It is important that we have a community discussion before taking any further action. If you have any question in regards to visualization and other things, please feel free to reach out to me.
Functions 
Plot Multiple Crimes by Year
def plot_multicrime_byYear(Year=2019):
# generate a new map
FG_map = folium.Map(location=[44.958326, -93.122926], zoom_start=14,tiles="OpenStreetMap")
#setup
B= fgc[(fgc['Year'] == Year)]
Index =['Block','Latitude','Longitude', 'Count','Theft','Vandalism','Narcotics','Auto Theft','Burglary','Discharge']
T=B.query('Theft==1')
T=T[Index].groupby(['Block','Latitude','Longitude']).sum().reset_index()
V=B.query('Vandalism==1')
V=V[Index].groupby(['Block','Latitude','Longitude']).sum().reset_index()
N=B.query('Narcotics==1')
N=N[Index].groupby(['Block','Latitude','Longitude']).sum().reset_index()
A=B.query('Incident=="Auto Theft"')
A=A[Index].groupby(['Block','Latitude','Longitude']).sum().reset_index()
D=B.query('Discharge==1')
D=D[Index].groupby(['Block','Latitude','Longitude']).sum().reset_index()
Br=B.query('Burglary==1')
Br=Br[Index].groupby(['Block','Latitude','Longitude']).sum().reset_index()
#Create Frogtown GeoMap
FG_map = folium.Map(location=[44.958326, -93.122926], zoom_start=14,tiles="OpenStreetMap")
for index, row in T.iterrows():
popup_text = "Address: {}<br> total theft incidents: {}"
popup_text = popup_text.format(row["Block"],row['Count'])
folium.CircleMarker(location=(row["Latitude"],row["Longitude"]),
radius=row['Count'] +3,
color="#E37222",
popup=popup_text,
fill=True).add_to(FG_map)
for index, row in V.iterrows():
popup_text = "Address: {}<br> total vandalism incidents: {}"
popup_text = popup_text.format(row["Block"],row['Count'])
folium.CircleMarker(location=(row["Latitude"],row["Longitude"]),
radius=row['Count'] +3,
color="#FF0000",
popup=popup_text,
fill=True).add_to(FG_map)
for index, row in N.iterrows():
popup_text = "Address: {}<br> total narcotics incidents: {}"
popup_text = popup_text.format(row["Block"],row['Narcotics'])
folium.CircleMarker(location=(row["Latitude"],row["Longitude"]),
radius=row['Narcotics'] + 3,
color="#654321",
popup=popup_text,
fill=True).add_to(FG_map)
for index, row in A.iterrows():
popup_text = "Address: {}<br> total autotheft incidents: {}"
popup_text = popup_text.format(row["Block"],row['Count'])
folium.CircleMarker(location=(row["Latitude"],row["Longitude"]),
radius=row['Count'] +3,
color='#007849',
popup=popup_text,
fill=True).add_to(FG_map)
for index, row in D.iterrows():
popup_text = "Address: {}<br> total discharge incidents: {}"
popup_text = popup_text.format(row["Block"],row['Count'])
folium.CircleMarker(location=(row["Latitude"],row["Longitude"]),
radius=row['Count'] +3,
color="#800080",
popup=popup_text,
fill=True).add_to(FG_map)
for index, row in Br.iterrows():
popup_text = "Address: {}<br> total burglary incidents: {}"
popup_text = popup_text.format(row["Block"],row['Count'])
folium.CircleMarker(location=(row["Latitude"],row["Longitude"]),
radius=row['Count'] +3,
color="#0000ff",
popup=popup_text,
fill=True).add_to(FG_map)
return FG_map
Plot Crime Map by Year
def plot_Frogtown_year(Year=2018):
# generate a new map
FG_map = folium.Map(location=[44.958326, -93.122926], zoom_start=14,tiles="OpenStreetMap")
#setup
B= fgc[(fgc['Year'] == Year)]
Index =['Block','Latitude','Longitude', 'Count','Theft','Vandalism','Narcotics','Auto Theft','Burglary','Discharge'\
,'Robbery','Domestic Assault','Violent','Arson']
B=B[Index].groupby(['Block','Latitude','Longitude']).sum().reset_index()
B=B.query('Count>3')
# for each row in the data, add a cicle marker
for index, row in B.iterrows():
popup_text = "Year: {}<br> Address: {}<br> total incidents: {}<br> Theft: {}<br> Vandalism: {}\
<br> Narcotics: {}<br> Auto Theft: {}<br> Burglary: {}<br> Discharge: {}<br> Robbery: {}\
<br> Domestic Assault: {}<br> Violent: {}<br> Arson: {}"
popup_text = popup_text.format(str(Year),row["Block"], row['Count'], row['Theft'], row['Vandalism'], row['Robbery'],\
row['Auto Theft'], row['Burglary'], row['Discharge'], row['Domestic Assault'],\
row['Domestic Assault'],row['Violent'],row['Arson'])
folium.CircleMarker(location=(row["Latitude"],row["Longitude"]),
radius=row['Count']+3,
color="#E37222",
popup=popup_text,
fill=True).add_to(FG_map)
return FG_map
#interact(plot_Frogtown_year, Year=widgets.IntSlider(min=2014,max=2019,step=1,value=2018));
Plot Crime Map by Year w/ proactive visits
def plot_Frogtown_year_proactive(Year=2018):
FG_map = folium.Map(location=[44.958326, -93.122926], zoom_start=14,tiles="OpenStreetMap")
B= fgc[(fgc['Year'] == Year)]
Index =['Block','Latitude','Longitude', 'Count','Theft','Vandalism','Narcotics','Auto Theft','Burglary','Discharge'\
,'Robbery','Domestic Assault','Violent','Arson']
B=B[Index].groupby(['Block','Latitude','Longitude']).sum().reset_index()
A= fgp[(fgp['Year'] == Year)]
A= A.groupby(['Block','Latitude','Longitude']).size().reset_index()
A.columns=['Block','Latitude','Longitude','Count']
for index, row in B.iterrows():
popup_text = "Year: {}<br> Address: {}<br> total incidents: {}<br> Theft: {}<br> Vandalism: {}\
<br> Narcotics: {}<br> Auto Theft: {}<br> Burglary: {}<br> Discharge: {}<br> Robbery: {}\
<br> Domestic Assault: {}<br> Violent: {}<br> Arson: {}"
popup_text = popup_text.format(str(Year),row["Block"], row['Count'], row['Theft'], row['Vandalism'], row['Robbery'],\
row['Auto Theft'], row['Burglary'], row['Discharge'], row['Domestic Assault'],\
row['Domestic Assault'],row['Violent'],row['Arson'])
folium.CircleMarker(location=(row["Latitude"],row["Longitude"]),
radius=row['Count']+3,
color="#E37222",
popup=popup_text,
fill=True).add_to(FG_map)
for index, row in A.iterrows():
popup_text = "Address: {}<br> total proactive calls: {}"
popup_text = popup_text.format(row["Block"], row['Count'])
folium.CircleMarker(location=(row["Latitude"],row["Longitude"]),
radius=row['Count']+3,
color="#007849",
popup=popup_text,
fill=True).add_to(FG_map)
return FG_map
Plot Longitudinal Crime Compared by Year
def plot_Frogtown_long_crime(Incident='Discharge'):
Index =['Block','Latitude','Longitude', 'Count','Theft','Vandalism','Narcotics','Auto Theft','Burglary','Discharge'\
,'Robbery','Domestic Assault','Violent','Arson','Year']
FG_map = folium.Map(location=[44.958326, -93.122926], zoom_start=14,tiles="OpenStreetMap")
B= fgc[(fgc['Incident'] == Incident)]
B17=B.query('Year == 2017')
B17=B17[Index].groupby(['Year','Block','Latitude','Longitude']).sum().reset_index()
B18=B.query('Year == 2018')
B18=B18[Index].groupby(['Year','Block','Latitude','Longitude']).sum().reset_index()
B19=B.query('Year == 2019')
B19=B19[Index].groupby(['Year','Block','Latitude','Longitude']).sum().reset_index()
for index, row in B17.iterrows():
popup_text = "Year: {}<br> Address: {}<br> total incidents: {}"
popup_text = popup_text.format(row["Year"],row["Block"], row['Count'])
folium.CircleMarker(location=(row["Latitude"],row["Longitude"]),
radius=row['Count']+3,
color="#E37222",
popup=popup_text,
fill=True).add_to(FG_map)
for index, row in B18.iterrows():
popup_text = "Year: {}<br> Address: {}<br> total incidents: {}"
popup_text = popup_text.format(row["Year"],row["Block"], row['Count'])
folium.CircleMarker(location=(row["Latitude"], row["Longitude"]),
radius=row['Count']+3,
color="#007849",
popup=popup_text,
fill=True).add_to(FG_map)
for index, row in B19.iterrows():
popup_text = "Year: {}<br> Address: {}<br> total incidents: {}"
popup_text = popup_text.format(row["Year"],row["Block"], row['Count'])
folium.CircleMarker(location=(row["Latitude"],row["Longitude"]),
radius=row['Count']+3,
color="#800080",
popup=popup_text,
fill=True).add_to(FG_map)
return FG_map
#interact(plot_Frogtown_long_crime, Incident=['Discharge','Violent','Theft','Vandalism','Narcotics','Auto Theft','Burglary','Robbery','Domestic Assault','Arson'])
Plot Longitudinal Crime Map Compared by Year; todate
def plot_Frogtown_long_crime_todate(Incident='All',Day=Max):
Index =['Block','Latitude','Longitude', 'Count','Theft','Vandalism','Narcotics','Auto Theft','Burglary','Discharge'\
,'Robbery','Domestic Assault','Violent','Arson','Year']
# generate a new map
FG_map = folium.Map(location=[44.958326, -93.122926], zoom_start=14,tiles="OpenStreetMap")
#setup
if Incident=='All':
B= fgc
else:
B= fgc[(fgc['Incident'] == Incident)]
Date= fgc[(fgc['DayYear'] == Day)]['FDate'][0:1].iloc[0,]
B= B[(B['DayYear'] <= Day)]
B17=B.query('Year == 2017')
B17=B17[Index].groupby(['Year','Block','Latitude','Longitude']).sum().reset_index()
B18=B.query('Year == 2018')
B18=B18[Index].groupby(['Year','Block','Latitude','Longitude']).sum().reset_index()
B19=B.query('Year == 2019')
B19=B19[Index].groupby(['Year','Block','Latitude','Longitude']).sum().reset_index()
print('This map displays {} incidents up to {}20XX'.format(Incident,Date))
for index, row in B17.iterrows():
popup_text = "Year: {}<br> Address: {}<br> total incidents: {}"
popup_text = popup_text.format(row["Year"],row["Block"], row['Count'])
folium.CircleMarker(location=(row["Latitude"],row["Longitude"]),
radius=row['Count']+3,
color="#E37222",
popup=popup_text,
fill=True).add_to(FG_map)
for index, row in B18.iterrows():
popup_text = "Year: {}<br> Address: {}<br> total incidents: {}"
popup_text = popup_text.format(row["Year"],row["Block"], row['Count'])
folium.CircleMarker(location=(row["Latitude"], row["Longitude"]),
radius=row['Count']+3,
color="#007849",
popup=popup_text,
fill=True).add_to(FG_map)
for index, row in B19.iterrows():
popup_text = "Year: {}<br> Address: {}<br> total incidents: {}"
popup_text = popup_text.format(row["Year"],row["Block"], row['Count'])
folium.CircleMarker(location=(row["Latitude"],row["Longitude"]),
radius=row['Count']+3,
color="#800080",
popup=popup_text,
fill=True).add_to(FG_map)
return FG_map
Plot Longitudinal Daytime Crime Map Compared by Year; todate
def plot_Frogtown_long_crime_daytime_todate(Incident='All',Day=Max):
Index =['Block','Latitude','Longitude', 'Count','Theft','Vandalism','Narcotics','Auto Theft','Burglary','Discharge'\
,'Robbery','Domestic Assault','Violent','Arson','Year']
# generate a new map
FG_map = folium.Map(location=[44.958326, -93.122926], zoom_start=14,tiles="OpenStreetMap")
#setup
if Incident=='All':
B= fgc
else:
B= fgc[(fgc['Incident'] == Incident)]
Date= fgc[(fgc['DayYear'] == Day)]['FDate'][0:1].iloc[0,]
B= B[(B['DayYear'] <= Day)]
B= B.query('Hour >= 6 and Hour <20')
B17=B.query('Year == 2017')
B17=B17[Index].groupby(['Year','Block','Latitude','Longitude']).sum().reset_index()
B18=B.query('Year == 2018')
B18=B18[Index].groupby(['Year','Block','Latitude','Longitude']).sum().reset_index()
B19=B.query('Year == 2019')
B19=B19[Index].groupby(['Year','Block','Latitude','Longitude']).sum().reset_index()
print('This map displays {} incidents up to {}20XX from 7AM to 8PM'.format(Incident,Date))
for index, row in B17.iterrows():
popup_text = "Year: {}<br> Address: {}<br> total incidents: {}"
popup_text = popup_text.format(row["Year"],row["Block"], row['Count'])
folium.CircleMarker(location=(row["Latitude"],row["Longitude"]),
radius=row['Count']+3,
color="#E37222",
popup=popup_text,
fill=True).add_to(FG_map)
for index, row in B18.iterrows():
popup_text = "Year: {}<br> Address: {}<br> total incidents: {}"
popup_text = popup_text.format(row["Year"],row["Block"], row['Count'])
folium.CircleMarker(location=(row["Latitude"], row["Longitude"]),
radius=row['Count']+3,
color="#007849",
popup=popup_text,
fill=True).add_to(FG_map)
for index, row in B19.iterrows():
popup_text = "Year: {}<br> Address: {}<br> total incidents: {}"
popup_text = popup_text.format(row["Year"],row["Block"], row['Count'])
folium.CircleMarker(location=(row["Latitude"],row["Longitude"]),
radius=row['Count']+3,
color="#800080",
popup=popup_text,
fill=True).add_to(FG_map)
return FG_map
--------------------------------------------------------------------------- NameError Traceback (most recent call last) <ipython-input-1-3f0fe37fd0c9> in <module> 1 ----> 2 def plot_Frogtown_long_crime_daytime_todate(Incident='All',Day=Max): 3 Index =['Block','Latitude','Longitude', 'Count','Theft','Vandalism','Narcotics','Auto Theft','Burglary','Discharge'\ 4 ,'Robbery','Domestic Assault','Violent','Arson','Year'] 5 NameError: name 'Max' is not defined
Crime Table toDate by Month
#convert MOnth
def Convert_Month(num):
Months= ['January','February','March','April','May','June','July','August','September','October','November','December']
for i in range(12):
if num==(i+1):
Xi=Months[i]
return Xi
def table_toDate_Month_Crime(Incident='All',Day=Max):
if Incident=='All':
B= fgc
else:
B= fgc[(fgc['Incident'] == Incident)]
Date= fgc[(fgc['DayYear'] == Day)]['FDate'][0:1].iloc[0,]
B= B[(B['DayYear'] <= Day)]
B=B.query('Year >= 2017')
Index= ['Year','Grid','Count','Month']
C= B[Index].groupby(['Year','Grid','Month']).sum().reset_index()
C['Month_Name']= C.Month.apply(Convert_Month)
C['Community']= C.Grid.apply(commun)
print('This table maps {} incidents up to Day {}20XX'.format(Incident,Date))
return pd.pivot_table(C, values='Count', index=['Community','Grid'], columns=['Month', 'Year'], fill_value=0)
Crime Graph toDate by Year
#Crime Plot
import matplotlib.pyplot as plt
import seaborn as sns
def plot_toDate_Year_Crime(Incident='All',Day=Max):
if Incident=='All':
B= fgc
else:
B= fgc[(fgc['Incident'] == Incident)]
Date= fgc[(fgc['DayYear'] == Day)]['FDate'][0:1].iloc[0,]
B=B.query('Year >= 2017')
B= B[(B['DayYear'] <= Day)]
Index= ['Year','Grid','Count']
C= B[Index].groupby(['Year','Grid']).sum().reset_index()
C['Community']= C.Grid.apply(commun)
print('This graph maps {} incidents up to {}20XX'.format(Incident,Date))
sns.set()
pd.pivot_table(C, values='Count', index=['Community','Grid'], columns=['Year'],
fill_value=0).plot(kind= 'barh',
figsize=(12,10),title= Incident + ' Yearly Total Incidents UptoDate: '+ str(Date)+'20XX')
return plt.show()
# Firearm Plot
def plot_toDate_Year_Firearm(Day=Max):
B= fgc_fire[(fgc_fire['DayYear'] <= Day)]
Date= fgc[(fgc['DayYear'] == Day)]['FDate'][0:1].iloc[0,]
B= B.query('Year>2016')
Index= ['Year','Grid','Count']
C= B[Index].groupby(['Year','Grid']).sum().reset_index()
C['Community']= C.Grid.apply(commun)
print('This graph maps Firearm incidents up to {}20XX'.format(Date))
sns.set()
pd.pivot_table(C, values='Count', index=['Community','Grid'], columns=['Year'],
fill_value=0).plot(kind= 'barh',
figsize=(12,10),title= 'Firearm Yearly Total Incidents UptoDate: ' + str(Date)+'20XX')
return plt.show()
Latenight Crime Plot by Year
def plot_Frogtown_year_Latenight(Year=2018):
# generate a new map
FG_map = folium.Map(location=[44.958326, -93.122926], zoom_start=14,tiles="OpenStreetMap")
#setup
B= fgc[(fgc['Year'] == Year)]
Index =['Block','Latitude','Longitude', 'Count','Theft','Vandalism','Narcotics','Auto Theft','Burglary','Discharge'\
,'Robbery','Domestic Assault','Violent','Arson']
BM=B.query('LateNight ==0')
BM=BM[Index].groupby(['Block','Latitude','Longitude']).sum().reset_index()
BM=BM.query('Count>2')
BL=B.query('LateNight ==1')
BL=BL[Index].groupby(['Block','Latitude','Longitude']).sum().reset_index()
BL=BL.query('Count>2')
# for each row in the data, add a cicle marker
for index, row in BM.iterrows():
popup_text = "Year: {} Non-late<br> Address: {}<br> total incidents: {}<br> Theft: {}<br> Vandalism: {}\
<br> Narcotics: {}<br> Auto Theft: {}<br> Burglary: {}<br> Discharge: {}<br> Robbery: {}\
<br> Domestic Assault: {}<br> Violent: {}<br> Arson: {}"
popup_text = popup_text.format(str(Year),row["Block"], row['Count'], row['Theft'], row['Vandalism'], row['Robbery'],\
row['Auto Theft'], row['Burglary'], row['Discharge'], row['Domestic Assault'],\
row['Domestic Assault'],row['Violent'],row['Arson'])
folium.CircleMarker(location=(row["Latitude"],row["Longitude"]),
radius=row['Count']+3,
color="#E37222",
popup=popup_text,
fill=True).add_to(FG_map)
for index, row in BL.iterrows():
popup_text = "Year: {} Late<br> Address: {}<br> total incidents: {}<br> Theft: {}<br> Vandalism: {}\
<br> Narcotics: {}<br> Auto Theft: {}<br> Burglary: {}<br> Discharge: {}<br> Robbery: {}\
<br> Domestic Assault: {}<br> Violent: {}<br> Arson: {}"
popup_text = popup_text.format(str(Year),row["Block"], row['Count'], row['Theft'], row['Vandalism'], row['Robbery'],\
row['Auto Theft'], row['Burglary'], row['Discharge'], row['Domestic Assault'],\
row['Domestic Assault'],row['Violent'],row['Arson'])
folium.CircleMarker(location=(row["Latitude"],row["Longitude"]),
radius=row['Count']+3,
color="#007849",
popup=popup_text,
fill=True).add_to(FG_map)
return FG_map
#plot_Frogtown_year_Latenight(2018)
Frogtown Plot by Year and month
def plot_Frogtown_yearmonth(Year=2018,Month=1):
# generate a new map
FG_map = folium.Map(location=[44.958326, -93.122926], zoom_start=14,tiles="OpenStreetMap")
#setup
B= fgc[(fgc['Year'] == Year)]
B= B[(B['Month'] == Month)]
Index =['Block','Latitude','Longitude', 'Count','Theft','Vandalism','Narcotics','Auto Theft','Burglary','Discharge']
B=B[Index].groupby(['Block','Latitude','Longitude']).sum().reset_index()
# for each row in the data, add a cicle marker
for index, row in B.iterrows():
Other= row['Count'] - row['Theft'] - row['Vandalism'] - row['Narcotics'] -row['Auto Theft'] - row['Burglary'] - row['Discharge']
popup_text = "Year: {} Month: {}<br> Address: {}<br> total incidents: {}<br> Theft: {}<br> Vandalism: {}\
<br> Narcotics: {}<br> Auto Theft: {}<br> Burglary: {}<br> Discharge: {}<br> Other: {}"
popup_text = popup_text.format(str(Year), str(Month),row["Block"], row['Count'], row['Theft'], row['Vandalism'], row['Narcotics'],\
row['Auto Theft'], row['Burglary'], row['Discharge'], Other)
folium.CircleMarker(location=(row["Latitude"],row["Longitude"]),
radius=row['Count']+3,
color="#E37222",
popup=popup_text,
fill=True).add_to(FG_map)
return FG_map
#plot_Frogtown_yearmonth(2018,1)
interact(plot_Frogtown_yearmonth, Year=widgets.IntSlider(min=2014,max=2019,step=1,value=2018),\
Month=[('January', 1), ('February', 2), ('March',3), ('April',4), ('May',5) ,('June',6),('July',7)]);
interactive(children=(IntSlider(value=2018, description='Year', max=2019, min=2014), Dropdown(description='Mon…
Frogtown plot by year and hour
def plot_Frogtown_yearhour(Year=2018,Hour=0):
# generate a new map
FG_map = folium.Map(location=[44.958326, -93.122926], zoom_start=14,tiles="OpenStreetMap")
#setup
B= fgc[(fgc['Year'] == Year)]
B= B[(B['Hour'] == Hour)]
Index =['Block','Latitude','Longitude', 'Count','Theft','Vandalism','Narcotics','Auto Theft','Burglary','Discharge']
B=B[Index].groupby(['Block','Latitude','Longitude']).sum().reset_index()
# for each row in the data, add a cicle marker
for index, row in B.iterrows():
Other= row['Count'] - row['Theft'] - row['Vandalism'] - row['Narcotics'] -row['Auto Theft'] - row['Burglary'] - row['Discharge']
popup_text = "Year: {} Hour: {}<br> Address: {}<br> total incidents: {}<br> Theft: {}<br> Vandalism: {}\
<br> Narcotics: {}<br> Auto Theft: {}<br> Burglary: {}<br> Discharge: {}<br> Other: {}"
popup_text = popup_text.format(str(Year), str(Hour),row["Block"], row['Count'], row['Theft'], row['Vandalism'], row['Narcotics'],\
row['Auto Theft'], row['Burglary'], row['Discharge'], Other)
folium.CircleMarker(location=(row["Latitude"],row["Longitude"]),
radius=row['Count']+3,
color="#E37222",
popup=popup_text,
fill=True).add_to(FG_map)
return FG_map
Frogtown Hotspot Map
def plot_Frogtown_hot_spot(Year=2018):
# generate a new map
FG_map = folium.Map(location=[44.958326, -93.122926], zoom_start=14,tiles="OpenStreetMap")
#setup
B= fgc[(fgc['Year'] >= Year)]
Index =['Block','Latitude','Longitude', 'Count','Theft','Vandalism','Narcotics','Auto Theft','Burglary','Discharge'\
,'Robbery','Domestic Assault','Violent','Arson']
B=B[Index].groupby(['Block','Latitude','Longitude']).sum().reset_index()
C=B.query('Count>9 and Count < 21')
D=B.query('Count>20 and Count < 51')
E=B.query('Count>50')
# for each row in the data, add a cicle marker
for index, row in C.iterrows():
popup_text = "Year: 2018/19<br> Address: {}<br> total incidents: {}<br> Theft: {}<br> Vandalism: {}\
<br> Narcotics: {}<br> Auto Theft: {}<br> Burglary: {}<br> Discharge: {}<br> Robbery: {}\
<br> Domestic Assault: {}<br> Violent: {}<br> Arson: {}"
popup_text = popup_text.format(str(Year),row["Block"], row['Count'], row['Theft'], row['Vandalism'], row['Robbery'],\
row['Auto Theft'], row['Burglary'], row['Discharge'], row['Domestic Assault'],\
row['Domestic Assault'],row['Violent'],row['Arson'])
folium.CircleMarker(location=(row["Latitude"],row["Longitude"]),
radius=row['Count']/2,
color="#E37222",
popup=popup_text,
fill=True).add_to(FG_map)
for index, row in D.iterrows():
popup_text = "Year: 2018/19<br> Address: {}<br> total incidents: {}<br> Theft: {}<br> Vandalism: {}\
<br> Narcotics: {}<br> Auto Theft: {}<br> Burglary: {}<br> Discharge: {}<br> Robbery: {}\
<br> Domestic Assault: {}<br> Violent: {}<br> Arson: {}"
popup_text = popup_text.format(str(Year),row["Block"], row['Count'], row['Theft'], row['Vandalism'], row['Robbery'],\
row['Auto Theft'], row['Burglary'], row['Discharge'], row['Domestic Assault'],\
row['Domestic Assault'],row['Violent'],row['Arson'])
folium.CircleMarker(location=(row["Latitude"],row["Longitude"]),
radius=row['Count']/5,
color="#007849",
popup=popup_text,
fill=True).add_to(FG_map)
for index, row in E.iterrows():
popup_text = "Year: 2018/19<br> Address: {}<br> total incidents: {}<br> Theft: {}<br> Vandalism: {}\
<br> Narcotics: {}<br> Auto Theft: {}<br> Burglary: {}<br> Discharge: {}<br> Robbery: {}\
<br> Domestic Assault: {}<br> Violent: {}<br> Arson: {}"
popup_text = popup_text.format(str(Year),row["Block"], row['Count'], row['Theft'], row['Vandalism'], row['Robbery'],\
row['Auto Theft'], row['Burglary'], row['Discharge'], row['Domestic Assault'],\
row['Domestic Assault'],row['Violent'],row['Arson'])
folium.CircleMarker(location=(row["Latitude"],row["Longitude"]),
radius=row['Count']/9,
color="#800080",
popup=popup_text,
fill=True).add_to(FG_map)
return FG_map
Saint Paul Data Load and Crimetable to Date
#Read Data
df = pd.read_csv('Datasets/Crime_Incident_Report_-_Dataset.csv')
cols= ['Case','Date','Time','Code','IncType','Incident','Grid','NNum','Neighborhood','Block','CallDispCode','CallDisposition', 'Count']
df.columns= cols
#Add Time Variables
df= df[df.Case != 18254093] #messed up time variable
df['Date']= pd.to_datetime(df['Date'])
df['Year']= df['Date'].dt.year
df=df.query('Year > 2016')
df['DayYear'] = df['Date'].dt.dayofyear
df['Community']= df['Grid'].apply(commun)
df= df.query('Code not in [9954,9959] and Community !="NaN"')
def plot_toDate_Year_SPCrime(Incident='All',Day=Max):
if Incident=='All':
B= df
else:
B= df[(df['Incident'] == Incident)]
Date= fgc[(fgc['DayYear'] == Day)]['FDate'][0:1].iloc[0,]
B= B[(B['DayYear'] <= Day)]
Index= ['Year','Community','Count']
C= B[Index].groupby(['Year','Community']).sum().reset_index()
print('This graph maps {} incidents of Saint Paul neighborhoods up to {}20XX'.format(Date))
sns.set()
pd.pivot_table(C, values='Count', index=['Community'], columns=['Year'],
fill_value=0).plot(kind= 'barh',
figsize=(12,10),title= Incident + ' Yearly UptoDate Total Incidents')
return plt.show()
Functions all 
Run to activate all functions
from __future__ import print_function
from ipywidgets import interact, interactive, fixed, interact_manual
import ipywidgets as widgets
import pandas as pd
import numpy as np
%matplotlib inline
import folium
import warnings
warnings.filterwarnings('ignore')
#Upload Data
fg = pd.read_csv('Datasets\FGCrime_Final.csv')
#Set max limit for uptodate function
Max= fg.loc[1,'Day_Max']
# Set a friendly Date variable
fg['FDate']=fg['Month'].astype(str) + '/' + fg['Day'].astype(str) + '/'
fgp= fg.query('Code in [9954]') # Specify proactive calls
fgc= fg.query('Code not in [9954,9959]') #specify all crime related police visits
fgc_Date= fgc[(fgc['DayYear'] <= Max)] #this specifies to date df
fgc_fire=fgc[fgc['IncType'].str.contains("Firearm")] #specifies all firearm
def plot_multicrime_byYear(Year=2019):
# generate a new map
FG_map = folium.Map(location=[44.958326, -93.122926], zoom_start=14,tiles="OpenStreetMap")
#setup
B= fgc[(fgc['Year'] == Year)]
Index =['Block','Latitude','Longitude', 'Count','Theft','Vandalism','Narcotics','Auto Theft','Burglary','Discharge']
T=B.query('Theft==1')
T=T[Index].groupby(['Block','Latitude','Longitude']).sum().reset_index()
V=B.query('Vandalism==1')
V=V[Index].groupby(['Block','Latitude','Longitude']).sum().reset_index()
N=B.query('Narcotics==1')
N=N[Index].groupby(['Block','Latitude','Longitude']).sum().reset_index()
A=B.query('Incident=="Auto Theft"')
A=A[Index].groupby(['Block','Latitude','Longitude']).sum().reset_index()
D=B.query('Discharge==1')
D=D[Index].groupby(['Block','Latitude','Longitude']).sum().reset_index()
Br=B.query('Burglary==1')
Br=Br[Index].groupby(['Block','Latitude','Longitude']).sum().reset_index()
#Create Frogtown GeoMap
FG_map = folium.Map(location=[44.958326, -93.122926], zoom_start=14,tiles="OpenStreetMap")
for index, row in T.iterrows():
popup_text = "Address: {}<br> total theft incidents: {}"
popup_text = popup_text.format(row["Block"],row['Count'])
folium.CircleMarker(location=(row["Latitude"],row["Longitude"]),
radius=row['Count'] +3,
color="#E37222",
popup=popup_text,
fill=True).add_to(FG_map)
for index, row in V.iterrows():
popup_text = "Address: {}<br> total vandalism incidents: {}"
popup_text = popup_text.format(row["Block"],row['Count'])
folium.CircleMarker(location=(row["Latitude"],row["Longitude"]),
radius=row['Count'] +3,
color="#FF0000",
popup=popup_text,
fill=True).add_to(FG_map)
for index, row in N.iterrows():
popup_text = "Address: {}<br> total narcotics incidents: {}"
popup_text = popup_text.format(row["Block"],row['Narcotics'])
folium.CircleMarker(location=(row["Latitude"],row["Longitude"]),
radius=row['Narcotics'] + 3,
color="#654321",
popup=popup_text,
fill=True).add_to(FG_map)
for index, row in A.iterrows():
popup_text = "Address: {}<br> total autotheft incidents: {}"
popup_text = popup_text.format(row["Block"],row['Count'])
folium.CircleMarker(location=(row["Latitude"],row["Longitude"]),
radius=row['Count'] +3,
color='#007849',
popup=popup_text,
fill=True).add_to(FG_map)
for index, row in D.iterrows():
popup_text = "Address: {}<br> total discharge incidents: {}"
popup_text = popup_text.format(row["Block"],row['Count'])
folium.CircleMarker(location=(row["Latitude"],row["Longitude"]),
radius=row['Count'] +3,
color="#800080",
popup=popup_text,
fill=True).add_to(FG_map)
for index, row in Br.iterrows():
popup_text = "Address: {}<br> total burglary incidents: {}"
popup_text = popup_text.format(row["Block"],row['Count'])
folium.CircleMarker(location=(row["Latitude"],row["Longitude"]),
radius=row['Count'] +3,
color="#0000ff",
popup=popup_text,
fill=True).add_to(FG_map)
return FG_map
def plot_Frogtown_year(Year=2018):
# generate a new map
FG_map = folium.Map(location=[44.958326, -93.122926], zoom_start=14,tiles="OpenStreetMap")
#setup
B= fgc[(fgc['Year'] == Year)]
Index =['Block','Latitude','Longitude', 'Count','Theft','Vandalism','Narcotics','Auto Theft','Burglary','Discharge'\
,'Robbery','Domestic Assault','Violent','Arson']
B=B[Index].groupby(['Block','Latitude','Longitude']).sum().reset_index()
B=B.query('Count>3')
# for each row in the data, add a cicle marker
for index, row in B.iterrows():
popup_text = "Year: {}<br> Address: {}<br> total incidents: {}<br> Theft: {}<br> Vandalism: {}\
<br> Narcotics: {}<br> Auto Theft: {}<br> Burglary: {}<br> Discharge: {}<br> Robbery: {}\
<br> Domestic Assault: {}<br> Violent: {}<br> Arson: {}"
popup_text = popup_text.format(str(Year),row["Block"], row['Count'], row['Theft'], row['Vandalism'], row['Robbery'],\
row['Auto Theft'], row['Burglary'], row['Discharge'], row['Domestic Assault'],\
row['Domestic Assault'],row['Violent'],row['Arson'])
folium.CircleMarker(location=(row["Latitude"],row["Longitude"]),
radius=row['Count']+3,
color="#E37222",
popup=popup_text,
fill=True).add_to(FG_map)
return FG_map
def plot_Frogtown_year_proactive(Year=2018):
FG_map = folium.Map(location=[44.958326, -93.122926], zoom_start=14,tiles="OpenStreetMap")
B= fgc[(fgc['Year'] == Year)]
Index =['Block','Latitude','Longitude', 'Count','Theft','Vandalism','Narcotics','Auto Theft','Burglary','Discharge'\
,'Robbery','Domestic Assault','Violent','Arson']
B=B[Index].groupby(['Block','Latitude','Longitude']).sum().reset_index()
A= fgp[(fgp['Year'] == Year)]
A= A.groupby(['Block','Latitude','Longitude']).size().reset_index()
A.columns=['Block','Latitude','Longitude','Count']
for index, row in B.iterrows():
popup_text = "Year: {}<br> Address: {}<br> total incidents: {}<br> Theft: {}<br> Vandalism: {}\
<br> Narcotics: {}<br> Auto Theft: {}<br> Burglary: {}<br> Discharge: {}<br> Robbery: {}\
<br> Domestic Assault: {}<br> Violent: {}<br> Arson: {}"
popup_text = popup_text.format(str(Year),row["Block"], row['Count'], row['Theft'], row['Vandalism'], row['Robbery'],\
row['Auto Theft'], row['Burglary'], row['Discharge'], row['Domestic Assault'],\
row['Domestic Assault'],row['Violent'],row['Arson'])
folium.CircleMarker(location=(row["Latitude"],row["Longitude"]),
radius=row['Count']+3,
color="#E37222",
popup=popup_text,
fill=True).add_to(FG_map)
for index, row in A.iterrows():
popup_text = "Address: {}<br> total proactive calls: {}"
popup_text = popup_text.format(row["Block"], row['Count'])
folium.CircleMarker(location=(row["Latitude"],row["Longitude"]),
radius=row['Count']+3,
color="#007849",
popup=popup_text,
fill=True).add_to(FG_map)
return FG_map
def plot_Frogtown_long_crime(Incident='Discharge'):
Index =['Block','Latitude','Longitude', 'Count','Theft','Vandalism','Narcotics','Auto Theft','Burglary','Discharge'\
,'Robbery','Domestic Assault','Violent','Arson','Year']
FG_map = folium.Map(location=[44.958326, -93.122926], zoom_start=14,tiles="OpenStreetMap")
B= fgc[(fgc['Incident'] == Incident)]
B17=B.query('Year == 2018')
B17=B17[Index].groupby(['Year','Block','Latitude','Longitude']).sum().reset_index()
B18=B.query('Year == 2019')
B18=B18[Index].groupby(['Year','Block','Latitude','Longitude']).sum().reset_index()
B19=B.query('Year == 2020')
B19=B19[Index].groupby(['Year','Block','Latitude','Longitude']).sum().reset_index()
for index, row in B17.iterrows():
popup_text = "Year: {}<br> Address: {}<br> total incidents: {}"
popup_text = popup_text.format(row["Year"],row["Block"], row['Count'])
folium.CircleMarker(location=(row["Latitude"],row["Longitude"]),
radius=row['Count']+3,
color="#E37222",
popup=popup_text,
fill=True).add_to(FG_map)
for index, row in B18.iterrows():
popup_text = "Year: {}<br> Address: {}<br> total incidents: {}"
popup_text = popup_text.format(row["Year"],row["Block"], row['Count'])
folium.CircleMarker(location=(row["Latitude"], row["Longitude"]),
radius=row['Count']+3,
color="#007849",
popup=popup_text,
fill=True).add_to(FG_map)
for index, row in B19.iterrows():
popup_text = "Year: {}<br> Address: {}<br> total incidents: {}"
popup_text = popup_text.format(row["Year"],row["Block"], row['Count'])
folium.CircleMarker(location=(row["Latitude"],row["Longitude"]),
radius=row['Count']+3,
color="#800080",
popup=popup_text,
fill=True).add_to(FG_map)
return FG_map
def plot_Frogtown_long_crime_todate(Incident='All',Day=Max):
Index =['Block','Latitude','Longitude', 'Count','Theft','Vandalism','Narcotics','Auto Theft','Burglary','Discharge'\
,'Robbery','Domestic Assault','Violent','Arson','Year']
# generate a new map
FG_map = folium.Map(location=[44.958326, -93.122926], zoom_start=14,tiles="OpenStreetMap")
#setup
if Incident=='All':
B= fgc
else:
B= fgc[(fgc['Incident'] == Incident)]
Date= fgc[(fgc['DayYear'] == Day)]['FDate'][0:1].iloc[0,]
B= B[(B['DayYear'] <= Day)]
B17=B.query('Year == 2018')
B17=B17[Index].groupby(['Year','Block','Latitude','Longitude']).sum().reset_index()
B18=B.query('Year == 2019')
B18=B18[Index].groupby(['Year','Block','Latitude','Longitude']).sum().reset_index()
B19=B.query('Year == 2020')
B19=B19[Index].groupby(['Year','Block','Latitude','Longitude']).sum().reset_index()
print('This map displays {} incidents up to {}20XX'.format(Incident,Date))
for index, row in B17.iterrows():
popup_text = "Year: {}<br> Address: {}<br> total incidents: {}"
popup_text = popup_text.format(row["Year"],row["Block"], row['Count'])
folium.CircleMarker(location=(row["Latitude"],row["Longitude"]),
radius=row['Count']+3,
color="#E37222",
popup=popup_text,
fill=True).add_to(FG_map)
for index, row in B18.iterrows():
popup_text = "Year: {}<br> Address: {}<br> total incidents: {}"
popup_text = popup_text.format(row["Year"],row["Block"], row['Count'])
folium.CircleMarker(location=(row["Latitude"], row["Longitude"]),
radius=row['Count']+3,
color="#007849",
popup=popup_text,
fill=True).add_to(FG_map)
for index, row in B19.iterrows():
popup_text = "Year: {}<br> Address: {}<br> total incidents: {}"
popup_text = popup_text.format(row["Year"],row["Block"], row['Count'])
folium.CircleMarker(location=(row["Latitude"],row["Longitude"]),
radius=row['Count']+3,
color="#800080",
popup=popup_text,
fill=True).add_to(FG_map)
return FG_map
# Latest Shooting Data
def plot_Frogtown_long_crime_todate_2020(Incident='All',Day=Max, CDate=Max):
Index =['Block','Latitude','Longitude', 'Count','Theft','Vandalism','Narcotics','Auto Theft','Burglary','Discharge'\
,'Robbery','Domestic Assault','Violent','Arson','Year']
# generate a new map
FG_map = folium.Map(location=[44.958326, -93.122926], zoom_start=14,tiles="OpenStreetMap")
#setup
if Incident=='All':
B= fgc
else:
B= fgc[(fgc['Incident'] == Incident)]
Date= fgc[(fgc['DayYear'] == CDate)]['FDate'][0:1].iloc[0,]
B= B[(B['DayYear'] <= Day)]
B=B.query('Year == 2020')
B=B[Index].groupby(['Year','Block','Latitude','Longitude']).sum().reset_index()
print('This map displays {} incidents within {} days from date {}20XX'.format(Incident,Day,Date))
for index, row in B.iterrows():
popup_text = "Year: {}<br> Address: {}<br> total incidents: {}"
popup_text = popup_text.format(row["Year"],row["Block"], row['Count'])
folium.CircleMarker(location=(row["Latitude"],row["Longitude"]),
radius=row['Count']+3,
color="#800080",
popup=popup_text,
fill=True).add_to(FG_map)
return FG_map
def plot_toDate_Days_SPCrime(Incident='All',Day=Max, CDate=Max):
if Incident=='All':
B= df
else:
B= df[(df['Incident'] == Incident)]
Date= fgc[(fgc['DayYear'] == CDate)]['FDate'][0:1].iloc[0,]
Bd= CDate-Day
B= B[(B['DayYear'] >= Bd)]
B= B[(B['DayYear'] <= CDate)]
#convert MOnth
def Convert_Month(num):
Months= ['January','February','March','April','May','June','July','August','September','October','November','December']
for i in range(12):
if num==(i+1):
Xi=Months[i]
return Xi
#Community function
def commun(x):
if x in [67,68,87,88,89,90,91,92]:
return 'Thomas-Frogtown'
elif x in [5,6,7,8,25,26,27,28,45,46,47,48]:
return 'Como'
elif x in [107, 108, 109, 110,127,128,129,130]:
return 'Summit-University'
elif x in [101,102,103,104,105,106,122,123,124,125,126]:
return 'Union Park'
elif x in [63,64,65,66,83,84,85,86]:
return 'Midway'
elif x in [142,143,144,145,146,162,163,164,165,166]:
return 'Macalester_Groveland'
elif x in [182,183,184,185,186,202,203,204,205,206,223,224,225,242,243,244,245,246]:
return 'Highland Park'
elif x in [147,148,149,167,168]:
return 'Summit Hill'
elif x in [1,2,21,22,43,44,61,62,81,82]:
return 'St. Anthony'
elif x in [226,207,187,188,189,267,268,169,170,171,249,150,151,230]:
return 'West 7th'
elif x in [209,210,211,212,213,214,215,192,193,194,195,172,173,174,175]:
return 'West Side'
elif x in [111,112,131,132,133,152,153]:
return 'Capital_River'
elif x in [98,99,100,118,119,119,120,137,138,139,140,160,197,180,200,240,280]:
return 'Battle_Creek'
elif x in [76,95,96,97,115,116,117,138,114,136]:
return 'Dayton Bluff'
elif x in [9,10,11,12,29,30,31,32,49,50,51,52,269,69,70,71,72]:
return 'North End'
elif x in [13,14,15,16,33,34,35,36,53,54,55,56,73,74,75,93,94]:
return 'Payne-Phalen'
elif x in [17,18,19,20,37,38,39,40,56,57,58,59,60,77,78,79,80]:
return 'Greater East Side'
else:
return 'NaN'
def table_toDate_Month_Crime(Incident='All',Day=Max):
if Incident=='All':
B= fgc
else:
B= fgc[(fgc['Incident'] == Incident)]
Date= fgc[(fgc['DayYear'] == Day)]['FDate'][0:1].iloc[0,]
B= B[(B['DayYear'] <= Day)]
B=B.query('Year >= 2018')
Index= ['Year','Grid','Count','Month']
C= B[Index].groupby(['Year','Grid','Month']).sum().reset_index()
C['Month_Name']= C.Month.apply(Convert_Month)
C['Community']= C.Grid.apply(commun)
print('This table maps {} incidents up to Day {}20XX'.format(Incident,Date))
return pd.pivot_table(C, values='Count', index=['Community','Grid'], columns=['Month', 'Year'], fill_value=0)
import matplotlib.pyplot as plt
import seaborn as sns
def plot_toDate_Year_Crime(Incident='All',Day=Max):
if Incident=='All':
B= fgc
else:
B= fgc[(fgc['Incident'] == Incident)]
Date= fgc[(fgc['DayYear'] == Day)]['FDate'][0:1].iloc[0,]
B=B.query('Year >= 2018')
B= B[(B['DayYear'] <= Day)]
Index= ['Year','Grid','Count']
C= B[Index].groupby(['Year','Grid']).sum().reset_index()
C['Community']= C.Grid.apply(commun)
print('This graph maps {} incidents up to {}20XX'.format(Incident,Date))
sns.set()
pd.pivot_table(C, values='Count', index=['Community','Grid'], columns=['Year'],
fill_value=0).plot(kind= 'barh',
figsize=(12,10),title= Incident + ' Yearly Total Incidents UptoDate: '+ str(Date)+'20XX')
return plt.show()
# Firearm Plot
def plot_toDate_Year_Firearm(Day=Max):
B= fgc_fire[(fgc_fire['DayYear'] <= Day)]
Date= fgc[(fgc['DayYear'] == Day)]['FDate'][0:1].iloc[0,]
B= B.query('Year>2017')
Index= ['Year','Grid','Count']
C= B[Index].groupby(['Year','Grid']).sum().reset_index()
C['Community']= C.Grid.apply(commun)
print('This graph maps Firearm incidents up to {}20XX'.format(Date))
sns.set()
pd.pivot_table(C, values='Count', index=['Community','Grid'], columns=['Year'],
fill_value=0).plot(kind= 'barh',
figsize=(12,10),title= 'Firearm Yearly Total Incidents UptoDate: ' + str(Date)+'20XX')
return plt.show()
#4
def plot_toDate_Year_Firearm(Day=Max):
B= fgc_fire[(fgc_fire['DayYear'] <= Day)]
Date= fgc[(fgc['DayYear'] == Day)]['FDate'][0:1].iloc[0,]
B= B.query('Year>2017')
Index= ['Year','Grid','Count']
C= B[Index].groupby(['Year','Grid']).sum().reset_index()
C['Community']= C.Grid.apply(commun)
print('This graph maps Firearm incidents up to {}20XX'.format(Date))
sns.set()
pd.pivot_table(C, values='Count', index=['Community','Grid'], columns=['Year'],
fill_value=0).plot(kind= 'barh',
figsize=(12,10),title= 'Firearm Yearly Total Incidents UptoDate: ' + str(Date)+'20XX')
return plt.show()
def plot_Frogtown_year_Latenight(Year=2018):
# generate a new map
FG_map = folium.Map(location=[44.958326, -93.122926], zoom_start=14,tiles="OpenStreetMap")
#setup
B= fgc[(fgc['Year'] == Year)]
Index =['Block','Latitude','Longitude', 'Count','Theft','Vandalism','Narcotics','Auto Theft','Burglary','Discharge'\
,'Robbery','Domestic Assault','Violent','Arson']
BM=B.query('LateNight ==0')
BM=BM[Index].groupby(['Block','Latitude','Longitude']).sum().reset_index()
BM=BM.query('Count>2')
BL=B.query('LateNight ==1')
BL=BL[Index].groupby(['Block','Latitude','Longitude']).sum().reset_index()
BL=BL.query('Count>2')
# for each row in the data, add a cicle marker
for index, row in BM.iterrows():
popup_text = "Year: {} Non-late<br> Address: {}<br> total incidents: {}<br> Theft: {}<br> Vandalism: {}\
<br> Narcotics: {}<br> Auto Theft: {}<br> Burglary: {}<br> Discharge: {}<br> Robbery: {}\
<br> Domestic Assault: {}<br> Violent: {}<br> Arson: {}"
popup_text = popup_text.format(str(Year),row["Block"], row['Count'], row['Theft'], row['Vandalism'], row['Robbery'],\
row['Auto Theft'], row['Burglary'], row['Discharge'], row['Domestic Assault'],\
row['Domestic Assault'],row['Violent'],row['Arson'])
folium.CircleMarker(location=(row["Latitude"],row["Longitude"]),
radius=row['Count']+3,
color="#E37222",
popup=popup_text,
fill=True).add_to(FG_map)
for index, row in BL.iterrows():
popup_text = "Year: {} Late<br> Address: {}<br> total incidents: {}<br> Theft: {}<br> Vandalism: {}\
<br> Narcotics: {}<br> Auto Theft: {}<br> Burglary: {}<br> Discharge: {}<br> Robbery: {}\
<br> Domestic Assault: {}<br> Violent: {}<br> Arson: {}"
popup_text = popup_text.format(str(Year),row["Block"], row['Count'], row['Theft'], row['Vandalism'], row['Robbery'],\
row['Auto Theft'], row['Burglary'], row['Discharge'], row['Domestic Assault'],\
row['Domestic Assault'],row['Violent'],row['Arson'])
folium.CircleMarker(location=(row["Latitude"],row["Longitude"]),
radius=row['Count']+3,
color="#007849",
popup=popup_text,
fill=True).add_to(FG_map)
return FG_map
def plot_Frogtown_yearmonth(Year=2018,Month=1):
# generate a new map
FG_map = folium.Map(location=[44.958326, -93.122926], zoom_start=14,tiles="OpenStreetMap")
#setup
B= fgc[(fgc['Year'] == Year)]
B= B[(B['Month'] == Month)]
Index =['Block','Latitude','Longitude', 'Count','Theft','Vandalism','Narcotics','Auto Theft','Burglary','Discharge']
B=B[Index].groupby(['Block','Latitude','Longitude']).sum().reset_index()
# for each row in the data, add a cicle marker
for index, row in B.iterrows():
Other= row['Count'] - row['Theft'] - row['Vandalism'] - row['Narcotics'] -row['Auto Theft'] - row['Burglary'] - row['Discharge']
popup_text = "Year: {} Month: {}<br> Address: {}<br> total incidents: {}<br> Theft: {}<br> Vandalism: {}\
<br> Narcotics: {}<br> Auto Theft: {}<br> Burglary: {}<br> Discharge: {}<br> Other: {}"
popup_text = popup_text.format(str(Year), str(Month),row["Block"], row['Count'], row['Theft'], row['Vandalism'], row['Narcotics'],\
row['Auto Theft'], row['Burglary'], row['Discharge'], Other)
folium.CircleMarker(location=(row["Latitude"],row["Longitude"]),
radius=row['Count']+3,
color="#E37222",
popup=popup_text,
fill=True).add_to(FG_map)
return FG_map
def plot_Frogtown_yearhour(Year=2018,Hour=0):
# generate a new map
FG_map = folium.Map(location=[44.958326, -93.122926], zoom_start=14,tiles="OpenStreetMap")
#setup
B= fgc[(fgc['Year'] == Year)]
B= B[(B['Hour'] == Hour)]
Index =['Block','Latitude','Longitude', 'Count','Theft','Vandalism','Narcotics','Auto Theft','Burglary','Discharge']
B=B[Index].groupby(['Block','Latitude','Longitude']).sum().reset_index()
# for each row in the data, add a cicle marker
for index, row in B.iterrows():
Other= row['Count'] - row['Theft'] - row['Vandalism'] - row['Narcotics'] -row['Auto Theft'] - row['Burglary'] - row['Discharge']
popup_text = "Year: {} Hour: {}<br> Address: {}<br> total incidents: {}<br> Theft: {}<br> Vandalism: {}\
<br> Narcotics: {}<br> Auto Theft: {}<br> Burglary: {}<br> Discharge: {}<br> Other: {}"
popup_text = popup_text.format(str(Year), str(Hour),row["Block"], row['Count'], row['Theft'], row['Vandalism'], row['Narcotics'],\
row['Auto Theft'], row['Burglary'], row['Discharge'], Other)
folium.CircleMarker(location=(row["Latitude"],row["Longitude"]),
radius=row['Count']+3,
color="#E37222",
popup=popup_text,
fill=True).add_to(FG_map)
return FG_map
def plot_Frogtown_long_crime_daytime_todate(Incident='All',Day=Max):
Index =['Block','Latitude','Longitude', 'Count','Theft','Vandalism','Narcotics','Auto Theft','Burglary','Discharge'\
,'Robbery','Domestic Assault','Violent','Arson','Year']
# generate a new map
FG_map = folium.Map(location=[44.958326, -93.122926], zoom_start=14,tiles="OpenStreetMap")
#setup
if Incident=='All':
B= fgc
else:
B= fgc[(fgc['Incident'] == Incident)]
Date= fgc[(fgc['DayYear'] == Day)]['FDate'][0:1].iloc[0,]
B= B[(B['DayYear'] <= Day)]
B= B.query('Hour >= 6 and Hour <20')
B17=B.query('Year == 2018')
B17=B17[Index].groupby(['Year','Block','Latitude','Longitude']).sum().reset_index()
B18=B.query('Year == 2019')
B18=B18[Index].groupby(['Year','Block','Latitude','Longitude']).sum().reset_index()
B19=B.query('Year == 2020')
B19=B19[Index].groupby(['Year','Block','Latitude','Longitude']).sum().reset_index()
print('This map displays {} incidents up to {}20XX from 7AM to 8PM'.format(Incident,Date))
for index, row in B17.iterrows():
popup_text = "Year: {}<br> Address: {}<br> total incidents: {}"
popup_text = popup_text.format(row["Year"],row["Block"], row['Count'])
folium.CircleMarker(location=(row["Latitude"],row["Longitude"]),
radius=row['Count']+3,
color="#E37222",
popup=popup_text,
fill=True).add_to(FG_map)
for index, row in B18.iterrows():
popup_text = "Year: {}<br> Address: {}<br> total incidents: {}"
popup_text = popup_text.format(row["Year"],row["Block"], row['Count'])
folium.CircleMarker(location=(row["Latitude"], row["Longitude"]),
radius=row['Count']+3,
color="#007849",
popup=popup_text,
fill=True).add_to(FG_map)
for index, row in B19.iterrows():
popup_text = "Year: {}<br> Address: {}<br> total incidents: {}"
popup_text = popup_text.format(row["Year"],row["Block"], row['Count'])
folium.CircleMarker(location=(row["Latitude"],row["Longitude"]),
radius=row['Count']+3,
color="#800080",
popup=popup_text,
fill=True).add_to(FG_map)
return FG_map
#hotspot map
def plot_Frogtown_hot_spot(Year=2019):
# generate a new map
FG_map = folium.Map(location=[44.958326, -93.122926], zoom_start=14,tiles="OpenStreetMap")
#setup
B= fgc[(fgc['Year'] >= Year)]
Index =['Block','Latitude','Longitude', 'Count','Theft','Vandalism','Narcotics','Auto Theft','Burglary','Discharge'\
,'Robbery','Domestic Assault','Violent','Arson']
B=B[Index].groupby(['Block','Latitude','Longitude']).sum().reset_index()
C=B.query('Count>9 and Count < 21')
D=B.query('Count>20 and Count < 51')
E=B.query('Count>50')
# for each row in the data, add a cicle marker
for index, row in C.iterrows():
popup_text = "Year: 2019/20{}<br> Address: {}<br> total incidents: {}<br> Theft: {}<br> Vandalism: {}\
<br> Narcotics: {}<br> Auto Theft: {}<br> Burglary: {}<br> Discharge: {}<br> Robbery: {}\
<br> Domestic Assault: {}<br> Violent: {}<br> Arson: {}"
popup_text = popup_text.format(str(Year),row["Block"], row['Count'], row['Theft'], row['Vandalism'], row['Robbery'],\
row['Auto Theft'], row['Burglary'], row['Discharge'], row['Domestic Assault'],\
row['Domestic Assault'],row['Violent'],row['Arson'])
folium.CircleMarker(location=(row["Latitude"],row["Longitude"]),
radius=row['Count']/2,
color="#E37222",
popup=popup_text,
fill=True).add_to(FG_map)
for index, row in D.iterrows():
popup_text = "Year: 2019/20<br> Address: {}<br> total incidents: {}<br> Theft: {}<br> Vandalism: {}\
<br> Narcotics: {}<br> Auto Theft: {}<br> Burglary: {}<br> Discharge: {}<br> Robbery: {}\
<br> Domestic Assault: {}<br> Violent: {}<br> Arson: {}"
popup_text = popup_text.format(str(Year),row["Block"], row['Count'], row['Theft'], row['Vandalism'], row['Robbery'],\
row['Auto Theft'], row['Burglary'], row['Discharge'], row['Domestic Assault'],\
row['Domestic Assault'],row['Violent'],row['Arson'])
folium.CircleMarker(location=(row["Latitude"],row["Longitude"]),
radius=row['Count']/5,
color="#007849",
popup=popup_text,
fill=True).add_to(FG_map)
for index, row in E.iterrows():
popup_text = "Year: 2019/20<br> Address: {}<br> total incidents: {}<br> Theft: {}<br> Vandalism: {}\
<br> Narcotics: {}<br> Auto Theft: {}<br> Burglary: {}<br> Discharge: {}<br> Robbery: {}\
<br> Domestic Assault: {}<br> Violent: {}<br> Arson: {}"
popup_text = popup_text.format(str(Year),row["Block"], row['Count'], row['Theft'], row['Vandalism'], row['Robbery'],\
row['Auto Theft'], row['Burglary'], row['Discharge'], row['Domestic Assault'],\
row['Domestic Assault'],row['Violent'],row['Arson'])
folium.CircleMarker(location=(row["Latitude"],row["Longitude"]),
radius=row['Count']/9,
color="#800080",
popup=popup_text,
fill=True).add_to(FG_map)
return FG_map
#Saint Paul Data
#Socarata upload Method
from sodapy import Socrata
#New Upload Method Get Information from Socrata API
client = Socrata("information.stpaul.gov", None)
#Easier to bulk upload
results = client.get("gppb-g9cg", limit=1000000)
df = pd.DataFrame.from_records(results)
#rename columns [Note the order of Columns have changed]
cols= ['Block','CallDispCode','CallDisposition','Case','Code', 'Count','Date','Grid','Incident','IncType','Neighborhood','NNum','Time']
df.columns= cols
df=df.dropna()
df = df.astype({"Case": int, "Code": int, "Grid":float, "NNum":int,"Count":int})
#Add Time Variables
df= df[df.Case != 18254093] #messed up time variable
df['Date']= pd.to_datetime(df['Date'])
df['Year']= df['Date'].dt.year
df=df.query('Year > 2017')
df['DayYear'] = df['Date'].dt.dayofyear
df['Community']= df['Grid'].apply(commun)
df= df.query('Code not in [9954,9959] and Community !="NaN"')
from datetime import datetime
df['DateTime']= pd.to_datetime(df['Date']) # Create new column called DateTime
df['Year']= df['DateTime'].dt.year #create year column
df['DayofWeek']=df['DateTime'].dt.dayofweek #create day of the week column where default 0=Monday
df['Weekend'] = df['DayofWeek'].apply(lambda x: 1 if (x>4) else 0) #Create a weekend category
df['Month'] = df['DateTime'].dt.month # Create Month Category
df['Day'] = df['DateTime'].dt.day #Create Day of the Current month
df['DayYear'] = df['DateTime'].dt.dayofyear #Create Day of the year (0-365)
df['Day_Max'] = df.iloc[0,-1] #selects uptodate day; NOTE: the data is sorted chronologically
#Hour Data
df['TimeHour']= pd.to_datetime(df['Time'])
df['Hour'] = df['TimeHour'].dt.hour.astype(int) #Create Hour Colum
df['LateNight'] = df['Hour'].apply(lambda x: 1 if (x>21 or x<5) else 0) #Latenight designation from 10Pm to 6PM
df.Incident.loc[(df['Incident'] == 'Simple Asasult Dom.')] = 'Simple Assault Dom.'
df.Incident.loc[(df['Incident'] == 'Graffiti')] = 'Vandalism'
df.Incident.loc[df["Incident"].isin([ "Rape","Agg. Assault",'Homicide'])]= 'Violent'
df.Incident.loc[df["Incident"].isin(["Simple Assault Dom.","Agg. Assault Dom."])]= 'Domestic Assault'
#Current Date Numeric
Max= df.iloc[0,14]
#GeorgeFloyd Death date
GE= 146
#Covid start Date
CV= 73
#Add Time Variables
df= df[df.Case != 18254093] #messed up time variable
df['Date']= pd.to_datetime(df['Date'])
df['Year']= df['Date'].dt.year
df=df.query('Year > 2017')
df['DayYear'] = df['Date'].dt.dayofyear
df['Community']= df['Grid'].apply(commun)
df= df.query('Code not in [9954,9959] and Community !="NaN"')
df_fire=df[df['IncType'].str.contains("Firearm")]
#Normalized Population
P1 = {'Community': ['Battle_Creek','Greater East Side','West Side','Dayton Bluff','Payne-Phalen','North End','Thomas-Frogtown','Summit-University','West 7th','Como','Midway','St. Anthony','Union Park','Macalester_Groveland','Highland Park','Summit Hill','Capital_River'],
'Pop': [23492,30101,15459,18294,32170,24677,15454,17935,11671,16739,12688,8239,16726,19885,23867,6961,8442]
}
Norm = pd.DataFrame(P1, columns = ['Community', 'Pop'])
def plot_toDate_Days_SPCrime(Incident='All',Day=Max, CDate=Max):
if Incident=='All':
B= df
else:
B= df[(df['Incident'] == Incident)]
Date= fgc[(fgc['DayYear'] == CDate)]['FDate'][0:1].iloc[0,]
Bd= CDate-Day
B= B[(B['DayYear'] >= Bd)]
B= B[(B['DayYear'] <= CDate)]
Index= ['Year','Community','Count']
C= B[Index].groupby(['Year','Community']).sum().reset_index()
print('This graph displays total {} incidents of Saint Paul neighborhoods within {} days from date {}20XX'.format(Incident,Day,Date))
sns.set()
pd.pivot_table(C, values='Count', index=['Community'], columns=['Year'],
fill_value=0).plot(kind= 'barh',
figsize=(12,10),title= Incident + ' Yearly UptoDate Total Incidents')
return plt.show()
def plot_toDate_Days_FGCrime(Incident='All',Day=Max, CDate=Max):
if Incident=='All':
B= fgc
else:
B= fgc[(fgc['Incident'] == Incident)]
Date= fgc[(fgc['DayYear'] == CDate)]['FDate'][0:1].iloc[0,]
Bd= CDate-Day
B= B[(B['DayYear'] >= Bd)]
B= B[(B['DayYear'] <= CDate)]
Index= ['Year','Grid','Count']
C= B[Index].groupby(['Year','Grid']).sum().reset_index()
C1=C.query('Year>2017')
C1['Community']= C1.Grid.apply(commun)
print('This graph displays total {} incidents of the Frogtown Grid within {} days from date {}20XX'.format(Incident,Day,Date))
sns.set()
pd.pivot_table(C1, values='Count', index=['Community','Grid'], columns=['Year'],
fill_value=0).plot(kind= 'barh',
figsize=(12,10),title= Incident + ' Yearly UptoDate Total Incidents')
return plt.show()
#Firearm
def plot_toDate_Year_SPFirearm(Day=Max):
B= df_fire
Date= fgc[(fgc['DayYear'] == Day)]['FDate'][0:1].iloc[0,]
B= B[(B['DayYear'] <= Day)]
Index= ['Year','Community','Count']
C= B[Index].groupby(['Year','Community']).sum().reset_index()
print('This graph maps Firearm incidents of Saint Paul neighborhoods up to {}20XX'.format(Date))
sns.set()
pd.pivot_table(C, values='Count', index=['Community'], columns=['Year'],
fill_value=0).plot(kind= 'barh',
figsize=(12,10),title= 'Firearm Yearly UptoDate Total Incidents')
return plt.show()
def plot_toDate_Days_SPCrime_Norm(Incident='All',Day=Max, CDate=Max):
if Incident=='All':
B= df
else:
B= df[(df['Incident'] == Incident)]
Date= fgc[(fgc['DayYear'] == CDate)]['FDate'][0:1].iloc[0,]
Bd= CDate-Day
B= B[(B['DayYear'] >= Bd)]
B= B[(B['DayYear'] <= CDate)]
Index= ['Year','Community','Count']
C= B[Index].groupby(['Year','Community']).sum().reset_index()
C1=pd.merge(C, Norm, on='Community', how='left').reset_index()
C1['Norm_Count']= (C1.Count/C1.Pop) *10000
print('This graph displays total {} normalized incidents of Saint Paul neighborhoods within {} days from date {}20XX'.format(Incident,Day,Date))
sns.set()
pd.pivot_table(C1, values='Norm_Count', index=['Community'], columns=['Year'],
fill_value=0).plot(kind= 'barh',
figsize=(12,10),title= Incident + ' Yearly UptoDate Total Normalized per 10000 Persons')
return plt.show()
WARNING:root:Requests made without an app_token will be subject to strict throttling limits.
df_auto=df[df['IncType'].str.contains("Auto Accessories")]
df_auto['Amount']='Between $500-1000'
df_auto.Amount.loc[(df_auto['IncType'].str.contains("500"))] = 'Under $500'
df_auto.Amount.loc[(df_auto['IncType'].str.contains("Over"))] = 'Over $1000'
#df_auto.query('Year>2019')
import matplotlib.pyplot as plt
import seaborn as sns
def plot_SPAutoTheft(Day=Max):
B= df_auto.query('Year>2019')
#Date= fgc[(fgc['DayYear'] == Day)]['FDate'][0:1].iloc[0,]
#B= B[(B['DayYear'] <= Day)]
Index= ['Amount','Community','Count']
C= B[Index].groupby(['Amount','Community']).sum().reset_index()
print('This graph displays Auto Accessory Theft incidents by cost for Saint Paul neighborhoods since 2020')
sns.set()
pd.pivot_table(C, values='Count', index=['Community'], columns=['Amount'],
fill_value=0).plot(kind= 'barh',
figsize=(12,10),title= 'Auto Accessory Theft Incidents')
return plt.show()
plot_SPAutoTheft()
#fg.Incident.loc[(fg['Incident'] == 'Simple Asasult Dom.')] = 'Simple Assault Dom.'
This graph displays Auto Accessory Theft incidents by cost for Saint Paul neighborhoods since 2020

plot_toDate_Days_SPCrime_Norm('Discharge')
This graph displays total Discharge normalized incidents of Saint Paul neighborhoods within 273 days from date 9/29/20XX

plot_toDate_Days_SPCrime(Incident='Discharge')
This graph displays total Discharge incidents of Saint Paul neighborhoods within 273 days from date 9/29/20XX

#a=df.query("Incident=='Auto Theft'")
Wa.IncType.unique()
array(['Motor Vehicle Theft, Automobile', 'Motor Vehicle Theft',
'Motor Vehicle Theft, Trucks and Buses',
'Motor Vehicle Theft, All Other Vehicles',
'Att. Motor Vehicle Theft, Automobile',
'Att. Motor Vehicle Theft, Trucks and Buses',
'Att. Motor Vehicle Theft, All Other Vehicles'], dtype=object)
def plot_toDate_Year_SPCityCrime(Incident='All',Day=Max):
if Incident=='All':
B= df
else:
B= df[(df['Incident'] == Incident)]
Date= fgc[(fgc['DayYear'] == Day)]['FDate'][0:1].iloc[0,]
B= B[(B['DayYear'] <= Day)]
Index= ['Year','Count']
C= B[Index].groupby(['Year']).sum().reset_index()
print('This graph maps {} annual incidents of Saint Paul within {} days from {}20XX'.format(Incident,Day,Date))
sns.set()
pd.pivot_table(C, values='Count', index=['Year'],
fill_value=0).plot(kind= 'barh',
figsize=(6,4),title='St. Paul Total ' + Incident + ' Incidents up to 9/29/20XX')
return plt.show()
plot_toDate_Year_SPCityCrime("Discharge")
This graph maps Discharge annual incidents of Saint Paul within 273 days from 9/29/20XX

df.Incident.loc[(df['Incident'] == 'Simple Asasult Dom.')] = 'Simple Assault Dom.'
df.Incident.loc[(df['Incident'] == 'Graffiti')] = 'Vandalism'
df.Incident.loc[df["Incident"].isin([ "Rape","Agg. Assault",'Homicide'])]= 'Violent'
df.Incident.loc[df["Incident"].isin(["Simple Assault Dom.","Agg. Assault Dom."])]= 'Domestic Assault'
def plot_toDate_Days_SPTotalCrime(Day=Max, CDate=Max):
B=df
Date= fgc[(fgc['DayYear'] == CDate)]['FDate'][0:1].iloc[0,]
Bd= CDate-Day
B= B[(B['DayYear'] >= Bd)]
B= B[(B['DayYear'] <= CDate)]
mask = B['Incident'].isin(['Proactive Foot Patrol', 'Other'])
B=B[~mask]
Index= ['Year','Incident','Count']
C= B[Index].groupby(['Year','Incident']).sum().reset_index()
print('This graph displays total incidents in Saint Paul within {} days from date {}20XX'.format(Day,Date))
sns.set()
pd.pivot_table(C, values='Count', index=['Incident'], columns=['Year'],
fill_value=0).plot(kind= 'barh',
figsize=(12,10),title= 'Yearly UptoDate Total Incidents')
return plt.show()
plot_toDate_Days_SPTotalCrime()
This graph displays total incidents in Saint Paul within 273 days from date 9/29/20XX

a=df[df['IncType'].str.contains("Automobile")]
a['Incident']= 'Car Jacking'
def plot_toDate_Days_SPTotalCrime(Day=Max, CDate=Max):
B=a
Date= fgc[(fgc['DayYear'] == CDate)]['FDate'][0:1].iloc[0,]
Bd= CDate-Day
B= B[(B['DayYear'] >= Bd)]
B= B[(B['DayYear'] <= CDate)]
Index= ['Year','Incident','Count']
C= B[Index].groupby(['Year','Incident']).sum().reset_index()
print('This graph displays total car jacking incidents in Saint Paul within {} days from date {}20XX'.format(Day,Date))
sns.set()
pd.pivot_table(C, values='Count', index=['Incident'], columns=['Year'],
fill_value=0).plot(kind= 'barh',
figsize=(12,10),title= 'Yearly UptoDate Total Incidents')
return plt.show()
plot_toDate_Days_SPTotalCrime()
This graph displays total car jacking incidents in Saint Paul within 273 days from date 9/29/20XX

#df['TimeHour']= pd.to_datetime(df['Time'])
#df['Hour'] = df['TimeHour'].dt.hour.astype(int) #Create Hour Colum
#df['LateNight'] = df['Hour'].apply(lambda x: 1 if (x>21 or x<5) else 0) #Latenight designation from 10Pm to 6PM
df['LateNight'] = df['Hour'].apply(lambda x: 1 if (x>21 or x<5) else 0) #Latenight designation from 10Pm to 6PM
a= df[(df['DayYear'] < 224)]
a= a[(a['Incident'] =='Discharge' )]
a= a[(a['Year'] == 2021)]
a=a[['Hour','Count']].groupby(['Hour']).sum().reset_index()
a.columns=['Hour','Count']
b= df[(df['DayYear'] < 224)]
b= b[(b['Incident'] =='Discharge' )]
b= b[(b['Year'] == 2019)]
b=b[['LateNight','Count']].groupby(['LateNight']).sum().reset_index()
b.columns=['LateNight','Count']
b
| LateNight | Count | |
|---|---|---|
| 0 | 0 | 184 |
| 1 | 1 | 307 |
df
| Grid | Count | |
|---|---|---|
| 68 | 106.0 | 1 |
| 401 | 86.0 | 1 |
| 438 | 109.0 | 1 |
| 500 | 88.0 | 1 |
| 1298 | 86.0 | 1 |
| 1560 | 110.0 | 1 |
| 1878 | 89.0 | 1 |
| 2278 | 108.0 | 1 |
| 4164 | 88.0 | 1 |
| 4440 | 92.0 | 1 |
| 4450 | 86.0 | 1 |
| 4489 | 88.0 | 1 |
| 5653 | 106.0 | 1 |
| 6086 | 107.0 | 1 |
| 6266 | 87.0 | 1 |
| 6728 | 106.0 | 1 |
| 7072 | 106.0 | 1 |
| 7154 | 91.0 | 1 |
| 7866 | 86.0 | 1 |
| 8296 | 89.0 | 1 |
| 8544 | 109.0 | 1 |
| 8892 | 86.0 | 1 |
| 9359 | 90.0 | 1 |
| 9367 | 92.0 | 1 |
| 9518 | 67.0 | 1 |
| 10235 | 91.0 | 1 |
| 10453 | 66.0 | 1 |
| 10602 | 87.0 | 1 |
| 10649 | 91.0 | 1 |
| 10949 | 108.0 | 1 |
| ... | ... | ... |
| 38025 | 68.0 | 1 |
| 38095 | 68.0 | 1 |
| 38306 | 110.0 | 1 |
| 38354 | 88.0 | 1 |
| 38357 | 110.0 | 1 |
| 38528 | 107.0 | 1 |
| 38595 | 88.0 | 1 |
| 38642 | 88.0 | 1 |
| 38668 | 89.0 | 1 |
| 38721 | 90.0 | 1 |
| 38835 | 106.0 | 1 |
| 38959 | 87.0 | 1 |
| 39068 | 87.0 | 1 |
| 39091 | 86.0 | 1 |
| 39092 | 88.0 | 1 |
| 39265 | 89.0 | 1 |
| 39439 | 67.0 | 1 |
| 39515 | 110.0 | 1 |
| 39539 | 108.0 | 1 |
| 39604 | 67.0 | 1 |
| 39605 | 67.0 | 1 |
| 39610 | 110.0 | 1 |
| 39611 | 110.0 | 1 |
| 39684 | 110.0 | 1 |
| 39685 | 110.0 | 1 |
| 39725 | 88.0 | 1 |
| 39887 | 106.0 | 1 |
| 39984 | 87.0 | 1 |
| 40104 | 90.0 | 1 |
| 40163 | 89.0 | 1 |
424 rows × 2 columns
from geopy.geocoders import Nominatim # convert an address into latitude and longitude values
import matplotlib.cm as cm
import matplotlib.colors as colors
import folium # map rendering library
sp_geo = r'Geo-Json\Saint Paul Police Grid - Shapefile.geojson'
df_auto=df[df['IncType'].str.contains("Auto Accessories")]
df_auto=df_auto.query("Year>2020")
#list(df_auto.columns)
Features= ['Grid','Count']
df1=df_auto[Features]
# Create a sum and divide by Count; and
N= df1.groupby(['Grid']).sum()
N=N.reset_index()
N.Grid = N.Grid.astype(int)
N.Grid = N.Grid.astype(str)
N
#Create Saint Paul Population Map
FG_map = folium.Map(location=[44.958326, -93.132926], zoom_start=12,tiles="OpenStreetMap")
FG_map.choropleth(
geo_data=sp_geo,
data=N,
columns=['Grid','Count'],
#nan_fill_color='purple',
#nan_fill_opacity=0.4,
key_on="feature.properties.gridnum",
fill_color='YlOrRd',
fill_opacity=0.7,
line_opacity=0.2,
legend_name='Auto Accessory Thefts since 2021',
highlight= True,
name= 'Clean Map'
)
# display map
FG_map
#Auto Accessories
fgc_auto=fgc[fgc['IncType'].str.contains("Auto Accessories")]
fgc_auto['Amount']='Medium'
fgc_auto.Amount.loc[(fgc_auto['IncType'].str.contains("500"))] = 'Small'
fgc_auto.Amount.loc[(fgc_auto['IncType'].str.contains("Over"))] = 'Large'
#df_auto.query('Year>2019')
def plot_AutoAccesoriesTheft_todate(Day=Max):
Index =['Block','Latitude','Longitude', 'Count','Amount','Year']
# generate a new map
FG_map = folium.Map(location=[44.958326, -93.122926], zoom_start=14,tiles="OpenStreetMap")
#setup
#Date= fgc_auto[(fgc_auto['DayYear'] == Day)]['FDate'][0:1].iloc[0,]
B= fgc_auto
B= B[(B['DayYear'] <= Day)]
B17=B.query('Amount == "Small"')
B17=B17[Index].groupby(['Amount','Block','Latitude','Longitude']).sum().reset_index()
B18=B.query('Amount == "Medium"')
B18=B18[Index].groupby(['Amount','Block','Latitude','Longitude']).sum().reset_index()
B19=B.query('Amount == "Large"')
B19=B19[Index].groupby(['Amount','Block','Latitude','Longitude']).sum().reset_index()
print('This map displays Auto Accessory incidents in 2021')
for index, row in B17.iterrows():
popup_text = "Amount: Small<br> Address: {}<br> total incidents: {}"
popup_text = popup_text.format(row["Block"], row['Count'])
folium.CircleMarker(location=(row["Latitude"],row["Longitude"]),
radius=row['Count']+3,
color="#E37222",
popup=popup_text,
fill=True).add_to(FG_map)
for index, row in B18.iterrows():
popup_text = "Amount: Medium<br> Address: {}<br> total incidents: {}"
popup_text = popup_text.format(row["Block"], row['Count'])
folium.CircleMarker(location=(row["Latitude"], row["Longitude"]),
radius=row['Count']+3,
color="#007849",
popup=popup_text,
fill=True).add_to(FG_map)
for index, row in B19.iterrows():
popup_text = "Amount: Large<br> Address: {}<br> total incidents: {}"
popup_text = popup_text.format(row["Block"], row['Count'])
folium.CircleMarker(location=(row["Latitude"],row["Longitude"]),
radius=row['Count']+3,
color="#800080",
popup=popup_text,
fill=True).add_to(FG_map)
return FG_map
plot_AutoAccesoriesTheft_todate(20)
This map displays Auto Accessory incidents in 2021
def plot_AutoAccesoriesTheft():
Index =['Block','Latitude','Longitude', 'Count','Amount','Year']
# generate a new map
FG_map = folium.Map(location=[44.958326, -93.122926], zoom_start=14,tiles="OpenStreetMap")
#setup
#Date= fgc_auto[(fgc_auto['DayYear'] == Day)]['FDate'][0:1].iloc[0,]
B= fgc_auto.query('Year>2019')
B17=B.query('Amount == "Small"')
B17=B17[Index].groupby(['Amount','Block','Latitude','Longitude']).sum().reset_index()
B18=B.query('Amount == "Medium"')
B18=B18[Index].groupby(['Amount','Block','Latitude','Longitude']).sum().reset_index()
B19=B.query('Amount == "Large"')
B19=B19[Index].groupby(['Amount','Block','Latitude','Longitude']).sum().reset_index()
print('This map displays Auto Accessory incidents for Frogtown/Midway/Rondo neighborhood since 2020')
for index, row in B17.iterrows():
popup_text = "Amount: Small<br> Address: {}<br> total incidents: {}"
popup_text = popup_text.format(row["Block"], row['Count'])
folium.CircleMarker(location=(row["Latitude"],row["Longitude"]),
radius=row['Count']+3,
color="#E37222",
popup=popup_text,
fill=True).add_to(FG_map)
for index, row in B18.iterrows():
popup_text = "Amount: Medium<br> Address: {}<br> total incidents: {}"
popup_text = popup_text.format(row["Block"], row['Count'])
folium.CircleMarker(location=(row["Latitude"], row["Longitude"]),
radius=row['Count']+3,
color="#007849",
popup=popup_text,
fill=True).add_to(FG_map)
for index, row in B19.iterrows():
popup_text = "Amount: Large<br> Address: {}<br> total incidents: {}"
popup_text = popup_text.format(row["Block"], row['Count'])
folium.CircleMarker(location=(row["Latitude"],row["Longitude"]),
radius=row['Count']+3,
color="#800080",
popup=popup_text,
fill=True).add_to(FG_map)
return FG_map
plot_AutoAccesoriesTheft()
This map displays Auto Accessory incidents for Frogtown/Midway/Rondo neighborhood since 2020
from __future__ import print_function
from ipywidgets import interact, interactive, fixed, interact_manual
import ipywidgets as widgets
import pandas as pd
import numpy as np
%matplotlib inline
import folium
import warnings
warnings.filterwarnings('ignore')
#Saint Paul Data Socrata
from sodapy import Socrata
#New Upload Method Get Information from Socrata API
client = Socrata("information.stpaul.gov", None)
#Easier to bulk upload
results = client.get("gppb-g9cg", limit=1000000)
df = pd.DataFrame.from_records(results)
#rename columns [Note the order of Columns have changed]
cols= ['Block','CallDispCode','CallDisposition','Case','Code', 'Count','Date','Grid','Incident','IncType','Neighborhood','NNum','Time']
df.columns= cols
df=df.dropna()
df = df.astype({"Case": int, "Code": int, "Grid":float, "NNum":int,"Count":int})
#convert MOnth
def Convert_Month(num):
Months= ['January','February','March','April','May','June','July','August','September','October','November','December']
for i in range(12):
if num==(i+1):
Xi=Months[i]
return Xi
#Community function
def commun(x):
if x in [67,68,87,88,89,90,91,92]:
return 'Thomas-Frogtown'
elif x in [5,6,7,8,25,26,27,28,45,46,47,48]:
return 'Como'
elif x in [107, 108, 109, 110,127,128,129,130]:
return 'Summit-University'
elif x in [101,102,103,104,105,106,122,123,124,125,126]:
return 'Union Park'
elif x in [63,64,65,66,83,84,85,86]:
return 'Midway'
elif x in [142,143,144,145,146,162,163,164,165,166]:
return 'Macalester_Groveland'
elif x in [182,183,184,185,186,202,203,204,205,206,223,224,225,242,243,244,245,246]:
return 'Highland Park'
elif x in [147,148,149,167,168]:
return 'Summit Hill'
elif x in [1,2,21,22,43,44,61,62,81,82]:
return 'St. Anthony'
elif x in [226,207,187,188,189,267,268,169,170,171,249,150,151,230]:
return 'West 7th'
elif x in [209,210,211,212,213,214,215,192,193,194,195,172,173,174,175]:
return 'West Side'
elif x in [111,112,131,132,133,152,153]:
return 'Capital_River'
elif x in [98,99,100,118,119,119,120,137,138,139,140,160,197,180,200,240,280]:
return 'Battle_Creek'
elif x in [76,95,96,97,115,116,117,138,114,136]:
return 'Dayton Bluff'
elif x in [9,10,11,12,29,30,31,32,49,50,51,52,269,69,70,71,72]:
return 'North End'
elif x in [13,14,15,16,33,34,35,36,53,54,55,56,73,74,75,93,94]:
return 'Payne-Phalen'
elif x in [17,18,19,20,37,38,39,40,56,57,58,59,60,77,78,79,80]:
return 'Greater East Side'
else:
return 'NaN'
#Add Time Variables
df= df[df.Case != 18254093] #messed up time variable
df['Date']= pd.to_datetime(df['Date'])
df['Year']= df['Date'].dt.year
df=df.query('Year > 2017')
df['DayYear'] = df['Date'].dt.dayofyear
df['Community']= df['Grid'].apply(commun)
df= df.query('Code not in [9954,9959] and Community !="NaN"')
df['Month'] = df['Date'].dt.month # Create Month Category
df['Day'] = df['Date'].dt.day #Create Day of the Current month
df
#Current Date Numeric
Max= df.iloc[0,14]
#GeorgeFloyd Death date
GE= 146
#Covid start Date
CV= 73
def plot_toDate_Days_SPCrime(Incident='All',Day=Max, CDate=Max):
if Incident=='All':
B= df
else:
B= df[(df['Incident'] == Incident)]
Date= fgc[(fgc['DayYear'] == CDate)]['FDate'][0:1].iloc[0,]
Bd= CDate-Day
B= B[(B['DayYear'] >= Bd)]
B= B[(B['DayYear'] <= CDate)]
Index= ['Year','Community','Count']
C= B[Index].groupby(['Year','Community']).sum().reset_index()
print('This graph displays total {} incidents of Saint Paul neighborhoods within {} days from date {}20XX'.format(Incident,Day,Date))
sns.set()
pd.pivot_table(C, values='Count', index=['Community'], columns=['Year'],
fill_value=0).plot(kind= 'barh',
figsize=(12,10),title= Incident + ' Yearly UptoDate Total Incidents')
return plt.show()
WARNING:root:Requests made without an app_token will be subject to strict throttling limits.
Minneapolis
#Minneapolis
import pandas as pd
import numpy as np
import warnings
warnings.filterwarnings('ignore')
import matplotlib as mpl
import matplotlib.pyplot as plt
%matplotlib inline
from IPython.display import HTML
from IPython.display import display
import requests # library to handle requests
import matplotlib.pyplot as plt
import seaborn as sns
#Load Data
mp_crime19 = pd.read_csv('Datasets/MCrime_2019.csv')
mp_crime20 = pd.read_csv('Datasets/MCrime_2020.csv')
mp_crime21 = pd.read_csv('Datasets/MCrime_2021.csv')
mp_crime= pd.concat([mp_crime19, mp_crime20, mp_crime21], axis=0)
#Index=['precinct', 'neighborhood', 'offense','description','reportedDate']
#mp_crime=mp_crime[Index]
mp_crime
| X | Y | publicaddress | caseNumber | precinct | reportedDate | reportedTime | beginDate | reportedDateTime | beginTime | ... | enteredDate | centergbsid | centerLong | centerLat | centerX | centerY | neighborhood | lastchanged | LastUpdateDateETL | OBJECTID | |
|---|---|---|---|---|---|---|---|---|---|---|---|---|---|---|---|---|---|---|---|---|---|
| 0 | -93.265033 | 44.977760 | 0003XX 4TH ST S | MP2019248516 | 1 | 2019/08/19 00:00:00+00 | 0 | 2019/08/12 00:00:00+00 | 2019/08/19 00:00:00+00 | 0 | ... | 2019/08/19 00:00:00+00 | 18596.0 | -93.265034 | 44.977764 | -10382216 | 5618021 | Downtown West | 2019/08/24 00:00:00+00 | 2019/08/25 08:15:46+00 | 1 |
| 1 | -93.244857 | 44.945648 | 0031XX 19TH AVE S | MP2019253346 | 3 | 2019/08/23 00:00:00+00 | 1150 | 2019/08/22 00:00:00+00 | 2019/08/23 11:50:00+00 | 1606 | ... | 2019/08/24 00:00:00+00 | 13244.0 | -93.244863 | 44.945650 | -10379970 | 5612969 | Corcoran | 2019/08/24 00:00:00+00 | 2019/08/25 08:15:46+00 | 2 |
| 2 | -93.293204 | 45.030536 | 0041XX DUPONT AVE N | MP2019253392 | 4 | 2019/08/23 00:00:00+00 | 1606 | 2019/08/23 00:00:00+00 | 2019/08/23 16:06:00+00 | 1220 | ... | 2019/08/24 00:00:00+00 | 10605.0 | -93.293211 | 45.030541 | -10385352 | 5626330 | Webber - Camden | 2019/08/24 00:00:00+00 | 2019/08/25 08:15:46+00 | 3 |
| 3 | -93.278804 | 44.948344 | 00001X LAKE ST W | MP2019253470 | 5 | 2019/08/23 00:00:00+00 | 1420 | 2019/08/23 00:00:00+00 | 2019/08/23 14:20:00+00 | 1330 | ... | 2019/08/24 00:00:00+00 | 21928.0 | -93.278808 | 44.948347 | -10383749 | 5613393 | Whittier | 2019/08/24 00:00:00+00 | 2019/08/25 08:15:46+00 | 4 |
| 4 | -93.305206 | 44.948427 | 0018XX LAKE ST W | MP2019253486 | 5 | 2019/08/23 00:00:00+00 | 1513 | 2019/08/10 00:00:00+00 | 2019/08/23 15:13:00+00 | 452 | ... | 2019/08/24 00:00:00+00 | 19969.0 | -93.305210 | 44.948430 | -10386688 | 5613406 | ECCO | 2019/08/24 00:00:00+00 | 2019/08/25 08:15:46+00 | 5 |
| 5 | -93.273477 | 44.948351 | 0002XX LAKE ST E | MP2019253622 | 3 | 2019/08/23 00:00:00+00 | 1506 | 2019/07/20 00:00:00+00 | 2019/08/23 15:06:00+00 | 1 | ... | 2019/08/24 00:00:00+00 | 19103.0 | -93.273484 | 44.948355 | -10383156 | 5613394 | Phillips West | 2019/08/24 00:00:00+00 | 2019/08/25 08:15:46+00 | 6 |
| 6 | -93.226873 | 44.993251 | 0003XX STINSON BLVD NE | MP2019253649 | 2 | 2019/08/23 00:00:00+00 | 2023 | 2019/08/23 00:00:00+00 | 2019/08/23 20:23:00+00 | 1545 | ... | 2019/08/24 00:00:00+00 | 17962.0 | -93.226875 | 44.993251 | -10377968 | 5620459 | Mid - City Industrial | 2019/08/24 00:00:00+00 | 2019/08/25 08:15:46+00 | 7 |
| 7 | -93.305700 | 44.993606 | 0014XX NEWTON AVE N | MP2019253685 | 4 | 2019/08/23 00:00:00+00 | 1705 | 2019/07/22 00:00:00+00 | 2019/08/23 17:05:00+00 | 0 | ... | 2019/08/24 00:00:00+00 | 11496.0 | -93.305708 | 44.993611 | -10386743 | 5620515 | Willard - Hay | 2019/08/24 00:00:00+00 | 2019/08/25 08:15:46+00 | 8 |
| 8 | -93.240042 | 44.980899 | 0011XX UNIVERSITY AVE SE | MP2019253704 | 2 | 2019/08/23 00:00:00+00 | 1837 | 2019/08/22 00:00:00+00 | 2019/08/23 18:37:00+00 | 1800 | ... | 2019/08/24 00:00:00+00 | 16644.0 | -93.240044 | 44.980902 | -10379434 | 5618515 | Marcy Holmes | 2019/08/24 00:00:00+00 | 2019/08/25 08:15:46+00 | 9 |
| 9 | -93.298352 | 44.942113 | 0033XX HENNEPIN AVE | MP2019253706 | 5 | 2019/08/23 00:00:00+00 | 1653 | 2019/08/23 00:00:00+00 | 2019/08/23 16:53:00+00 | 900 | ... | 2019/08/24 00:00:00+00 | 11735.0 | -93.298356 | 44.942118 | -10385925 | 5612413 | ECCO | 2019/08/24 00:00:00+00 | 2019/08/25 08:15:46+00 | 10 |
| 10 | -93.267557 | 44.926037 | 0042XX PORTLAND AVE | MP2019253716 | 3 | 2019/08/24 00:00:00+00 | 24 | 2019/08/22 00:00:00+00 | 2019/08/24 00:24:00+00 | 2100 | ... | 2019/08/24 00:00:00+00 | 13511.0 | -93.267563 | 44.926042 | -10382497 | 5609885 | Regina | 2019/08/24 00:00:00+00 | 2019/08/25 08:15:46+00 | 11 |
| 11 | -93.249115 | 45.013157 | NaN | MP2019253723 | 2 | 2019/08/23 00:00:00+00 | 1804 | 2019/08/23 00:00:00+00 | 2019/08/23 18:04:00+00 | 1615 | ... | 2019/08/24 00:00:00+00 | NaN | -93.249120 | 45.013160 | -10380444 | 5623593 | Holland | 2019/08/24 00:00:00+00 | 2019/08/25 08:15:46+00 | 12 |
| 12 | -93.245683 | 44.963493 | 0009XX 19TH AVE S | MP2019253751 | 3 | 2019/08/23 00:00:00+00 | 1738 | 2019/08/22 00:00:00+00 | 2019/08/23 17:38:00+00 | 1800 | ... | 2019/08/24 00:00:00+00 | 18344.0 | -93.245689 | 44.963496 | -10380062 | 5615776 | Seward | 2019/08/24 00:00:00+00 | 2019/08/25 08:15:46+00 | 13 |
| 13 | -93.269677 | 44.977741 | 0005XX MARQUETTE AVE | MP2019253771 | 1 | 2019/08/23 00:00:00+00 | 1941 | 2019/08/21 00:00:00+00 | 2019/08/23 19:41:00+00 | 0 | ... | 2019/08/24 00:00:00+00 | 17245.0 | -93.269678 | 44.977745 | -10382733 | 5618018 | Downtown West | 2019/08/24 00:00:00+00 | 2019/08/25 08:15:46+00 | 14 |
| 14 | -93.304712 | 45.034408 | 0043XX MORGAN AVE N | MP2019253780 | 4 | 2019/08/23 00:00:00+00 | 1801 | 2019/08/23 00:00:00+00 | 2019/08/23 18:01:00+00 | 1700 | ... | 2019/08/25 00:00:00+00 | 10744.0 | -93.304718 | 45.034411 | -10386633 | 5626940 | Webber - Camden | 2019/08/25 00:00:00+00 | 2019/08/25 08:15:46+00 | 15 |
| 15 | -93.279604 | 44.960003 | 0023XX BLAISDELL AVE | MP2019253783 | 5 | 2019/08/23 00:00:00+00 | 2052 | 2019/08/23 00:00:00+00 | 2019/08/23 20:52:00+00 | 1804 | ... | 2019/08/24 00:00:00+00 | 16776.0 | -93.279608 | 44.960009 | -10383838 | 5615227 | Whittier | 2019/09/04 00:00:00+00 | 2019/09/05 08:15:34+00 | 16 |
| 16 | -93.312734 | 44.989941 | 0025XX 12TH AVE N | MP2019253840 | 4 | 2019/08/23 00:00:00+00 | 1920 | 2019/08/23 00:00:00+00 | 2019/08/23 19:20:00+00 | 1858 | ... | 2019/08/24 00:00:00+00 | 17991.0 | -93.312737 | 44.989945 | -10387526 | 5619938 | Willard - Hay | 2019/08/24 00:00:00+00 | 2019/08/25 08:15:46+00 | 17 |
| 17 | -93.296564 | 44.924911 | NaN | MP2019253976 | 5 | 2019/08/23 00:00:00+00 | 2143 | 2019/08/23 00:00:00+00 | 2019/08/23 21:43:00+00 | 2000 | ... | 2019/08/24 00:00:00+00 | NaN | -93.296570 | 44.924910 | -10385726 | 5609708 | East Harriet | 2019/08/24 00:00:00+00 | 2019/08/25 08:15:46+00 | 18 |
| 18 | -93.260263 | 44.975746 | NaN | MP2019254062 | 1 | 2019/08/23 00:00:00+00 | 2320 | 2019/08/23 00:00:00+00 | 2019/08/23 23:20:00+00 | 2215 | ... | 2019/08/24 00:00:00+00 | NaN | -93.260260 | 44.975750 | -10381685 | 5617704 | Downtown East | 2019/08/24 00:00:00+00 | 2019/08/25 08:15:46+00 | 19 |
| 19 | -93.262850 | 44.978148 | 0004XX 3RD ST S | MP2019254118 | 1 | 2019/08/23 00:00:00+00 | 2343 | 2019/08/23 00:00:00+00 | 2019/08/23 23:43:00+00 | 1430 | ... | 2019/08/24 00:00:00+00 | 18615.0 | -93.262857 | 44.978154 | -10381973 | 5618082 | Downtown West | 2019/08/24 00:00:00+00 | 2019/08/25 08:15:46+00 | 20 |
| 20 | -93.255511 | 44.960029 | 0013XX 23RD ST E | MP2019254234 | 3 | 2019/08/24 00:00:00+00 | 210 | 2019/08/24 00:00:00+00 | 2019/08/24 02:10:00+00 | 52 | ... | 2019/08/24 00:00:00+00 | 16866.0 | -93.255511 | 44.960035 | -10381156 | 5615231 | Ventura Village | 2019/08/24 00:00:00+00 | 2019/08/25 08:15:46+00 | 21 |
| 21 | -93.277017 | 44.978015 | NaN | MP2019254268 | 1 | 2019/08/24 00:00:00+00 | 423 | 2019/08/24 00:00:00+00 | 2019/08/24 04:23:00+00 | 137 | ... | 2019/08/24 00:00:00+00 | NaN | -93.277030 | 44.978020 | -10383550 | 5618061 | Downtown West | 2019/08/24 00:00:00+00 | 2019/08/25 08:15:46+00 | 22 |
| 22 | -93.230789 | 44.946844 | 0028XX 31ST ST E | MP2019254275 | 3 | 2019/08/24 00:00:00+00 | 353 | 2019/08/24 00:00:00+00 | 2019/08/24 03:53:00+00 | 150 | ... | 2019/08/24 00:00:00+00 | 11257.0 | -93.230794 | 44.946849 | -10378404 | 5613157 | Longfellow | 2019/08/24 00:00:00+00 | 2019/08/25 08:15:46+00 | 23 |
| 23 | -93.277708 | 44.970503 | 0013XX NICOLLET MALL | MP2019254299 | 1 | 2019/08/24 00:00:00+00 | 508 | 2019/08/24 00:00:00+00 | 2019/08/24 05:08:00+00 | 200 | ... | 2019/08/24 00:00:00+00 | 16714.0 | -93.277714 | 44.970506 | -10383627 | 5616879 | Loring Park | 2019/08/24 00:00:00+00 | 2019/08/25 08:15:46+00 | 24 |
| 24 | -93.273136 | 44.980804 | 0004XX 1ST AVE N | MP2019254307 | 1 | 2019/08/24 00:00:00+00 | 211 | 2019/08/24 00:00:00+00 | 2019/08/24 02:11:00+00 | 130 | ... | 2019/08/24 00:00:00+00 | 17121.0 | -93.273141 | 44.980808 | -10383118 | 5618500 | Downtown West | 2019/08/31 00:00:00+00 | 2019/09/01 08:15:37+00 | 25 |
| 25 | -93.273109 | 44.981643 | 0001XX 4TH ST N | MP2019254344 | 1 | 2019/08/24 00:00:00+00 | 350 | 2019/08/24 00:00:00+00 | 2019/08/24 03:50:00+00 | 244 | ... | 2019/08/24 00:00:00+00 | 17122.0 | -93.273116 | 44.981648 | -10383115 | 5618632 | Downtown West | 2019/08/26 00:00:00+00 | 2019/08/27 08:15:35+00 | 26 |
| 26 | -93.271959 | 44.980830 | 00001X 4TH ST N | MP2019254392 | 1 | 2019/08/24 00:00:00+00 | 553 | 2019/08/24 00:00:00+00 | 2019/08/24 05:53:00+00 | 245 | ... | 2019/08/24 00:00:00+00 | 17119.0 | -93.271960 | 44.980833 | -10382987 | 5618504 | Downtown West | 2019/09/04 00:00:00+00 | 2019/09/05 08:15:34+00 | 27 |
| 27 | -93.292126 | 44.922284 | 0044XX COLFAX AVE S | MP2019254430 | 5 | 2019/08/24 00:00:00+00 | 616 | 2019/08/24 00:00:00+00 | 2019/08/24 06:16:00+00 | 453 | ... | 2019/08/24 00:00:00+00 | 20551.0 | -93.292129 | 44.922286 | -10385232 | 5609295 | East Harriet | 2019/10/04 00:00:00+00 | 2019/10/05 08:15:39+00 | 28 |
| 28 | -93.232442 | 44.982386 | 0006XX 15TH AVE SE | MP2019254513 | 2 | 2019/08/24 00:00:00+00 | 1323 | 2019/08/12 00:00:00+00 | 2019/08/24 13:23:00+00 | 1200 | ... | 2019/08/24 00:00:00+00 | 16600.0 | -93.232448 | 44.982393 | -10378588 | 5618749 | Marcy Holmes | 2019/08/24 00:00:00+00 | 2019/08/25 08:15:46+00 | 29 |
| 29 | -93.278804 | 44.948344 | 00001X LAKE ST W | MP2019254515 | 5 | 2019/08/24 00:00:00+00 | 923 | 2019/08/24 00:00:00+00 | 2019/08/24 09:23:00+00 | 900 | ... | 2019/08/24 00:00:00+00 | 21928.0 | -93.278808 | 44.948347 | -10383749 | 5613393 | Whittier | 2019/08/24 00:00:00+00 | 2019/08/25 08:15:46+00 | 30 |
| ... | ... | ... | ... | ... | ... | ... | ... | ... | ... | ... | ... | ... | ... | ... | ... | ... | ... | ... | ... | ... | ... |
| 1963 | -93.268977 | 44.958255 | 0024XX 5TH AVE S | MP202123262 | 3 | 2021/02/02 00:00:00+00 | 1514 | 2021/02/02 00:00:00+00 | 2021/02/02 15:14:00+00 | 1514 | ... | 2021/02/03 00:00:00+00 | 22549.0 | -93.268978 | 44.958261 | -10382655 | 5614952 | Phillips West | 2021/02/03 00:00:00+00 | 2021/02/04 07:03:32+00 | 1964 |
| 1964 | -93.267746 | 44.949209 | 0029XX PORTLAND AVE | MP202123280 | 3 | 2021/02/02 00:00:00+00 | 1924 | 2019/11/14 00:00:00+00 | 2021/02/02 19:24:00+00 | 1100 | ... | 2021/02/03 00:00:00+00 | 17502.0 | -93.267751 | 44.949214 | -10382518 | 5613529 | Phillips West | 2021/02/03 00:00:00+00 | 2021/02/04 07:03:32+00 | 1965 |
| 1965 | -93.281014 | 44.974494 | 0012XX HENNEPIN AVE | MP202123330 | 1 | 2021/02/02 00:00:00+00 | 1700 | 2021/02/02 00:00:00+00 | 2021/02/02 17:00:00+00 | 1652 | ... | 2021/02/03 00:00:00+00 | 16661.0 | -93.281022 | 44.974496 | -10383995 | 5617507 | Loring Park | 2021/02/03 00:00:00+00 | 2021/02/04 07:03:32+00 | 1966 |
| 1966 | -93.288039 | 44.954638 | 0026XX LYNDALE AVE S | MP202123341 | 5 | 2021/02/02 00:00:00+00 | 1725 | 2021/02/02 00:00:00+00 | 2021/02/02 17:25:00+00 | 1300 | ... | 2021/02/03 00:00:00+00 | 16678.0 | -93.288048 | 44.954638 | -10384777 | 5614383 | Lowry Hill East | 2021/02/03 00:00:00+00 | 2021/02/04 07:03:32+00 | 1967 |
| 1967 | -93.310272 | 44.933586 | NaN | MP202123351 | 5 | 2021/02/02 00:00:00+00 | 1750 | 2021/02/02 00:00:00+00 | 2021/02/02 17:50:00+00 | 1700 | ... | 2021/02/02 00:00:00+00 | NaN | -93.310280 | 44.933590 | -10387252 | 5611072 | East Harriet | 2021/02/03 00:00:00+00 | 2021/02/04 07:03:32+00 | 1968 |
| 1968 | -93.229047 | 44.960969 | 0029XX 22ND ST E | MP202123371 | 3 | 2021/02/02 00:00:00+00 | 1827 | 2021/01/31 00:00:00+00 | 2021/02/02 18:27:00+00 | 0 | ... | 2021/02/03 00:00:00+00 | 17405.0 | -93.229050 | 44.960974 | -10378210 | 5615379 | Seward | 2021/02/03 00:00:00+00 | 2021/02/04 07:03:32+00 | 1969 |
| 1969 | -93.238533 | 44.962749 | 0023XX FRANKLIN AVE E | MP202123398 | 3 | 2021/02/02 00:00:00+00 | 1800 | 2021/02/01 00:00:00+00 | 2021/02/02 18:00:00+00 | 2200 | ... | 2021/02/03 00:00:00+00 | 18338.0 | -93.238541 | 44.962752 | -10379266 | 5615659 | Seward | 2021/02/03 00:00:00+00 | 2021/02/04 07:03:32+00 | 1970 |
| 1970 | -93.281014 | 44.974494 | 0012XX HENNEPIN AVE | MP202123405 | 1 | 2021/02/02 00:00:00+00 | 1835 | 2021/01/29 00:00:00+00 | 2021/02/02 18:35:00+00 | 1100 | ... | 2021/02/03 00:00:00+00 | 16661.0 | -93.281022 | 44.974496 | -10383995 | 5617507 | Loring Park | 2021/02/05 00:00:00+00 | 2021/02/06 07:03:57+00 | 1971 |
| 1971 | -93.261916 | 44.980442 | 0004XX 2ND ST S | MP202123441 | 1 | 2021/02/02 00:00:00+00 | 1906 | 2021/02/02 00:00:00+00 | 2021/02/02 19:06:00+00 | 600 | ... | 2021/02/03 00:00:00+00 | 20491.0 | -93.261916 | 44.980444 | -10381869 | 5618443 | Downtown West | 2021/02/03 00:00:00+00 | 2021/02/04 07:03:32+00 | 1972 |
| 1972 | -93.263111 | 45.010540 | 0022XX UNIVERSITY AVE NE | MP202123447 | 2 | 2021/02/02 00:00:00+00 | 1912 | 2020/01/28 00:00:00+00 | 2021/02/02 19:12:00+00 | 350 | ... | 2021/02/03 00:00:00+00 | 14501.0 | -93.263114 | 45.010545 | -10382002 | 5623181 | Holland | 2021/02/03 00:00:00+00 | 2021/02/04 07:03:32+00 | 1973 |
| 1973 | -93.262635 | 44.945668 | 0031XX CHICAGO AVE | MP202123481 | 3 | 2021/02/02 00:00:00+00 | 2013 | 2021/02/02 00:00:00+00 | 2021/02/02 20:13:00+00 | 1945 | ... | 2021/02/03 00:00:00+00 | 16376.0 | -93.262642 | 44.945673 | -10381949 | 5612972 | Central | 2021/02/03 00:00:00+00 | 2021/02/04 07:03:32+00 | 1974 |
| 1974 | -93.256167 | 44.967446 | NaN | MP202123722 | 1 | 2021/02/03 00:00:00+00 | 250 | 2021/02/03 00:00:00+00 | 2021/02/03 02:50:00+00 | 216 | ... | 2021/02/03 00:00:00+00 | NaN | -93.256170 | 44.967450 | -10381229 | 5616398 | Elliot Park | 2021/02/03 00:00:00+00 | 2021/02/04 07:03:32+00 | 1975 |
| 1975 | -93.272741 | 44.960899 | NaN | MP2021700742 | 5 | 2021/01/29 00:00:00+00 | 1245 | 2021/01/28 00:00:00+00 | 2021/01/29 12:45:00+00 | 2330 | ... | 2021/02/03 00:00:00+00 | NaN | -93.272740 | 44.960900 | -10383074 | 5615368 | Whittier | 2021/02/04 00:00:00+00 | 2021/02/05 07:01:48+00 | 1976 |
| 1976 | -93.225687 | 44.920554 | 0045XX 32ND AVE S | MP2021700744 | 3 | 2021/02/01 00:00:00+00 | 833 | 2021/01/31 00:00:00+00 | 2021/02/01 08:33:00+00 | 30 | ... | 2021/02/03 00:00:00+00 | 12954.0 | -93.225688 | 44.920554 | -10377836 | 5609023 | Ericsson | 2021/02/03 00:00:00+00 | 2021/02/04 07:03:32+00 | 1977 |
| 1977 | -93.308386 | 45.026803 | 0039XX PENN AVE N | MP2021700745 | 4 | 2021/02/01 00:00:00+00 | 853 | 2021/01/29 00:00:00+00 | 2021/02/01 08:53:00+00 | 900 | ... | 2021/02/03 00:00:00+00 | 10495.0 | -93.308390 | 45.026805 | -10387042 | 5625742 | Victory | 2021/02/03 00:00:00+00 | 2021/02/04 07:03:32+00 | 1978 |
| 1978 | -93.264728 | 44.984833 | 00008X HENNEPIN AVE | MP2021700750 | 1 | 2021/02/01 00:00:00+00 | 1023 | 2021/01/30 00:00:00+00 | 2021/02/01 10:23:00+00 | 2200 | ... | 2021/02/03 00:00:00+00 | 15152.0 | -93.264736 | 44.984837 | -10382182 | 5619134 | Downtown West | 2021/02/03 00:00:00+00 | 2021/02/04 07:03:32+00 | 1979 |
| 1979 | -93.297031 | 44.945655 | 0031XX GIRARD AVE S | MP2021700755 | 5 | 2021/02/01 00:00:00+00 | 1141 | 2020/07/10 00:00:00+00 | 2021/02/01 11:41:00+00 | 2100 | ... | 2021/02/03 00:00:00+00 | 14074.0 | -93.297036 | 44.945660 | -10385778 | 5612970 | CARAG | 2021/02/04 00:00:00+00 | 2021/02/05 07:01:48+00 | 1980 |
| 1980 | -93.289360 | 44.949202 | 0029XX ALDRICH AVE S | MP2021700757 | 5 | 2021/02/01 00:00:00+00 | 1145 | 2021/01/29 00:00:00+00 | 2021/02/01 11:45:00+00 | 2000 | ... | 2021/02/03 00:00:00+00 | 21710.0 | -93.289364 | 44.949203 | -10384924 | 5613528 | Lowry Hill East | 2021/02/03 00:00:00+00 | 2021/02/04 07:03:32+00 | 1981 |
| 1981 | -93.242494 | 44.964014 | NaN | MP2021700760 | 3 | 2021/02/01 00:00:00+00 | 1205 | 2021/01/31 00:00:00+00 | 2021/02/01 12:05:00+00 | 1745 | ... | 2021/02/03 00:00:00+00 | NaN | -93.242500 | 44.964020 | -10379707 | 5615858 | Seward | 2021/02/03 00:00:00+00 | 2021/02/04 07:03:32+00 | 1982 |
| 1982 | -93.254074 | 44.976502 | 0002XX 10TH AVE S | MP2021700763 | 1 | 2021/02/01 00:00:00+00 | 1302 | 2021/01/29 00:00:00+00 | 2021/02/01 13:02:00+00 | 1600 | ... | 2021/02/03 00:00:00+00 | 15555.0 | -93.254077 | 44.976508 | -10380996 | 5617823 | Downtown East | 2021/02/03 00:00:00+00 | 2021/02/04 07:03:32+00 | 1983 |
| 1983 | -93.263847 | 45.003065 | 0003XX 15TH AVE NE | MP2021700765 | 2 | 2021/02/01 00:00:00+00 | 1354 | 2021/01/24 00:00:00+00 | 2021/02/01 13:54:00+00 | 1200 | ... | 2021/02/03 00:00:00+00 | 12779.0 | -93.263856 | 45.003069 | -10382084 | 5622004 | Sheridan | 2021/02/03 00:00:00+00 | 2021/02/04 07:03:32+00 | 1984 |
| 1984 | -93.292037 | 44.936791 | 0036XX COLFAX AVE S | MP2021700769 | 5 | 2021/02/01 00:00:00+00 | 1416 | 2021/01/02 00:00:00+00 | 2021/02/01 14:16:00+00 | 5 | ... | 2021/02/03 00:00:00+00 | 20643.0 | -93.292043 | 44.936791 | -10385222 | 5611576 | East Harriet | 2021/02/04 00:00:00+00 | 2021/02/05 07:01:48+00 | 1985 |
| 1985 | -93.229487 | 44.973655 | 0006XX WASHINGTON AVE SE | MP2021700770 | 2 | 2021/02/01 00:00:00+00 | 1451 | 2020/12/18 00:00:00+00 | 2021/02/01 14:51:00+00 | 1435 | ... | 2021/02/03 00:00:00+00 | 20281.0 | -93.229494 | 44.973658 | -10378259 | 5617375 | University of Minnesota | 2021/02/03 00:00:00+00 | 2021/02/04 07:03:32+00 | 1986 |
| 1986 | -93.208278 | 44.949705 | 0029XX DORMAN AVE | MP2021700771 | 3 | 2021/02/01 00:00:00+00 | 1459 | 2021/01/28 00:00:00+00 | 2021/02/01 14:59:00+00 | 1000 | ... | 2021/02/03 00:00:00+00 | 11099.0 | -93.208280 | 44.949706 | -10375898 | 5613607 | Cooper | 2021/02/03 00:00:00+00 | 2021/02/04 07:03:32+00 | 1987 |
| 1987 | -93.236467 | 44.980766 | 0013XX 4TH ST SE | MP2021700772 | 2 | 2021/02/01 00:00:00+00 | 1515 | 2021/01/30 00:00:00+00 | 2021/02/01 15:15:00+00 | 2200 | ... | 2021/02/03 00:00:00+00 | 16642.0 | -93.236473 | 44.980767 | -10379036 | 5618494 | Marcy Holmes | 2021/02/03 00:00:00+00 | 2021/02/04 07:03:32+00 | 1988 |
| 1988 | -93.262635 | 44.914295 | NaN | MP2021700773 | 3 | 2021/02/01 00:00:00+00 | 1609 | 2021/01/26 00:00:00+00 | 2021/02/01 16:09:00+00 | 2000 | ... | 2021/02/03 00:00:00+00 | NaN | -93.262640 | 44.914300 | -10381949 | 5608039 | Northrop | 2021/02/03 00:00:00+00 | 2021/02/04 07:03:32+00 | 1989 |
| 1989 | -93.294327 | 44.958789 | 0024XX HENNEPIN AVE | MP2021700774 | 5 | 2021/02/01 00:00:00+00 | 1653 | 2021/02/01 00:00:00+00 | 2021/02/01 16:53:00+00 | 1200 | ... | 2021/02/03 00:00:00+00 | 18382.0 | -93.294335 | 44.958795 | -10385477 | 5615036 | East Isles | 2021/02/04 00:00:00+00 | 2021/02/05 07:01:48+00 | 1990 |
| 1990 | -93.271788 | 44.977366 | 0006XX NICOLLET MALL | MP2021700775 | 1 | 2021/02/01 00:00:00+00 | 2156 | 2021/02/01 00:00:00+00 | 2021/02/01 21:56:00+00 | 1800 | ... | 2021/02/03 00:00:00+00 | 21933.0 | -93.271796 | 44.977367 | -10382968 | 5617959 | Downtown West | 2021/02/03 00:00:00+00 | 2021/02/04 07:03:32+00 | 1991 |
| 1991 | -93.249843 | 44.960029 | 0023XX 17TH AVE S | MP2021700782 | 3 | 2021/02/02 00:00:00+00 | 1022 | 2021/02/01 00:00:00+00 | 2021/02/02 10:22:00+00 | 1600 | ... | 2021/02/03 00:00:00+00 | 21480.0 | -93.249849 | 44.960034 | -10380525 | 5615231 | Ventura Village | 2021/02/03 00:00:00+00 | 2021/02/04 07:03:32+00 | 1992 |
| 1992 | -93.246959 | 44.983657 | 0006XX UNIVERSITY AVE SE | MP2021700783 | 2 | 2021/02/02 00:00:00+00 | 1051 | 2021/02/01 00:00:00+00 | 2021/02/02 10:51:00+00 | 2100 | ... | 2021/02/03 00:00:00+00 | 17977.0 | -93.246961 | 44.983663 | -10380204 | 5618949 | Marcy Holmes | 2021/02/03 00:00:00+00 | 2021/02/04 07:03:32+00 | 1993 |
49063 rows × 23 columns
print(mp_crime.columns)
Index(['X', 'Y', 'publicaddress', 'caseNumber', 'precinct', 'reportedDate',
'reportedTime', 'beginDate', 'reportedDateTime', 'beginTime', 'offense',
'description', 'UCRCode', 'enteredDate', 'centergbsid', 'centerLong',
'centerLat', 'centerX', 'centerY', 'neighborhood', 'lastchanged',
'LastUpdateDateETL', 'OBJECTID'],
dtype='object')
#Check Out the variables
df=mp_crime[mp_crime['description'].str.contains("THEFT")]
df['Type']='Blank'
df.Type.loc[(df['description'].str.contains("THEFT FROM MOTR VEHC"))] = 'Theft_InsideVehicle'
df.Type.loc[(df['description'].str.contains("THEFT-MOTR VEH PARTS"))] = 'Theft_MotorParts'
df.Type.loc[(df['description'].str.contains("AUTOMOBILE THEFT"))] = 'Theft_Auto'
#mp_crime.offense.unique()
#df[df['IncType'].str.contains("Theft")].IncType.unique()
#mp_crime[mp_crime['description'].str.contains("THEFT")]
df
| X | Y | publicaddress | caseNumber | precinct | reportedDate | reportedTime | beginDate | reportedDateTime | beginTime | ... | lastchanged | LastUpdateDateETL | OBJECTID | Date | Year | DayYear | Month | Day | Count | Type | |
|---|---|---|---|---|---|---|---|---|---|---|---|---|---|---|---|---|---|---|---|---|---|
| 1 | -93.244857 | 44.945648 | 0031XX 19TH AVE S | MP2019253346 | 3 | 2019/08/23 00:00:00+00 | 1150 | 2019/08/22 00:00:00+00 | 2019/08/23 11:50:00+00 | 1606 | ... | 2019/08/24 00:00:00+00 | 2019/08/25 08:15:46+00 | 2 | 2019-08-23 00:00:00+00:00 | 2019 | 235 | 8 | 23 | 1 | Blank |
| 2 | -93.293204 | 45.030536 | 0041XX DUPONT AVE N | MP2019253392 | 4 | 2019/08/23 00:00:00+00 | 1606 | 2019/08/23 00:00:00+00 | 2019/08/23 16:06:00+00 | 1220 | ... | 2019/08/24 00:00:00+00 | 2019/08/25 08:15:46+00 | 3 | 2019-08-23 00:00:00+00:00 | 2019 | 235 | 8 | 23 | 1 | Theft_InsideVehicle |
| 6 | -93.226873 | 44.993251 | 0003XX STINSON BLVD NE | MP2019253649 | 2 | 2019/08/23 00:00:00+00 | 2023 | 2019/08/23 00:00:00+00 | 2019/08/23 20:23:00+00 | 1545 | ... | 2019/08/24 00:00:00+00 | 2019/08/25 08:15:46+00 | 7 | 2019-08-23 00:00:00+00:00 | 2019 | 235 | 8 | 23 | 1 | Theft_Auto |
| 7 | -93.305700 | 44.993606 | 0014XX NEWTON AVE N | MP2019253685 | 4 | 2019/08/23 00:00:00+00 | 1705 | 2019/07/22 00:00:00+00 | 2019/08/23 17:05:00+00 | 0 | ... | 2019/08/24 00:00:00+00 | 2019/08/25 08:15:46+00 | 8 | 2019-08-23 00:00:00+00:00 | 2019 | 235 | 8 | 23 | 1 | Theft_Auto |
| 8 | -93.240042 | 44.980899 | 0011XX UNIVERSITY AVE SE | MP2019253704 | 2 | 2019/08/23 00:00:00+00 | 1837 | 2019/08/22 00:00:00+00 | 2019/08/23 18:37:00+00 | 1800 | ... | 2019/08/24 00:00:00+00 | 2019/08/25 08:15:46+00 | 9 | 2019-08-23 00:00:00+00:00 | 2019 | 235 | 8 | 23 | 1 | Theft_Auto |
| 9 | -93.298352 | 44.942113 | 0033XX HENNEPIN AVE | MP2019253706 | 5 | 2019/08/23 00:00:00+00 | 1653 | 2019/08/23 00:00:00+00 | 2019/08/23 16:53:00+00 | 900 | ... | 2019/08/24 00:00:00+00 | 2019/08/25 08:15:46+00 | 10 | 2019-08-23 00:00:00+00:00 | 2019 | 235 | 8 | 23 | 1 | Theft_Auto |
| 11 | -93.249115 | 45.013157 | NaN | MP2019253723 | 2 | 2019/08/23 00:00:00+00 | 1804 | 2019/08/23 00:00:00+00 | 2019/08/23 18:04:00+00 | 1615 | ... | 2019/08/24 00:00:00+00 | 2019/08/25 08:15:46+00 | 12 | 2019-08-23 00:00:00+00:00 | 2019 | 235 | 8 | 23 | 1 | Theft_MotorParts |
| 12 | -93.245683 | 44.963493 | 0009XX 19TH AVE S | MP2019253751 | 3 | 2019/08/23 00:00:00+00 | 1738 | 2019/08/22 00:00:00+00 | 2019/08/23 17:38:00+00 | 1800 | ... | 2019/08/24 00:00:00+00 | 2019/08/25 08:15:46+00 | 13 | 2019-08-23 00:00:00+00:00 | 2019 | 235 | 8 | 23 | 1 | Theft_Auto |
| 13 | -93.269677 | 44.977741 | 0005XX MARQUETTE AVE | MP2019253771 | 1 | 2019/08/23 00:00:00+00 | 1941 | 2019/08/21 00:00:00+00 | 2019/08/23 19:41:00+00 | 0 | ... | 2019/08/24 00:00:00+00 | 2019/08/25 08:15:46+00 | 14 | 2019-08-23 00:00:00+00:00 | 2019 | 235 | 8 | 23 | 1 | Theft_InsideVehicle |
| 17 | -93.296564 | 44.924911 | NaN | MP2019253976 | 5 | 2019/08/23 00:00:00+00 | 2143 | 2019/08/23 00:00:00+00 | 2019/08/23 21:43:00+00 | 2000 | ... | 2019/08/24 00:00:00+00 | 2019/08/25 08:15:46+00 | 18 | 2019-08-23 00:00:00+00:00 | 2019 | 235 | 8 | 23 | 1 | Theft_InsideVehicle |
| 18 | -93.260263 | 44.975746 | NaN | MP2019254062 | 1 | 2019/08/23 00:00:00+00 | 2320 | 2019/08/23 00:00:00+00 | 2019/08/23 23:20:00+00 | 2215 | ... | 2019/08/24 00:00:00+00 | 2019/08/25 08:15:46+00 | 19 | 2019-08-23 00:00:00+00:00 | 2019 | 235 | 8 | 23 | 1 | Blank |
| 19 | -93.262850 | 44.978148 | 0004XX 3RD ST S | MP2019254118 | 1 | 2019/08/23 00:00:00+00 | 2343 | 2019/08/23 00:00:00+00 | 2019/08/23 23:43:00+00 | 1430 | ... | 2019/08/24 00:00:00+00 | 2019/08/25 08:15:46+00 | 20 | 2019-08-23 00:00:00+00:00 | 2019 | 235 | 8 | 23 | 1 | Theft_InsideVehicle |
| 23 | -93.277708 | 44.970503 | 0013XX NICOLLET MALL | MP2019254299 | 1 | 2019/08/24 00:00:00+00 | 508 | 2019/08/24 00:00:00+00 | 2019/08/24 05:08:00+00 | 200 | ... | 2019/08/24 00:00:00+00 | 2019/08/25 08:15:46+00 | 24 | 2019-08-24 00:00:00+00:00 | 2019 | 236 | 8 | 24 | 1 | Blank |
| 28 | -93.232442 | 44.982386 | 0006XX 15TH AVE SE | MP2019254513 | 2 | 2019/08/24 00:00:00+00 | 1323 | 2019/08/12 00:00:00+00 | 2019/08/24 13:23:00+00 | 1200 | ... | 2019/08/24 00:00:00+00 | 2019/08/25 08:15:46+00 | 29 | 2019-08-24 00:00:00+00:00 | 2019 | 236 | 8 | 24 | 1 | Theft_Auto |
| 29 | -93.278804 | 44.948344 | 00001X LAKE ST W | MP2019254515 | 5 | 2019/08/24 00:00:00+00 | 923 | 2019/08/24 00:00:00+00 | 2019/08/24 09:23:00+00 | 900 | ... | 2019/08/24 00:00:00+00 | 2019/08/25 08:15:46+00 | 30 | 2019-08-24 00:00:00+00:00 | 2019 | 236 | 8 | 24 | 1 | Blank |
| 30 | -93.245549 | 44.988905 | 0007XX 5TH AVE SE | MP2019254523 | 2 | 2019/08/24 00:00:00+00 | 1309 | 2019/08/24 00:00:00+00 | 2019/08/24 13:09:00+00 | 200 | ... | 2019/08/24 00:00:00+00 | 2019/08/25 08:15:46+00 | 31 | 2019-08-24 00:00:00+00:00 | 2019 | 236 | 8 | 24 | 1 | Theft_Auto |
| 31 | -93.263749 | 44.933249 | 0038XX COLUMBUS AVE | MP2019254532 | 3 | 2019/08/24 00:00:00+00 | 1040 | 2019/08/23 00:00:00+00 | 2019/08/24 10:40:00+00 | 2200 | ... | 2019/08/24 00:00:00+00 | 2019/08/25 08:15:46+00 | 32 | 2019-08-24 00:00:00+00:00 | 2019 | 236 | 8 | 24 | 1 | Theft_Auto |
| 32 | -93.253678 | 44.958230 | 0024XX 15TH AVE S | MP2019254541 | 3 | 2019/08/24 00:00:00+00 | 1039 | 2019/08/23 00:00:00+00 | 2019/08/24 10:39:00+00 | 1800 | ... | 2019/08/24 00:00:00+00 | 2019/08/25 08:15:46+00 | 33 | 2019-08-24 00:00:00+00:00 | 2019 | 236 | 8 | 24 | 1 | Theft_Auto |
| 35 | -93.292584 | 44.991504 | 0011XX 7TH ST N | MP2019254579 | 4 | 2019/08/24 00:00:00+00 | 1205 | 2019/08/24 00:00:00+00 | 2019/08/24 12:05:00+00 | 400 | ... | 2019/08/24 00:00:00+00 | 2019/08/25 08:15:46+00 | 36 | 2019-08-24 00:00:00+00:00 | 2019 | 236 | 8 | 24 | 1 | Theft_Auto |
| 39 | -93.211260 | 44.965482 | 00004X MELBOURNE AVE SE | MP2019254688 | 2 | 2019/08/24 00:00:00+00 | 1347 | 2019/08/23 00:00:00+00 | 2019/08/24 13:47:00+00 | 1200 | ... | 2019/08/24 00:00:00+00 | 2019/08/25 08:15:46+00 | 40 | 2019-08-24 00:00:00+00:00 | 2019 | 236 | 8 | 24 | 1 | Theft_Auto |
| 41 | -93.281320 | 44.952839 | 0027XX PILLSBURY AVE | MP2019254718 | 5 | 2019/08/24 00:00:00+00 | 1410 | 2019/08/23 00:00:00+00 | 2019/08/24 14:10:00+00 | 1900 | ... | 2019/08/24 00:00:00+00 | 2019/08/25 08:15:46+00 | 42 | 2019-08-24 00:00:00+00:00 | 2019 | 236 | 8 | 24 | 1 | Theft_Auto |
| 42 | -93.314656 | 44.987018 | 0008XX UPTON AVE N | MP2019254721 | 4 | 2019/08/24 00:00:00+00 | 1425 | 2019/08/18 00:00:00+00 | 2019/08/24 14:25:00+00 | 800 | ... | 2019/08/24 00:00:00+00 | 2019/08/25 08:15:46+00 | 43 | 2019-08-24 00:00:00+00:00 | 2019 | 236 | 8 | 24 | 1 | Blank |
| 43 | -93.250004 | 45.016770 | 0008XX 27TH AVE NE | MP2019254725 | 2 | 2019/08/24 00:00:00+00 | 1428 | 2019/08/23 00:00:00+00 | 2019/08/24 14:28:00+00 | 2000 | ... | 2019/08/24 00:00:00+00 | 2019/08/25 08:15:46+00 | 44 | 2019-08-24 00:00:00+00:00 | 2019 | 236 | 8 | 24 | 1 | Theft_InsideVehicle |
| 48 | -93.217908 | 44.972047 | 0027XX UNIVERSITY AVE SE | MP2019254761 | 2 | 2019/08/24 00:00:00+00 | 1643 | 2019/08/24 00:00:00+00 | 2019/08/24 16:43:00+00 | 1500 | ... | 2019/08/24 00:00:00+00 | 2019/08/25 08:15:46+00 | 49 | 2019-08-24 00:00:00+00:00 | 2019 | 236 | 8 | 24 | 1 | Blank |
| 49 | -93.224789 | 44.973604 | 0009XX WASHINGTON AVE SE | MP2019254777 | 2 | 2019/08/24 00:00:00+00 | 1712 | 2019/08/24 00:00:00+00 | 2019/08/24 17:12:00+00 | 1535 | ... | 2019/09/07 00:00:00+00 | 2019/09/08 08:15:27+00 | 50 | 2019-08-24 00:00:00+00:00 | 2019 | 236 | 8 | 24 | 1 | Blank |
| 52 | -93.277906 | 44.933204 | 0038XX NICOLLET AVE | MP2019254831 | 5 | 2019/08/24 00:00:00+00 | 1800 | 2019/08/23 00:00:00+00 | 2019/08/24 18:00:00+00 | 1400 | ... | 2019/08/24 00:00:00+00 | 2019/08/25 08:15:46+00 | 53 | 2019-08-24 00:00:00+00:00 | 2019 | 236 | 8 | 24 | 1 | Theft_Auto |
| 53 | -93.258089 | 44.976127 | NaN | MP2019254853 | 1 | 2019/08/24 00:00:00+00 | 1900 | 2019/08/24 00:00:00+00 | 2019/08/24 19:00:00+00 | 900 | ... | 2019/08/24 00:00:00+00 | 2019/08/25 08:15:46+00 | 54 | 2019-08-24 00:00:00+00:00 | 2019 | 236 | 8 | 24 | 1 | Theft_InsideVehicle |
| 54 | -93.256185 | 44.931430 | 0039XX 13TH AVE S | MP2019254882 | 3 | 2019/08/24 00:00:00+00 | 1754 | 2019/08/23 00:00:00+00 | 2019/08/24 17:54:00+00 | 2100 | ... | 2019/08/24 00:00:00+00 | 2019/08/25 08:15:46+00 | 55 | 2019-08-24 00:00:00+00:00 | 2019 | 236 | 8 | 24 | 1 | Theft_InsideVehicle |
| 57 | -93.273855 | 44.974977 | NaN | MP2019254935 | 1 | 2019/08/24 00:00:00+00 | 1824 | 2019/08/24 00:00:00+00 | 2019/08/24 18:24:00+00 | 1800 | ... | 2019/08/24 00:00:00+00 | 2019/08/25 08:15:46+00 | 58 | 2019-08-24 00:00:00+00:00 | 2019 | 236 | 8 | 24 | 1 | Blank |
| 59 | -93.255430 | 44.977087 | 0002XX 9TH AVE S | MP2019705204 | 1 | 2019/08/23 00:00:00+00 | 1102 | 2019/08/23 00:00:00+00 | 2019/08/23 11:02:00+00 | 245 | ... | 2019/08/24 00:00:00+00 | 2019/08/25 08:15:46+00 | 60 | 2019-08-23 00:00:00+00:00 | 2019 | 235 | 8 | 23 | 1 | Theft_InsideVehicle |
| ... | ... | ... | ... | ... | ... | ... | ... | ... | ... | ... | ... | ... | ... | ... | ... | ... | ... | ... | ... | ... | ... |
| 1959 | -93.237158 | 45.010490 | 0022XX JOHNSON ST NE | MP202123192 | 2 | 2021/02/02 00:00:00+00 | 1258 | 2021/01/29 00:00:00+00 | 2021/02/02 12:58:00+00 | 2030 | ... | 2021/02/03 00:00:00+00 | 2021/02/04 07:03:32+00 | 1960 | 2021-02-02 00:00:00+00:00 | 2021 | 33 | 2 | 2 | 1 | Theft_MotorParts |
| 1960 | -93.256113 | 45.012166 | 0006XX 24TH AVE NE | MP202123198 | 2 | 2021/02/02 00:00:00+00 | 1317 | 2021/01/29 00:00:00+00 | 2021/02/02 13:17:00+00 | 1800 | ... | 2021/02/03 00:00:00+00 | 2021/02/04 07:03:32+00 | 1961 | 2021-02-02 00:00:00+00:00 | 2021 | 33 | 2 | 2 | 1 | Blank |
| 1961 | -93.201540 | 44.906807 | 0053XX RIVERVIEW RD | MP202123238 | 3 | 2021/02/02 00:00:00+00 | 1438 | 2021/02/01 00:00:00+00 | 2021/02/02 14:38:00+00 | 2200 | ... | 2021/02/03 00:00:00+00 | 2021/02/04 07:03:32+00 | 1962 | 2021-02-02 00:00:00+00:00 | 2021 | 33 | 2 | 2 | 1 | Theft_Auto |
| 1962 | -93.295091 | 44.957778 | 0024XX HENNEPIN AVE | MP202123245 | 5 | 2021/02/02 00:00:00+00 | 1431 | 2020/02/02 00:00:00+00 | 2021/02/02 14:31:00+00 | 0 | ... | 2021/02/04 00:00:00+00 | 2021/02/05 07:01:48+00 | 1963 | 2021-02-02 00:00:00+00:00 | 2021 | 33 | 2 | 2 | 1 | Theft_MotorParts |
| 1963 | -93.268977 | 44.958255 | 0024XX 5TH AVE S | MP202123262 | 3 | 2021/02/02 00:00:00+00 | 1514 | 2021/02/02 00:00:00+00 | 2021/02/02 15:14:00+00 | 1514 | ... | 2021/02/03 00:00:00+00 | 2021/02/04 07:03:32+00 | 1964 | 2021-02-02 00:00:00+00:00 | 2021 | 33 | 2 | 2 | 1 | Theft_MotorParts |
| 1966 | -93.288039 | 44.954638 | 0026XX LYNDALE AVE S | MP202123341 | 5 | 2021/02/02 00:00:00+00 | 1725 | 2021/02/02 00:00:00+00 | 2021/02/02 17:25:00+00 | 1300 | ... | 2021/02/03 00:00:00+00 | 2021/02/04 07:03:32+00 | 1967 | 2021-02-02 00:00:00+00:00 | 2021 | 33 | 2 | 2 | 1 | Blank |
| 1967 | -93.310272 | 44.933586 | NaN | MP202123351 | 5 | 2021/02/02 00:00:00+00 | 1750 | 2021/02/02 00:00:00+00 | 2021/02/02 17:50:00+00 | 1700 | ... | 2021/02/03 00:00:00+00 | 2021/02/04 07:03:32+00 | 1968 | 2021-02-02 00:00:00+00:00 | 2021 | 33 | 2 | 2 | 1 | Theft_InsideVehicle |
| 1968 | -93.229047 | 44.960969 | 0029XX 22ND ST E | MP202123371 | 3 | 2021/02/02 00:00:00+00 | 1827 | 2021/01/31 00:00:00+00 | 2021/02/02 18:27:00+00 | 0 | ... | 2021/02/03 00:00:00+00 | 2021/02/04 07:03:32+00 | 1969 | 2021-02-02 00:00:00+00:00 | 2021 | 33 | 2 | 2 | 1 | Theft_MotorParts |
| 1969 | -93.238533 | 44.962749 | 0023XX FRANKLIN AVE E | MP202123398 | 3 | 2021/02/02 00:00:00+00 | 1800 | 2021/02/01 00:00:00+00 | 2021/02/02 18:00:00+00 | 2200 | ... | 2021/02/03 00:00:00+00 | 2021/02/04 07:03:32+00 | 1970 | 2021-02-02 00:00:00+00:00 | 2021 | 33 | 2 | 2 | 1 | Theft_MotorParts |
| 1970 | -93.281014 | 44.974494 | 0012XX HENNEPIN AVE | MP202123405 | 1 | 2021/02/02 00:00:00+00 | 1835 | 2021/01/29 00:00:00+00 | 2021/02/02 18:35:00+00 | 1100 | ... | 2021/02/05 00:00:00+00 | 2021/02/06 07:03:57+00 | 1971 | 2021-02-02 00:00:00+00:00 | 2021 | 33 | 2 | 2 | 1 | Blank |
| 1972 | -93.263111 | 45.010540 | 0022XX UNIVERSITY AVE NE | MP202123447 | 2 | 2021/02/02 00:00:00+00 | 1912 | 2020/01/28 00:00:00+00 | 2021/02/02 19:12:00+00 | 350 | ... | 2021/02/03 00:00:00+00 | 2021/02/04 07:03:32+00 | 1973 | 2021-02-02 00:00:00+00:00 | 2021 | 33 | 2 | 2 | 1 | Blank |
| 1973 | -93.262635 | 44.945668 | 0031XX CHICAGO AVE | MP202123481 | 3 | 2021/02/02 00:00:00+00 | 2013 | 2021/02/02 00:00:00+00 | 2021/02/02 20:13:00+00 | 1945 | ... | 2021/02/03 00:00:00+00 | 2021/02/04 07:03:32+00 | 1974 | 2021-02-02 00:00:00+00:00 | 2021 | 33 | 2 | 2 | 1 | Theft_InsideVehicle |
| 1975 | -93.272741 | 44.960899 | NaN | MP2021700742 | 5 | 2021/01/29 00:00:00+00 | 1245 | 2021/01/28 00:00:00+00 | 2021/01/29 12:45:00+00 | 2330 | ... | 2021/02/04 00:00:00+00 | 2021/02/05 07:01:48+00 | 1976 | 2021-01-29 00:00:00+00:00 | 2021 | 29 | 1 | 29 | 1 | Theft_MotorParts |
| 1976 | -93.225687 | 44.920554 | 0045XX 32ND AVE S | MP2021700744 | 3 | 2021/02/01 00:00:00+00 | 833 | 2021/01/31 00:00:00+00 | 2021/02/01 08:33:00+00 | 30 | ... | 2021/02/03 00:00:00+00 | 2021/02/04 07:03:32+00 | 1977 | 2021-02-01 00:00:00+00:00 | 2021 | 32 | 2 | 1 | 1 | Theft_MotorParts |
| 1977 | -93.308386 | 45.026803 | 0039XX PENN AVE N | MP2021700745 | 4 | 2021/02/01 00:00:00+00 | 853 | 2021/01/29 00:00:00+00 | 2021/02/01 08:53:00+00 | 900 | ... | 2021/02/03 00:00:00+00 | 2021/02/04 07:03:32+00 | 1978 | 2021-02-01 00:00:00+00:00 | 2021 | 32 | 2 | 1 | 1 | Theft_InsideVehicle |
| 1978 | -93.264728 | 44.984833 | 00008X HENNEPIN AVE | MP2021700750 | 1 | 2021/02/01 00:00:00+00 | 1023 | 2021/01/30 00:00:00+00 | 2021/02/01 10:23:00+00 | 2200 | ... | 2021/02/03 00:00:00+00 | 2021/02/04 07:03:32+00 | 1979 | 2021-02-01 00:00:00+00:00 | 2021 | 32 | 2 | 1 | 1 | Blank |
| 1979 | -93.297031 | 44.945655 | 0031XX GIRARD AVE S | MP2021700755 | 5 | 2021/02/01 00:00:00+00 | 1141 | 2020/07/10 00:00:00+00 | 2021/02/01 11:41:00+00 | 2100 | ... | 2021/02/04 00:00:00+00 | 2021/02/05 07:01:48+00 | 1980 | 2021-02-01 00:00:00+00:00 | 2021 | 32 | 2 | 1 | 1 | Blank |
| 1980 | -93.289360 | 44.949202 | 0029XX ALDRICH AVE S | MP2021700757 | 5 | 2021/02/01 00:00:00+00 | 1145 | 2021/01/29 00:00:00+00 | 2021/02/01 11:45:00+00 | 2000 | ... | 2021/02/03 00:00:00+00 | 2021/02/04 07:03:32+00 | 1981 | 2021-02-01 00:00:00+00:00 | 2021 | 32 | 2 | 1 | 1 | Theft_InsideVehicle |
| 1981 | -93.242494 | 44.964014 | NaN | MP2021700760 | 3 | 2021/02/01 00:00:00+00 | 1205 | 2021/01/31 00:00:00+00 | 2021/02/01 12:05:00+00 | 1745 | ... | 2021/02/03 00:00:00+00 | 2021/02/04 07:03:32+00 | 1982 | 2021-02-01 00:00:00+00:00 | 2021 | 32 | 2 | 1 | 1 | Theft_MotorParts |
| 1982 | -93.254074 | 44.976502 | 0002XX 10TH AVE S | MP2021700763 | 1 | 2021/02/01 00:00:00+00 | 1302 | 2021/01/29 00:00:00+00 | 2021/02/01 13:02:00+00 | 1600 | ... | 2021/02/03 00:00:00+00 | 2021/02/04 07:03:32+00 | 1983 | 2021-02-01 00:00:00+00:00 | 2021 | 32 | 2 | 1 | 1 | Theft_InsideVehicle |
| 1983 | -93.263847 | 45.003065 | 0003XX 15TH AVE NE | MP2021700765 | 2 | 2021/02/01 00:00:00+00 | 1354 | 2021/01/24 00:00:00+00 | 2021/02/01 13:54:00+00 | 1200 | ... | 2021/02/03 00:00:00+00 | 2021/02/04 07:03:32+00 | 1984 | 2021-02-01 00:00:00+00:00 | 2021 | 32 | 2 | 1 | 1 | Theft_MotorParts |
| 1984 | -93.292037 | 44.936791 | 0036XX COLFAX AVE S | MP2021700769 | 5 | 2021/02/01 00:00:00+00 | 1416 | 2021/01/02 00:00:00+00 | 2021/02/01 14:16:00+00 | 5 | ... | 2021/02/04 00:00:00+00 | 2021/02/05 07:01:48+00 | 1985 | 2021-02-01 00:00:00+00:00 | 2021 | 32 | 2 | 1 | 1 | Theft_MotorParts |
| 1985 | -93.229487 | 44.973655 | 0006XX WASHINGTON AVE SE | MP2021700770 | 2 | 2021/02/01 00:00:00+00 | 1451 | 2020/12/18 00:00:00+00 | 2021/02/01 14:51:00+00 | 1435 | ... | 2021/02/03 00:00:00+00 | 2021/02/04 07:03:32+00 | 1986 | 2021-02-01 00:00:00+00:00 | 2021 | 32 | 2 | 1 | 1 | Blank |
| 1986 | -93.208278 | 44.949705 | 0029XX DORMAN AVE | MP2021700771 | 3 | 2021/02/01 00:00:00+00 | 1459 | 2021/01/28 00:00:00+00 | 2021/02/01 14:59:00+00 | 1000 | ... | 2021/02/03 00:00:00+00 | 2021/02/04 07:03:32+00 | 1987 | 2021-02-01 00:00:00+00:00 | 2021 | 32 | 2 | 1 | 1 | Theft_MotorParts |
| 1987 | -93.236467 | 44.980766 | 0013XX 4TH ST SE | MP2021700772 | 2 | 2021/02/01 00:00:00+00 | 1515 | 2021/01/30 00:00:00+00 | 2021/02/01 15:15:00+00 | 2200 | ... | 2021/02/03 00:00:00+00 | 2021/02/04 07:03:32+00 | 1988 | 2021-02-01 00:00:00+00:00 | 2021 | 32 | 2 | 1 | 1 | Blank |
| 1988 | -93.262635 | 44.914295 | NaN | MP2021700773 | 3 | 2021/02/01 00:00:00+00 | 1609 | 2021/01/26 00:00:00+00 | 2021/02/01 16:09:00+00 | 2000 | ... | 2021/02/03 00:00:00+00 | 2021/02/04 07:03:32+00 | 1989 | 2021-02-01 00:00:00+00:00 | 2021 | 32 | 2 | 1 | 1 | Theft_MotorParts |
| 1989 | -93.294327 | 44.958789 | 0024XX HENNEPIN AVE | MP2021700774 | 5 | 2021/02/01 00:00:00+00 | 1653 | 2021/02/01 00:00:00+00 | 2021/02/01 16:53:00+00 | 1200 | ... | 2021/02/04 00:00:00+00 | 2021/02/05 07:01:48+00 | 1990 | 2021-02-01 00:00:00+00:00 | 2021 | 32 | 2 | 1 | 1 | Theft_InsideVehicle |
| 1990 | -93.271788 | 44.977366 | 0006XX NICOLLET MALL | MP2021700775 | 1 | 2021/02/01 00:00:00+00 | 2156 | 2021/02/01 00:00:00+00 | 2021/02/01 21:56:00+00 | 1800 | ... | 2021/02/03 00:00:00+00 | 2021/02/04 07:03:32+00 | 1991 | 2021-02-01 00:00:00+00:00 | 2021 | 32 | 2 | 1 | 1 | Blank |
| 1991 | -93.249843 | 44.960029 | 0023XX 17TH AVE S | MP2021700782 | 3 | 2021/02/02 00:00:00+00 | 1022 | 2021/02/01 00:00:00+00 | 2021/02/02 10:22:00+00 | 1600 | ... | 2021/02/03 00:00:00+00 | 2021/02/04 07:03:32+00 | 1992 | 2021-02-02 00:00:00+00:00 | 2021 | 33 | 2 | 2 | 1 | Blank |
| 1992 | -93.246959 | 44.983657 | 0006XX UNIVERSITY AVE SE | MP2021700783 | 2 | 2021/02/02 00:00:00+00 | 1051 | 2021/02/01 00:00:00+00 | 2021/02/02 10:51:00+00 | 2100 | ... | 2021/02/03 00:00:00+00 | 2021/02/04 07:03:32+00 | 1993 | 2021-02-02 00:00:00+00:00 | 2021 | 33 | 2 | 2 | 1 | Theft_InsideVehicle |
31230 rows × 30 columns
#a.description.unique()
mp_crime['Date']= pd.to_datetime(mp_crime['reportedDate'])
mp_crime['Year']= mp_crime['Date'].dt.year
mp_crime['DayYear'] = mp_crime['Date'].dt.dayofyear
mp_crime['Month'] = mp_crime['Date'].dt.month # Create Month Category
mp_crime['Day'] = mp_crime['Date'].dt.day #Create Day of the Current month
mp_crime['Count']=1
df=mp_crime[mp_crime['description'].str.contains("THEFT-MOTR VEH PARTS")]
df_auto =df
# Set a friendly Date variable
df_auto['FDate']=df_auto['Month'].astype(str) + '/' + df_auto['Day'].astype(str) + '/'
def plot_toDate_Year_MPAutoTheft(Day=29):
B= df_auto.query('Year>2018')
Date= df_auto[(df_auto['DayYear'] == Day)]['FDate'][0:1].iloc[0,]
B= B[(B['DayYear'] <= Day)]
Index= ['Year','Count']
C= B[Index].groupby(['Year']).sum().reset_index()
print('This graph displays AutoMobile Theft of Minneapolis up to {}20XX'.format(Date))
sns.set()
pd.pivot_table(C, values='Count', columns=['Year'],
fill_value=0).plot(kind= 'barh',
figsize=(12,10),title= 'Motor Vehicles Parts Theft Incidents')
return plt.show()
plot_toDate_Year_MPAutoTheft()
#df_auto.query('Year==2021 & precint==1')
This graph displays AutoMobile Theft of Minneapolis up to 1/29/20XX

def plot_toDate_Year_MPAutoTheft(Day=31):
B= df_auto.query('Year>2018')
Date= df_auto[(df_auto['DayYear'] == Day)]['FDate'][0:1].iloc[0,]
B= B[(B['DayYear'] <= Day)]
Index= ['Year','Count']
C= B[Index].groupby(['Year']).sum().reset_index()
print('This graph displays AutoMobile Theft of Minneapolis up to {}20XX'.format(Date))
sns.set()
pd.pivot_table(C, values='Count', columns=['Year'],
fill_value=0).plot(kind= 'barh',
figsize=(12,10),title= 'Motor Vehicles Parts Theft Incidents')
return plt.show()
plot_toDate_Year_MPAutoTheft(181)
This graph displays AutoMobile Theft of Minneapolis up to 6/29/20XX

Index1= ['Holland', 'Powderhorn Park', 'Central', 'Ventura Village',
'Seward', 'Minnehaha', 'Cooper', 'Standish', 'Elliot Park',
'Whittier', 'Phillips West', 'Corcoran', 'Hawthorne']
df_auto1=df_auto[df_auto['neighborhood'].isin(Index1)]
Index2=['Lowry Hill East', 'Jordan', 'Near - North',
'Mid - City Industrial', 'Prospect Park - East River Road',
'Longfellow', 'Waite Park', 'Northrop', 'Marshall Terrace']
df_auto2=df_auto[df_auto['neighborhood'].isin(Index2)]
Index3=['Lowry Hill', 'Marcy Holmes', 'Bryant', 'Armatage', 'Logan Park',
'Como', 'Hiawatha', 'East Phillips', 'ECCO', 'Midtown Phillips',
'Downtown West', 'Harrison', 'Field', 'Cleveland', 'North Loop']
df_auto3=df_auto[df_auto['neighborhood'].isin(Index3)]
Index4=['Ericsson', 'Keewaydin', 'Windom', 'East Isles', 'Willard - Hay',
'Loring Park', 'Bryn - Mawr', 'CARAG',
"Steven's Square - Loring Heights", 'Lyndale', 'Diamond Lake']
df_auto4=df_auto[df_auto['neighborhood'].isin(Index4)]
Index5=['Bottineau', 'Nicollet Island - East Bank', 'Howe', 'McKinley',
'Morris Park', 'Page', 'Webber - Camden', 'Cedar Riverside',
'King Field', 'Folwell', 'Bancroft', 'Regina', 'Audubon Park']
df_auto5=df_auto[df_auto['neighborhood'].isin(Index5)]
Index6=['Wenonah', 'Windom Park', 'Tangletown', 'Victory', 'Lynnhurst',
'East Harriet', 'Hale', 'Fulton', 'West Calhoun', 'Lind - Bohanon',
'St. Anthony East', 'Cedar - Isles - Dean', 'Camden Industrial']
df_auto6=df_auto[df_auto['neighborhood'].isin(Index6)]
Index7=['Shingle Creek', 'Northeast Park', 'St. Anthony West', 'Kenny',
'Columbia Park', 'Kenwood', 'Beltrami', 'Sheridan',
'Downtown East', 'Linden Hills', 'Sumner - Glenwood',
'University of Minnesota']
df_auto7=df_auto[df_auto['neighborhood'].isin(Index7)]
c=df_auto.query('Year<2020')
c.query('neighborhood=="Shingle Creek"')
| precinct | neighborhood | offense | description | reportedDate | Date | Year | DayYear | Month | Day | Count | FDate |
|---|
def plot_SPAutoTheftYear(Day=365):
B= df_auto7.query('Year<2021')
#Date= df_auto[(df_auto['DayYear'] == Day)]['FDate'][0:1].iloc[0,]
B= B[(B['DayYear'] <= Day)]
Index= ['Year','neighborhood','Count']
C= B[Index].groupby(['Year','neighborhood']).sum().reset_index()
print('This graph displays "Motor Vehicles Parts Theft" incidents of Minneapolis neighborhoods.')
sns.set()
pd.pivot_table(C, values='Count', index=['neighborhood'], columns=['Year'],
fill_value=0).plot(kind= 'barh',
figsize=(12,10),title= 'Motor Vehicles Parts Theft Yearly Total Incidents')
return plt.show()
plot_SPAutoTheftYear()
This graph displays "Motor Vehicles Parts Theft" incidents of Minneapolis neighborhoods.

import matplotlib.pyplot as plt
import seaborn as sns
def plot_SPAutoTheftYear(Day=365):
B= df_auto.query('Year<2021')
Date= df_auto[(df_auto['DayYear'] == Day)]['FDate'][0:1].iloc[0,]
#B= B[(B['DayYear'] <= Day)]
Index= ['Year','neighborhood','Count']
C= B[Index].groupby(['Year','neighborhood']).sum().reset_index()
print('This graph displays "Auto Accessory Thefts" incidents of Saint Paul neighborhoods.')
sns.set()
pd.pivot_table(C, values='Count', index=['neighborhood'], columns=['Year'],
fill_value=0).plot(kind= 'barh',
figsize=(12,10),title= 'Auto Accessory Thefts Yearly Total Incidents')
return plt.show()
plot_SPAutoTheftYear()
--------------------------------------------------------------------------- IndexError Traceback (most recent call last) <ipython-input-28-e5e75287a6cf> in <module> 15 return plt.show() 16 ---> 17 plot_SPAutoTheftYear() <ipython-input-28-e5e75287a6cf> in plot_SPAutoTheftYear(Day) 4 def plot_SPAutoTheftYear(Day=365): 5 B= df_auto.query('Year<2021') ----> 6 Date= df_auto[(df_auto['DayYear'] == Day)]['FDate'][0:1].iloc[0,] 7 #B= B[(B['DayYear'] <= Day)] 8 Index= ['Year','neighborhood','Count'] ~\Anaconda3\lib\site-packages\pandas\core\indexing.py in __getitem__(self, key) 1492 except (KeyError, IndexError, AttributeError): 1493 pass -> 1494 return self._getitem_tuple(key) 1495 else: 1496 # we by definition only have the 0th axis ~\Anaconda3\lib\site-packages\pandas\core\indexing.py in _getitem_tuple(self, tup) 2141 def _getitem_tuple(self, tup): 2142 -> 2143 self._has_valid_tuple(tup) 2144 try: 2145 return self._getitem_lowerdim(tup) ~\Anaconda3\lib\site-packages\pandas\core\indexing.py in _has_valid_tuple(self, key) 221 raise IndexingError('Too many indexers') 222 try: --> 223 self._validate_key(k, i) 224 except ValueError: 225 raise ValueError("Location based indexing can only have " ~\Anaconda3\lib\site-packages\pandas\core\indexing.py in _validate_key(self, key, axis) 2068 return 2069 elif is_integer(key): -> 2070 self._validate_integer(key, axis) 2071 elif isinstance(key, tuple): 2072 # a tuple should already have been caught by this point ~\Anaconda3\lib\site-packages\pandas\core\indexing.py in _validate_integer(self, key, axis) 2137 len_axis = len(self.obj._get_axis(axis)) 2138 if key >= len_axis or key < -len_axis: -> 2139 raise IndexError("single positional indexer is out-of-bounds") 2140 2141 def _getitem_tuple(self, tup): IndexError: single positional indexer is out-of-bounds
df_auto.query('Day>31')
| precinct | neighborhood | offense | description | reportedDate | Date | Year | DayYear | Month | Day | Count | FDate |
|---|
def plot_toDate_Year_MPAutoTheft(Day=31):
B= df_auto.query('Year>2018')
Date= df_auto[(df_auto['DayYear'] == Day)]['FDate'][0:1].iloc[0,]
B= B[(B['DayYear'] <= Day)]
Index= ['Year','Count']
C= B[Index].groupby(['Year']).sum().reset_index()
print('This graph displays Motor Vehicles Parts Theft of Minneapolis up to {}20XX'.format(Date))
sns.set()
pd.pivot_table(C, values='Count', columns=['Year'],
fill_value=0).plot(kind= 'barh',
figsize=(12,10),title= 'Motor Vehicles Parts Theft Incidents')
return plt.show()
plot_toDate_Year_MPAutoTheft(365)
--------------------------------------------------------------------------- IndexError Traceback (most recent call last) <ipython-input-29-a5e132e3139f> in <module> 12 return plt.show() 13 ---> 14 plot_toDate_Year_MPAutoTheft(365) <ipython-input-29-a5e132e3139f> in plot_toDate_Year_MPAutoTheft(Day) 1 def plot_toDate_Year_MPAutoTheft(Day=31): 2 B= df_auto.query('Year>2018') ----> 3 Date= df_auto[(df_auto['DayYear'] == Day)]['FDate'][0:1].iloc[0,] 4 B= B[(B['DayYear'] <= Day)] 5 Index= ['Year','Count'] ~\Anaconda3\lib\site-packages\pandas\core\indexing.py in __getitem__(self, key) 1492 except (KeyError, IndexError, AttributeError): 1493 pass -> 1494 return self._getitem_tuple(key) 1495 else: 1496 # we by definition only have the 0th axis ~\Anaconda3\lib\site-packages\pandas\core\indexing.py in _getitem_tuple(self, tup) 2141 def _getitem_tuple(self, tup): 2142 -> 2143 self._has_valid_tuple(tup) 2144 try: 2145 return self._getitem_lowerdim(tup) ~\Anaconda3\lib\site-packages\pandas\core\indexing.py in _has_valid_tuple(self, key) 221 raise IndexingError('Too many indexers') 222 try: --> 223 self._validate_key(k, i) 224 except ValueError: 225 raise ValueError("Location based indexing can only have " ~\Anaconda3\lib\site-packages\pandas\core\indexing.py in _validate_key(self, key, axis) 2068 return 2069 elif is_integer(key): -> 2070 self._validate_integer(key, axis) 2071 elif isinstance(key, tuple): 2072 # a tuple should already have been caught by this point ~\Anaconda3\lib\site-packages\pandas\core\indexing.py in _validate_integer(self, key, axis) 2137 len_axis = len(self.obj._get_axis(axis)) 2138 if key >= len_axis or key < -len_axis: -> 2139 raise IndexError("single positional indexer is out-of-bounds") 2140 2141 def _getitem_tuple(self, tup): IndexError: single positional indexer is out-of-bounds
df_auto=df[df['IncType'].str.contains("Auto Accessories")]
df_auto['Amount']='Between $500-1000'
df_auto.Amount.loc[(df_auto['IncType'].str.contains("500"))] = 'Under $500'
df_auto.Amount.loc[(df_auto['IncType'].str.contains("Over"))] = 'Over $1000'
#df_auto.query('Year>2019')
import matplotlib.pyplot as plt
import seaborn as sns
def plot_SPAutoTheft(Day=Max):
B= df_auto.query('Year>2019')
#Date= fgc[(fgc['DayYear'] == Day)]['FDate'][0:1].iloc[0,]
#B= B[(B['DayYear'] <= Day)]
Index= ['Amount','Community','Count']
C= B[Index].groupby(['Amount','Community']).sum().reset_index()
print('This graph displays Auto Accessory Theft incidents by cost for Saint Paul neighborhoods since 2020')
sns.set()
pd.pivot_table(C, values='Count', index=['Community'], columns=['Amount'],
fill_value=0).plot(kind= 'barh',
figsize=(12,10),title= 'Auto Accessory Theft Incidents')
return plt.show()
plot_SPAutoTheft()
#fg.Incident.loc[(fg['Incident'] == 'Simple Asasult Dom.')] = 'Simple Assault Dom.'
--------------------------------------------------------------------------- KeyError Traceback (most recent call last) ~\Anaconda3\lib\site-packages\pandas\core\indexes\base.py in get_loc(self, key, method, tolerance) 2656 try: -> 2657 return self._engine.get_loc(key) 2658 except KeyError: pandas/_libs/index.pyx in pandas._libs.index.IndexEngine.get_loc() pandas/_libs/index.pyx in pandas._libs.index.IndexEngine.get_loc() pandas/_libs/hashtable_class_helper.pxi in pandas._libs.hashtable.PyObjectHashTable.get_item() pandas/_libs/hashtable_class_helper.pxi in pandas._libs.hashtable.PyObjectHashTable.get_item() KeyError: 'IncType' During handling of the above exception, another exception occurred: KeyError Traceback (most recent call last) <ipython-input-56-2774ed6fc2b9> in <module> ----> 1 df_auto=df[df['IncType'].str.contains("Auto Accessories")] 2 df_auto['Amount']='Between $500-1000' 3 df_auto.Amount.loc[(df_auto['IncType'].str.contains("500"))] = 'Under $500' 4 df_auto.Amount.loc[(df_auto['IncType'].str.contains("Over"))] = 'Over $1000' 5 #df_auto.query('Year>2019') ~\Anaconda3\lib\site-packages\pandas\core\frame.py in __getitem__(self, key) 2925 if self.columns.nlevels > 1: 2926 return self._getitem_multilevel(key) -> 2927 indexer = self.columns.get_loc(key) 2928 if is_integer(indexer): 2929 indexer = [indexer] ~\Anaconda3\lib\site-packages\pandas\core\indexes\base.py in get_loc(self, key, method, tolerance) 2657 return self._engine.get_loc(key) 2658 except KeyError: -> 2659 return self._engine.get_loc(self._maybe_cast_indexer(key)) 2660 indexer = self.get_indexer([key], method=method, tolerance=tolerance) 2661 if indexer.ndim > 1 or indexer.size > 1: pandas/_libs/index.pyx in pandas._libs.index.IndexEngine.get_loc() pandas/_libs/index.pyx in pandas._libs.index.IndexEngine.get_loc() pandas/_libs/hashtable_class_helper.pxi in pandas._libs.hashtable.PyObjectHashTable.get_item() pandas/_libs/hashtable_class_helper.pxi in pandas._libs.hashtable.PyObjectHashTable.get_item() KeyError: 'IncType'
This graph displays Auto Accessory Theft of Saint Paul up to 12/30/20XX

# Set a friendly Date variable
df_auto['FDate']=df_auto['Month'].astype(str) + '/' + df_auto['Day'].astype(str) + '/'
def plot_toDate_Year_SPAutoTheft(Day=Max):
B= df_auto.query('Year>2018')
Date= df_auto[(df_auto['DayYear'] == Day)]['FDate'][0:1].iloc[0,]
B= B[(B['DayYear'] <= Day)]
Index= ['Year','Community','Count']
C= B[Index].groupby(['Year','Community']).sum().reset_index()
print('This graph displays the Auto Accessory Theft of Saint Paul neighborhoods from {}20XX'.format(Date))
sns.set()
pd.pivot_table(C, values='Count', index=['Community'], columns=['Year'],
fill_value=0).plot(kind= 'barh',
figsize=(12,10),title= 'Auto Accessory Theft Yearly Total Incidents')
return plt.show()
plot_toDate_Year_SPAutoTheft()
--------------------------------------------------------------------------- KeyError Traceback (most recent call last) ~\Anaconda3\lib\site-packages\pandas\core\indexes\base.py in get_loc(self, key, method, tolerance) 2656 try: -> 2657 return self._engine.get_loc(key) 2658 except KeyError: pandas/_libs/index.pyx in pandas._libs.index.IndexEngine.get_loc() pandas/_libs/index.pyx in pandas._libs.index.IndexEngine.get_loc() pandas/_libs/hashtable_class_helper.pxi in pandas._libs.hashtable.PyObjectHashTable.get_item() pandas/_libs/hashtable_class_helper.pxi in pandas._libs.hashtable.PyObjectHashTable.get_item() KeyError: 'Month' During handling of the above exception, another exception occurred: KeyError Traceback (most recent call last) <ipython-input-9-e2f01770da9c> in <module> 1 # Set a friendly Date variable ----> 2 df_auto['FDate']=df_auto['Month'].astype(str) + '/' + df_auto['Day'].astype(str) + '/' 3 4 def plot_toDate_Year_SPAutoTheft(Day=Max): 5 B= df_auto.query('Year>2018') ~\Anaconda3\lib\site-packages\pandas\core\frame.py in __getitem__(self, key) 2925 if self.columns.nlevels > 1: 2926 return self._getitem_multilevel(key) -> 2927 indexer = self.columns.get_loc(key) 2928 if is_integer(indexer): 2929 indexer = [indexer] ~\Anaconda3\lib\site-packages\pandas\core\indexes\base.py in get_loc(self, key, method, tolerance) 2657 return self._engine.get_loc(key) 2658 except KeyError: -> 2659 return self._engine.get_loc(self._maybe_cast_indexer(key)) 2660 indexer = self.get_indexer([key], method=method, tolerance=tolerance) 2661 if indexer.ndim > 1 or indexer.size > 1: pandas/_libs/index.pyx in pandas._libs.index.IndexEngine.get_loc() pandas/_libs/index.pyx in pandas._libs.index.IndexEngine.get_loc() pandas/_libs/hashtable_class_helper.pxi in pandas._libs.hashtable.PyObjectHashTable.get_item() pandas/_libs/hashtable_class_helper.pxi in pandas._libs.hashtable.PyObjectHashTable.get_item() KeyError: 'Month'
# Set a friendly Date variable
df_auto['FDate']=df_auto['Month'].astype(str) + '/' + df_auto['Day'].astype(str) + '/'
def plot_toDate_Year_SPAutoTheft(Day=Max):
B= df_auto.query('Year>2018')
Date= df_auto[(df_auto['DayYear'] == Day)]['FDate'][0:1].iloc[0,]
B= B[(B['DayYear'] <= Day)]
Index= ['Year','Count']
C= B[Index].groupby(['Year']).sum().reset_index()
print('This graph displays Auto Accessory Theft of Saint Paul up to {}20XX'.format(Date))
sns.set()
pd.pivot_table(C, values='Count', columns=['Year'],
fill_value=0).plot(kind= 'barh',
figsize=(12,10),title= 'Auto Accessory Theft Incidents')
return plt.show()
plot_toDate_Year_SPAutoTheft()
This graph displays Auto Accessory Theft of Saint Paul up to 1/27/20XX

def plot_toDate_Year_SPAutoTheft(Day=366):
B= df_auto.query('Year>2018')
#Date= df_auto[(df_auto['DayYear'] == Day)]['FDate'][0:1].iloc[0,]
B= B[(B['DayYear'] <= Day)]
Index= ['Year','Count']
C= B[Index].groupby(['Year']).sum().reset_index()
return C
plot_toDate_Year_SPAutoTheft(365)
| Year | Count | |
|---|---|---|
| 0 | 2019 | 242 |
| 1 | 2020 | 1867 |
| 2 | 2021 | 247 |
Link All
def plot_SPAutoTheftYear(Day=Max):
B= df_auto.query('Year<2021')
Date= df_auto[(df_auto['DayYear'] == Day)]['FDate'][0:1].iloc[0,]
#B= B[(B['DayYear'] <= Day)]
Index= ['Year','Community','Count']
C= B[Index].groupby(['Year','Community']).sum().reset_index()
print('This graph displays "Auto Accessory Thefts" incidents of Saint Paul neighborhoods.')
sns.set()
pd.pivot_table(C, values='Count', index=['Community'], columns=['Year'],
fill_value=0).plot(kind= 'barh',
figsize=(12,10),title= 'Auto Accessory Thefts Yearly Total Incidents')
return plt.show()
plot_SPAutoTheftYear()
This graph displays "Auto Accessory Thefts" incidents of Saint Paul neighborhoods.

#Saint Paul Data Socrata
from sodapy import Socrata
#New Upload Method Get Information from Socrata API
client = Socrata("information.stpaul.gov", None)
#Easier to bulk upload
results = client.get("gppb-g9cg", limit=1000000)
df = pd.DataFrame.from_records(results)
#rename columns [Note the order of Columns have changed]
cols= ['Block','CallDispCode','CallDisposition','Case','Code', 'Count','Date','Grid','Incident','IncType','Neighborhood','NNum','Time']
df.columns= cols
df=df.dropna()
df = df.astype({"Case": int, "Code": int, "Grid":float, "NNum":int,"Count":int})
#Add Time Variables
df= df[df.Case != 18254093] #messed up time variable
df['Date']= pd.to_datetime(df['Date'])
df['Year']= df['Date'].dt.year
df=df.query('Year > 2017')
df['DayYear'] = df['Date'].dt.dayofyear
df['Community']= df['Grid'].apply(commun)
df= df.query('Code not in [9954,9959] and Community !="NaN"')
#df.at[0,'DayYear']
WARNING:root:Requests made without an app_token will be subject to strict throttling limits.
plot_toDate_Days_SPCrime(Incident='Discharge') #All Days
This graph displays total Discharge incidents of Saint Paul neighborhoods within 344 days from date 12/9/20XX

#PreCovid
plot_toDate_Days_SPCrime(Incident='Discharge',Day=CV, CDate=CV)
This graph displays total Discharge incidents of Saint Paul neighborhoods within 73 days from date 3/14/20XX
#Covid to Floyd's death
plot_toDate_Days_SPCrime(Incident='Discharge',Day=GE-CV, CDate=GE)
This graph displays total Discharge incidents of Saint Paul neighborhoods within 73 days from date 5/25/20XX
#Post: GeorgeFloyd
plot_toDate_Days_SPCrime(Incident='Discharge',Day=Max-244, CDate=Max)
This graph displays total Discharge incidents of Saint Paul neighborhoods within 100 days from date 12/9/20XX

def plot_toDate_Year_SPCityCrime(Incident='All',Day=Max):
if Incident=='All':
B= df
else:
B= df[(df['Incident'] == Incident)]
Date= fgc[(fgc['DayYear'] == Day)]['FDate'][0:1].iloc[0,]
B= B[(B['DayYear'] <= Day)]
Index= ['Year','Count']
C= B[Index].groupby(['Year']).sum().reset_index()
print('This graph maps {} annual incidents incidents of Saint Paul up to {}20XX'.format(Incident,Date))
sns.set()
pd.pivot_table(C, values='Count', index=['Year'],
fill_value=0).plot(kind= 'barh',
figsize=(6,4),title= Incident + ' Annual Total Incidents')
return plt.show()
plot_toDate_Year_SPCityCrime('Discharge',344)
This graph maps Discharge annual incidents incidents of Saint Paul up to 12/9/20XX

def plot_toDate_Days_SPCrime_Norm(Incident='All',Day=Max, CDate=Max):
if Incident=='All':
B= df
else:
B= df[(df['Incident'] == Incident)]
Date= fgc[(fgc['DayYear'] == CDate)]['FDate'][0:1].iloc[0,]
Bd= CDate-Day
B= B[(B['DayYear'] >= Bd)]
B= B[(B['DayYear'] <= CDate)]
Index= ['Year','Community','Count']
C= B[Index].groupby(['Year','Community']).sum().reset_index()
C1=pd.merge(C, Norm, on='Community', how='left').reset_index()
C1['Norm_Count']= (C1.Count/C1.Pop) *10000
print('This graph displays total {} incidents per 10000 residents within {} days from date {}20XX'.format(Incident,Day,Date))
sns.set()
pd.pivot_table(C1, values='Norm_Count', index=['Community'], columns=['Year'],
fill_value=0).plot(kind= 'barh',
figsize=(12,10),title= Incident + ' Yearly UptoDate Normalized Total Incidents')
return plt.show()
plot_toDate_Days_SPCrime_Norm(Incident='Discharge', Day= Max-244)
This graph displays total Discharge incidents per 10000 residents within 100 days from date 12/9/20XX

B= df.query("Incident=='Discharge'")
B= B.query('Hour >= 6 and Hour <20')
Index= ['Year','Count']
C= B[Index].groupby(['Year']).sum().reset_index()
C
| Year | Count | |
|---|---|---|
| 0 | 2018 | 1022 |
| 1 | 2019 | 956 |
| 2 | 2020 | 1755 |
df.Incident.unique()
array(['Narcotics', 'Vandalism', 'Auto Theft', 'Theft', 'Discharge',
'Robbery', 'Arson', 'Agg. Assault', 'Simple Asasult Dom.',
'Agg. Assault Dom.', 'Burglary', 'Rape', 'Graffiti', 'Homicide',
'Other'], dtype=object)
df.Incident.loc[(df['Incident'] == 'Simple Asasult Dom.')] = 'Simple Assault Dom.'
df.Incident.loc[(df['Incident'] == 'Graffiti')] = 'Vandalism'
df.Incident.loc[df["Incident"].isin([ "Rape","Agg. Assault",'Homicide'])]= 'Violent'
df.Incident.loc[df["Incident"].isin(["Simple Assault Dom.","Agg. Assault Dom."])]= 'Domestic Assault'
plot_toDate_Days_SPCrime(Incident='Auto Theft',Day=Max, CDate=Max)
This graph displays total Auto Theft incidents of Saint Paul neighborhoods within 344 days from date 12/9/20XX

df
| Block | CallDispCode | CallDisposition | Case | Code | Count | Date | Grid | Incident | IncType | Neighborhood | NNum | Time | Year | DayYear | Community | |
|---|---|---|---|---|---|---|---|---|---|---|---|---|---|---|---|---|
| 17 | 69X CONWAY ST | A | Advised | 20261208 | 1800 | 1 | 2020-12-09 23:28:49 | 114.0 | Narcotics | Narcotics | 4 - Dayton's Bluff | 4 | 2020-12-09T23:28:49.000 | 2020 | 344 | Dayton Bluff |
| 23 | 17X CHARLES AV | A | Advised | 20261188 | 1400 | 1 | 2020-12-09 23:09:22 | 90.0 | Vandalism | Criminal Damage to Property | 7 - Thomas/Dale(Frogtown) | 7 | 2020-12-09T23:09:22.000 | 2020 | 344 | Thomas-Frogtown |
| 28 | 30X SNELLING AV N | RR | Report Written | 20261169 | 1820 | 1 | 2020-12-09 22:21:00 | 105.0 | Narcotics | Narcotics, Possession of Synthetic Narcotic, D... | 13 - Union Park | 13 | 2020-12-09T22:21:00.000 | 2020 | 344 | Union Park |
| 29 | 51X STANTHONY AV | R | Report Written | 20261167 | 700 | 1 | 2020-12-09 22:16:23 | 109.0 | Auto Theft | Motor Vehicle Theft | 8 - Summit/University | 8 | 2020-12-09T22:16:23.000 | 2020 | 344 | Summit-University |
| 38 | 218X POWERS AV | RR | Report Written | 20261148 | 661 | 1 | 2020-12-09 21:37:00 | 140.0 | Theft | Theft, Bicycle Theft, Under $500 | 1 - Conway/Battlecreek/Highwood | 1 | 2020-12-09T21:37:00.000 | 2020 | 344 | Battle_Creek |
| 41 | 47X MARION ST | A | Advised | 20261132 | 1400 | 1 | 2020-12-09 21:08:21 | 110.0 | Vandalism | Criminal Damage to Property | 8 - Summit/University | 8 | 2020-12-09T21:08:21.000 | 2020 | 344 | Summit-University |
| 45 | 17X CHARLES AV | A | Advised | 20261141 | 1800 | 1 | 2020-12-09 21:01:57 | 90.0 | Narcotics | Narcotics | 7 - Thomas/Dale(Frogtown) | 7 | 2020-12-09T21:01:57.000 | 2020 | 344 | Thomas-Frogtown |
| 46 | WESTERN AV N & UNIVERSITY | G | Gone on Arrival | 20261115 | 1400 | 1 | 2020-12-09 20:50:18 | 90.0 | Vandalism | Criminal Damage to Property | 7 - Thomas/Dale(Frogtown) | 7 | 2020-12-09T20:50:18.000 | 2020 | 344 | Thomas-Frogtown |
| 55 | 73X PELHAM BD | RR | Report Written | 20261098 | 710 | 1 | 2020-12-09 20:14:00 | 81.0 | Auto Theft | Motor Vehicle Theft, Automobile | 12 - St. Anthony | 12 | 2020-12-09T20:14:00.000 | 2020 | 344 | St. Anthony |
| 59 | 158X RANDOLPH AV | RR | Report Written | 20261087 | 631 | 1 | 2020-12-09 20:02:00 | 164.0 | Theft | Theft, Shoplifting, Under $500 | 14 - Macalester-Groveland | 14 | 2020-12-09T20:02:00.000 | 2020 | 344 | Macalester_Groveland |
| 63 | MARYLAND AV W & NORTON | A | Advised | 20261070 | 2619 | 1 | 2020-12-09 19:38:20 | 29.0 | Discharge | Weapons, Discharging a Firearm in the City Limits | 6 - North End | 6 | 2020-12-09T19:38:20.000 | 2020 | 344 | North End |
| 80 | 16X 5 ST W | R | Report Written | 20261037 | 600 | 1 | 2020-12-09 18:49:23 | 152.0 | Theft | Theft, Except Auto Theft | 17 - Capitol River | 17 | 2020-12-09T18:49:23.000 | 2020 | 344 | Capital_River |
| 81 | 138X DANFORTH ST | A | Advised | 20261045 | 640 | 1 | 2020-12-09 18:49:19 | 29.0 | Theft | Theft, From Auto | 6 - North End | 6 | 2020-12-09T18:49:19.000 | 2020 | 344 | North End |
| 94 | 36X SPRING ST | A | Advised | 20261008 | 640 | 1 | 2020-12-09 18:28:26 | 171.0 | Theft | Theft, From Auto | 9 - West Seventh | 9 | 2020-12-09T18:28:26.000 | 2020 | 344 | West 7th |
| 103 | 58X MACKUBIN ST | A | Advised | 20260989 | 1800 | 1 | 2020-12-09 18:16:54 | 89.0 | Narcotics | Narcotics | 7 - Thomas/Dale(Frogtown) | 7 | 2020-12-09T18:16:54.000 | 2020 | 344 | Thomas-Frogtown |
| 104 | 133X FREMONT AV | RR | Report Written | 20260998 | 651 | 1 | 2020-12-09 18:12:00 | 97.0 | Theft | Theft, Auto Accessories, Under $500 | 4 - Dayton's Bluff | 4 | 2020-12-09T18:12:00.000 | 2020 | 344 | Dayton Bluff |
| 110 | 44X MARYLAND AV W | R | Report Written | 20260977 | 300 | 1 | 2020-12-09 18:04:02 | 49.0 | Robbery | Robbery | 6 - North End | 6 | 2020-12-09T18:04:02.000 | 2020 | 344 | North End |
| 125 | 117X VANBUREN AV | RR | Report Written | 20260983 | 710 | 1 | 2020-12-09 17:30:00 | 86.0 | Auto Theft | Motor Vehicle Theft, Automobile | 11 - Hamline/Midway | 11 | 2020-12-09T17:30:00.000 | 2020 | 344 | Midway |
| 139 | 24X CONGRESS ST E | R | Report Written | 20260904 | 300 | 1 | 2020-12-09 17:05:00 | 194.0 | Robbery | Robbery | 3 - West Side | 3 | 2020-12-09T17:05:00.000 | 2020 | 344 | West Side |
| 155 | 211X IVY AV E | RR | Report Written | 20260864 | 710 | 1 | 2020-12-09 16:31:00 | 40.0 | Auto Theft | Motor Vehicle Theft, Automobile | 2 - Greater East Side | 2 | 2020-12-09T16:31:00.000 | 2020 | 344 | Greater East Side |
| 163 | 77X HYACINTH AV E | A | Advised | 20260802 | 640 | 1 | 2020-12-09 15:17:58 | 34.0 | Theft | Theft, From Auto | 5 - Payne/Phalen | 5 | 2020-12-09T15:17:58.000 | 2020 | 344 | Payne-Phalen |
| 168 | 28X BURGESS ST | RR | Report Written | 20260792 | 1410 | 1 | 2020-12-09 14:52:00 | 70.0 | Vandalism | Criminal Damage to Property (Misdemeanor, Unde... | 6 - North End | 6 | 2020-12-09T14:52:00.000 | 2020 | 344 | North End |
| 178 | 93X TUSCARORA AV | RR | Report Written | 20260754 | 1410 | 1 | 2020-12-09 14:08:00 | 187.0 | Vandalism | Criminal Damage to Property (Misdemeanor, Unde... | 9 - West Seventh | 9 | 2020-12-09T14:08:00.000 | 2020 | 344 | West 7th |
| 187 | ARLINGTON AV E & WHITEBEAR | A | Advised | 20260740 | 700 | 1 | 2020-12-09 13:39:43 | 19.0 | Auto Theft | Motor Vehicle Theft | 2 - Greater East Side | 2 | 2020-12-09T13:39:43.000 | 2020 | 344 | Greater East Side |
| 189 | 143X FARRINGTON ST | R | Report Written | 20260720 | 640 | 1 | 2020-12-09 13:29:08 | 30.0 | Theft | Theft, From Auto | 6 - North End | 6 | 2020-12-09T13:29:08.000 | 2020 | 344 | North End |
| 190 | 39X WABASHA ST N | RR | Report Written | 20260718 | 631 | 1 | 2020-12-09 13:26:00 | 153.0 | Theft | Theft, Shoplifting, Under $500 | 17 - Capitol River | 17 | 2020-12-09T13:26:00.000 | 2020 | 344 | Capital_River |
| 191 | 11X 10 ST E | A | Advised | 20260716 | 600 | 1 | 2020-12-09 13:25:51 | 132.0 | Theft | Theft, Except Auto Theft | 17 - Capitol River | 17 | 2020-12-09T13:25:51.000 | 2020 | 344 | Capital_River |
| 192 | 117X VANBUREN AV | A | Advised | 20260719 | 700 | 1 | 2020-12-09 13:19:43 | 86.0 | Auto Theft | Motor Vehicle Theft | 11 - Hamline/Midway | 11 | 2020-12-09T13:19:43.000 | 2020 | 344 | Midway |
| 198 | 156X SHERWOOD AV | A | Advised | 20260735 | 640 | 1 | 2020-12-09 12:14:01 | 38.0 | Theft | Theft, From Auto | 2 - Greater East Side | 2 | 2020-12-09T12:14:01.000 | 2020 | 344 | Greater East Side |
| 199 | 191X UNIVERSITY AV W | RR | Report Written | 20260687 | 651 | 1 | 2020-12-09 12:11:00 | 83.0 | Theft | Theft, Auto Accessories, Under $500 | 11 - Hamline/Midway | 11 | 2020-12-09T12:11:00.000 | 2020 | 344 | Midway |
| ... | ... | ... | ... | ... | ... | ... | ... | ... | ... | ... | ... | ... | ... | ... | ... | ... |
| 186502 | 157X PACIFIC ST | RR | Report Written | 18000298 | 710 | 1 | 2018-01-01 00:00:00 | 118.0 | Auto Theft | Motor Vehicle Theft, Automobile | 1 - Conway/Battlecreek/Highwood | 1 | 8:00 | 2018 | 1 | Battle_Creek |
| 186503 | 183X MECHANIC AV | A | Advised | 18000180 | 1400 | 1 | 2018-01-01 00:00:00 | 59.0 | Vandalism | Criminal Damage to Property | 2 - Greater East Side | 2 | 7:54 | 2018 | 1 | Greater East Side |
| 186507 | 84X MARSHALL AV | RR | Report Written | 18000107 | 861 | 1 | 2018-01-01 00:00:00 | 128.0 | Domestic Assault | Assault, Domestic, Opposite Sex | 8 - Summit/University | 8 | 3:00 | 2018 | 1 | Summit-University |
| 186508 | 70X COMO AV | RR | Report Written | 18000078 | 2619 | 1 | 2018-01-01 00:00:00 | 48.0 | Discharge | Weapons, Discharging a Firearm in the City Limits | 10 - Como | 10 | 2:38 | 2018 | 1 | Como |
| 186509 | 127X BEECH ST | RR | Report Written | 18000081 | 710 | 1 | 2018-01-01 00:00:00 | 96.0 | Auto Theft | Motor Vehicle Theft, Automobile | 4 - Dayton's Bluff | 4 | 2:10 | 2018 | 1 | Dayton Bluff |
| 186510 | 114X HUDSON RD | RR | Report Written | 18000928 | 643 | 1 | 2018-01-01 00:00:00 | 117.0 | Theft | Theft, From Auto, Over $1000 | 4 - Dayton's Bluff | 4 | 2:00 | 2018 | 1 | Dayton Bluff |
| 186511 | 183X MECHANIC AV | RR | Report Written | 18000064 | 451 | 1 | 2018-01-01 00:00:00 | 59.0 | Domestic Assault | Aggravated Assault, Domestic | 2 - Greater East Side | 2 | 1:47 | 2018 | 1 | Greater East Side |
| 186512 | 159X RUTH ST | RR | Report Written | 18000289 | 1410 | 1 | 2018-01-01 00:00:00 | 19.0 | Vandalism | Criminal Damage to Property (Misdemeanor, Unde... | 2 - Greater East Side | 2 | 1:30 | 2018 | 1 | Greater East Side |
| 186513 | 7 ST E & EARL | RR | Report Written | 18000051 | 2619 | 1 | 2018-01-01 00:00:00 | 76.0 | Discharge | Weapons, Discharging a Firearm in the City Limits | 4 - Dayton's Bluff | 4 | 1:23 | 2018 | 1 | Dayton Bluff |
| 186514 | 220X 6 ST E | RR | Report Written | 18000050 | 1420 | 1 | 2018-01-01 00:00:00 | 100.0 | Vandalism | Criminal Damage to Property (Gross Mis., $250-... | 1 - Conway/Battlecreek/Highwood | 1 | 1:13 | 2018 | 1 | Battle_Creek |
| 186515 | 117X WESTERN AV N | A | Advised | 18000048 | 700 | 1 | 2018-01-01 00:00:00 | 49.0 | Auto Theft | Motor Vehicle Theft | 6 - North End | 6 | 1:10 | 2018 | 1 | North End |
| 186516 | 102X ARKWRIGHT ST | RR | Report Written | 18000209 | 710 | 1 | 2018-01-01 00:00:00 | 53.0 | Auto Theft | Motor Vehicle Theft, Automobile | 5 - Payne/Phalen | 5 | 1:00 | 2018 | 1 | Payne-Phalen |
| 186517 | 6 ST E & SIBLEY | RR | Report Written | 18000049 | 314 | 1 | 2018-01-01 00:00:00 | 133.0 | Robbery | Robbery, Highway, By Strong Arm | 17 - Capitol River | 17 | 1:00 | 2018 | 1 | Capital_River |
| 186518 | 123X 7 ST E | RR | Report Written | 18000016 | 2619 | 1 | 2018-01-01 00:00:00 | 76.0 | Discharge | Weapons, Discharging a Firearm in the City Limits | 4 - Dayton's Bluff | 4 | 0:48 | 2018 | 1 | Dayton Bluff |
| 186520 | 117X WESTERN AV N | RR | Report Written | 18000060 | 710 | 1 | 2018-01-01 00:00:00 | 49.0 | Auto Theft | Motor Vehicle Theft, Automobile | 6 - North End | 6 | 0:30 | 2018 | 1 | North End |
| 186521 | 167X GURNEY ST | RR | Report Written | 18000028 | 2619 | 1 | 2018-01-01 00:00:00 | 11.0 | Discharge | Weapons, Discharging a Firearm in the City Limits | 6 - North End | 6 | 0:30 | 2018 | 1 | North End |
| 186524 | FRONT AV & RICE | RR | Report Written | 18000017 | 2619 | 1 | 2018-01-01 00:00:00 | 51.0 | Discharge | Weapons, Discharging a Firearm in the City Limits | 6 - North End | 6 | 0:14 | 2018 | 1 | North End |
| 186525 | 52X ORANGE AV W | RR | Report Written | 18000014 | 2619 | 1 | 2018-01-01 00:00:00 | 29.0 | Discharge | Weapons, Discharging a Firearm in the City Limits | 6 - North End | 6 | 0:09 | 2018 | 1 | North End |
| 186526 | 68X VANBUREN AV | RR | Report Written | 18000006 | 2619 | 1 | 2018-01-01 00:00:00 | 88.0 | Discharge | Weapons, Discharging a Firearm in the City Limits | 7 - Thomas/Dale(Frogtown) | 7 | 0:03 | 2018 | 1 | Thomas-Frogtown |
| 186527 | 61X MAGNOLIA AV E | RR | Report Written | 18000007 | 2619 | 1 | 2018-01-01 00:00:00 | 54.0 | Discharge | Weapons, Discharging a Firearm in the City Limits | 5 - Payne/Phalen | 5 | 0:01 | 2018 | 1 | Payne-Phalen |
| 186530 | 34X CEDAR ST | RR | Report Written | 18000457 | 1835 | 1 | 2018-01-01 00:00:00 | 153.0 | Narcotics | Narcotics, Possession of Marijuana | 17 - Capitol River | 17 | 19:49 | 2018 | 1 | Capital_River |
| 186533 | EARL ST & MOUNDS | RR | Report Written | 18000467 | 710 | 1 | 2018-01-01 00:00:00 | 136.0 | Auto Theft | Motor Vehicle Theft, Automobile | 4 - Dayton's Bluff | 4 | 20:02 | 2018 | 1 | Dayton Bluff |
| 186534 | 140X ARCADE ST | RR | Report Written | 18000481 | 710 | 1 | 2018-01-01 00:00:00 | 35.0 | Auto Theft | Motor Vehicle Theft, Automobile | 5 - Payne/Phalen | 5 | 20:27 | 2018 | 1 | Payne-Phalen |
| 186536 | 133X MINNEHAHA AV W | RR | Report Written | 18000675 | 710 | 1 | 2018-01-01 00:00:00 | 86.0 | Auto Theft | Motor Vehicle Theft, Automobile | 11 - Hamline/Midway | 11 | 20:30 | 2018 | 1 | Midway |
| 186537 | 133X MINNEHAHA AV W | A | Advised | 18000491 | 700 | 1 | 2018-01-01 00:00:00 | 86.0 | Auto Theft | Motor Vehicle Theft | 11 - Hamline/Midway | 11 | 20:37 | 2018 | 1 | Midway |
| 186538 | 160X RICE ST | RR | Report Written | 18000498 | 691 | 1 | 2018-01-01 00:00:00 | 10.0 | Theft | Theft, All Other, Under $500 | 6 - North End | 6 | 20:46 | 2018 | 1 | North End |
| 186539 | 7X LEECH ST | RR | Report Written | 18000494 | 431 | 1 | 2018-01-01 00:00:00 | 150.0 | Domestic Assault | Aggravated Assault, Domestic | 9 - West Seventh | 9 | 21:30 | 2018 | 1 | West 7th |
| 186541 | 90X MARYLAND AV E | RR | Report Written | 18000464 | 1410 | 1 | 2018-01-01 00:00:00 | 55.0 | Vandalism | Criminal Damage to Property (Misdemeanor, Unde... | 5 - Payne/Phalen | 5 | 22:01 | 2018 | 1 | Payne-Phalen |
| 186544 | 125X VIRGINIA ST | RR | Report Written | 18000513 | 432 | 1 | 2018-01-01 00:00:00 | 30.0 | Domestic Assault | Aggravated Assault, Domestic | 6 - North End | 6 | 22:18 | 2018 | 1 | North End |
| 186545 | 117X EDMUND AV | RR | Report Written | 18800016 | 523 | 1 | 2018-01-01 00:00:00 | 86.0 | Burglary | Burglary, No Forced Entry, Night, Garage | 11 - Hamline/Midway | 11 | 22:30 | 2018 | 1 | Midway |
72310 rows × 16 columns
#dayshooting
df['TimeHour']= pd.to_datetime(df['Time'])
df['Hour'] = df['TimeHour'].dt.hour.astype(int) #Create Hour Colum
B= df.query("Incident=='Discharge'")
B= B.query('Hour >= 6 and Hour <20')
Index= ['Year','Count']
C= B[Index].groupby(['Year']).sum().reset_index()
C
| Year | Count | |
|---|---|---|
| 0 | 2018 | 267 |
| 1 | 2019 | 221 |
| 2 | 2020 | 352 |
def plot_toDate_Year_SPDayCrime(Incident='All',Day=Max):
if Incident=='All':
B= df
B= B.query('Hour >= 6 and Hour <20')
else:
B= df[(df['Incident'] == Incident)]
B= B.query('Hour >= 6 and Hour <20')
Date= fgc[(fgc['DayYear'] == Day)]['FDate'][0:1].iloc[0,]
B= B[(B['DayYear'] <= Day)]
Index= ['Year','Count']
C= B[Index].groupby(['Year']).sum().reset_index()
print('This graph displays daytime(7am to 8pm) {} annual incidents incidents of Saint Paul up to {}20XX'.format(Incident,Date))
sns.set()
pd.pivot_table(C, values='Count', index=['Year'],
fill_value=0).plot(kind= 'barh',
figsize=(6,4),title= Incident + ' Annual Total Incidents')
return plt.show()
plot_toDate_Year_SPDayCrime(Incident='Discharge', Day=Max)
This graph displays daytime(7am to 8pm) Discharge annual incidents incidents of Saint Paul up to 12/9/20XX

def plot_Frogtown_long_crime_todate1(Incident='All',Day=Max):
Index =['Block','Latitude','Longitude', 'Count','Theft','Vandalism','Narcotics','Auto Theft','Burglary','Discharge'\
,'Robbery','Domestic Assault','Violent','Arson','Year']
# generate a new map
FG_map = folium.Map(location=[44.958326, -93.122926], zoom_start=14,tiles="OpenStreetMap")
#setup
if Incident=='All':
B= fgc
else:
B= fgc[(fgc['Incident'] == Incident)]
Date= fgc[(fgc['DayYear'] == Day)]['FDate'][0:1].iloc[0,]
B= B[(B['DayYear'] <= Day)]
B19=B.query('Year == 2020')
B19=B19[Index].groupby(['Year','Block','Latitude','Longitude']).sum().reset_index()
print('This map displays {} incidents up to {}20XX'.format(Incident,Date))
for index, row in B19.iterrows():
popup_text = "Year: {}<br> Address: {}<br> total incidents: {}"
popup_text = popup_text.format(row["Year"],row["Block"], row['Count'])
folium.CircleMarker(location=(row["Latitude"],row["Longitude"]),
radius=row['Count']+3,
color="#800080",
popup=popup_text,
fill=True).add_to(FG_map)
return FG_map
plot_Frogtown_long_crime_todate1(Incident='Discharge',Day=Max)
This map displays Discharge incidents up to 12/9/20XX