In [8]:
import mglearn # credits to Muller and Guido (https://www.amazon.com/dp/1449369413/)
import matplotlib.pyplot as plt
import numpy as np
%matplotlib inline
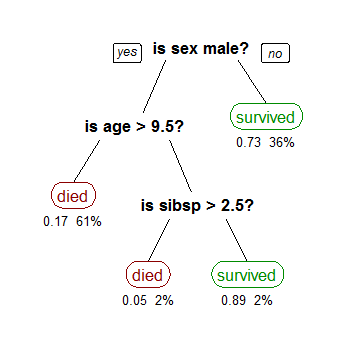
mglearn.plots.plot_tree_not_monotone()
Feature importances: [ 0. 1.]
Out[8]:

In [2]:
from sklearn.datasets import load_breast_cancer
from sklearn.tree import DecisionTreeClassifier
from sklearn.model_selection import train_test_split

cancer = load_breast_cancer()
X_train, X_test, y_train, y_test = train_test_split(cancer.data, cancer.target, stratify=cancer.target, random_state=42)
tree = DecisionTreeClassifier(random_state=0)
tree.fit(X_train, y_train)

print('Accuracy on the training subset: {:.3f}'.format(tree.score(X_train, y_train)))
print('Accuracy on the test subset: {:.3f}'.format(tree.score(X_test, y_test)))
Accuracy on the training subset: 1.000
Accuracy on the test subset: 0.937
In [3]:
tree = DecisionTreeClassifier(max_depth=4, random_state=0)
tree.fit(X_train, y_train)

print('Accuracy on the training subset: {:.3f}'.format(tree.score(X_train, y_train)))
print('Accuracy on the test subset: {:.3f}'.format(tree.score(X_test, y_test)))
Accuracy on the training subset: 0.988
Accuracy on the test subset: 0.951
In [4]:
import graphviz
from sklearn.tree import export_graphviz

export_graphviz(tree, out_file='cancertree.dot', class_names=['malignant', 'benign'], feature_names=cancer.feature_names,
               impurity=False, filled=True)

In [6]:
print('Feature importances: {}'.format(tree.feature_importances_))
type(tree.feature_importances_)
Feature importances: [ 0.          0.          0.          0.          0.          0.          0.
  0.          0.          0.          0.01019737  0.04839825  0.          0.
  0.0024156   0.          0.          0.          0.          0.
  0.72682851  0.0458159   0.          0.          0.0141577   0.          0.018188
  0.1221132   0.01188548  0.        ]
Out[6]:
numpy.ndarray
In [7]:
print(cancer.feature_names)
['mean radius' 'mean texture' 'mean perimeter' 'mean area'
 'mean smoothness' 'mean compactness' 'mean concavity'
 'mean concave points' 'mean symmetry' 'mean fractal dimension'
 'radius error' 'texture error' 'perimeter error' 'area error'
 'smoothness error' 'compactness error' 'concavity error'
 'concave points error' 'symmetry error' 'fractal dimension error'
 'worst radius' 'worst texture' 'worst perimeter' 'worst area'
 'worst smoothness' 'worst compactness' 'worst concavity'
 'worst concave points' 'worst symmetry' 'worst fractal dimension']
In [9]:
n_features = cancer.data.shape[1]
plt.barh(range(n_features), tree.feature_importances_, align='center')
plt.yticks(np.arange(n_features), cancer.feature_names)
plt.xlabel('Feature Importance')
plt.ylabel('Feature')
plt.show()

In [ ]:
In [ ]: