CptS 215 Introduction to Algorithmic Problem Solving
PA5 Decision Trees (100 pts)
Due:
Learner Objectives
At the conclusion of this programming assignment, participants should be able to:
- Understand decision trees
- Building from a training set of examples
- Classifying new examples
- Implement the ID3 tree building algorithm
- Understand k-fold cross validation
- Visualize trees
Prerequisites
Before starting this programming assignment, participants should be able to:
- Write object-oriented code in Python
- Implement a tree ADT and common tree algorithms
- Write Markdown and code cells in Jupyter Notebook
- Create plots with
matplotlib
Acknowledgments
Content used in this assignment is based upon information in the following sources:
- sci-kit learn machine learning library
- Data Science from Scratch by Joel Grus
Overview and Requirements
For this programming assignment, we are going to investigate the accuracy of our ID3 decision tree implementation compared to the decision tree implemented in the sci-kit learn machine learning library. We are going to train the models to classify whether passengers on the RMS Titanic survived the shipwreck or not.
For this assignment, we are going to implement the following:
- Write code to read a dataset in from a file
- Dataset file name will be specified as a command line argument
- Use a
pandasDataframeto read in and store the data
- Re-write the ID3 decision tree code from the class notes to make use of an object oriented implementation of a tree
- Instead of the
True,False, tuple tree representation used by Joel Grus, implement an object oriented tree
- Instead of the
- Write code to implement K-fold cross validation
- Value of K will be specified as a command line argument
- Write code to compute classifier evaluation metrics
- Accuracy
- Precision
- Recall
- F1 score
- Adapt the
sci-kit learnexample code provided in this document to compare the ID3 decision tree implementation to sci-kit learn's implementation of a decision tree - Write code to plot the evaluation metric results of code executions with different values of K
The following sections describe each of these steps in more detail.
Note: for this assignment, code one Jupyter Notebook that tells the story of your data science endeavor with results. All python code (e.g. decision tree classes and functions, classification evaluation metrics, sci-kit learn's DecisionTreeClassifier comparision) are to be implemented in .py files, and the results of the classification are to be included in the Jupyter Notebook.
Program Details
Background: K-fold Cross Validation
In our example in class with the job candidate dataset, we trained our decision tree model on 14 examples. We then tested our model on 4 new examples that the model had not yet seen. We did not use these new examples to update the model. This approach to training and testing is called the holdout method. In the holdout method, the dataset is divided into two sets, the training and the testing set. The training set is used to build the model and the testing set is used to evaluate the model (e.g. the model's accuracy). One of the shortcomings of this approach is the evaluation of the model depends heavily on which examples are selected for training versus testing.
 (image from [https://upload.wikimedia.org/wikipedia/commons/thumb/0/09/Supervised_machine_learning_in_a_nutshell.svg/2000px-Supervised_machine_learning_in_a_nutshell.svg.png](https://upload.wikimedia.org/wikipedia/commons/thumb/0/09/Supervised_machine_learning_in_a_nutshell.svg/2000px-Supervised_machine_learning_in_a_nutshell.svg.png))
K-fold cross validation is a model evaluation approach that addresses this shortcoming of the holdout method. For K-fold cross validation, the examples are divided into k subsets $S = s_{1},...,s_{i},...,s_{k}$ and the holdout method is repeated k times. Each iteration $i$, subset $s_{i}$ is held out of the training set. Subsets $S - {s_{i}}$ are used for training and $s_{i}$ is used for testing. The average performance of all $k$ train/test trials is computed and evaluated.
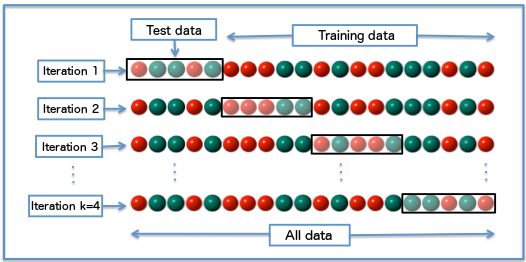 (image from [https://upload.wikimedia.org/wikipedia/commons/1/1c/K-fold_cross_validation_EN.jpg](https://upload.wikimedia.org/wikipedia/commons/1/1c/K-fold_cross_validation_EN.jpg))
Note: K = 1 is called leave-one-out cross validation.
Background: Evaluation Metrics
While there are several classification evaluation metrics, we are only going to cover four of the most common classification evaluation metrics. For each machine learning model, compute the following metrics:
- Classification accuracy: the proportion of correct classifications made out of all classifications made: $$Accuracy = \frac{\# correct}{\# correct + \# incorrect}$$
- Note: Not useful when classes are imbalanced (e.g. 99% accuracy when 99% of the dataset is the positive class)
- Precision (positive predictive value): the proportion of correctly classified positives out of all classified positives: $$Precision = \frac{\# true positives}{\# true positives + \# false positives}$$
- A true positive is a positive example that is correctly classified as a positive example during testing
- A false positive is a negative example that is incorrectly classified as a positive example during testing
- Recall (true positive rate): the proportion of correctly classified positives out of all positives (regardless of classification): $$Recall = \frac{\# true positives}{\# true positives + \# false negatives}$$
- A false negative is a positive example that is incorrectly classified as a negative example during testing
- F1 score: the harmonic mean of precision and recall: $$F1 = \frac{2(precision \times recall)}{precision + recall}$$
- Summarizes a classifier in a single number (however, it is best practice to still investigate precision and recall, as well as other evaluation metrics)
Note: There is a trade-off between precision and recall. For a balanced class dataset, a model that predicts mostly positive examples will have a high recall and a low precision.
Dataset
Download titanic.txt. This dataset is from this site and is a text file containing 2202 examples.
Each row in this file is a comma-separated list of values representing attributes of passengers aboard the Titanic:
- class: 0 = crew, 1 = first class, 2 = second class, 3 = third class
- age: 1 = adult, 0 = child
- sex: 1 = male, 0 = female
- survived: 1 = yes, 0 = no
Note: the first line in the file is the header describing the order of the attributes. You can read this in as the header when using pandas.read_csv(). Each line after the header represents a single passenger's attributes.
sci-kit learn Example Code
Below is example code that trains and tests a decision tree using sci-kit learn's DecisionTreeClassifier. This code is going to work with the Iris dataset that is a common dataset used in the library's example code. For this dataset, there are 3 class labels representing different types of iris' (flowers): Setosa, Versicolour, and Virgninica. There are four attributes for each class example: sepal length, sepal width, petal length, petal width. There are 150 examples in the dataset.
from sklearn import tree
from sklearn.datasets import load_iris

iris = load_iris()
clf = tree.DecisionTreeClassifier()

# iris.data is 2D numpy ndarray of 150 examples.
# Each example is a list of 4 attribute values.
print(iris.data.shape, type(iris.data))

# iris.target is 1D numpy ndarray of 150 labels.
print(iris.target.shape, type(iris.target))

# fit is for training
clf = clf.fit(iris.data, iris.target)
# predict is for classifying
predicted_integer = clf.predict(iris.data[:1, :])
# get the string label for the predicted class
predicted_class = iris.target_names[predicted_integer]
print(predicted_class)
(150, 4) <class 'numpy.ndarray'>
(150,) <class 'numpy.ndarray'>
['setosa']
Since we will be evaluating our ID3 decision tree implementation in K-fold cross validation, we will need to get similar results for the DecisionTreeClassifier. We need mean accuracy, precision, recall, and F1 score for the classifier in K fold cross validation.
K fold cross validation is computed with the cross_val_score() function, which by default for a DecisionTreeClassifier evaluates the model by mean accuracy (shown in the example below). The remaining metrics can be specified by the scoring parameter of cross_val_score() (simply set scoring to one of the following: scoring=precision, scoring=recall, scoring=f1). Since the Iris dataset is a multi class problem (3 classes), the example below does not include precision, recall, or F1 score.
from sklearn.model_selection import cross_val_score

iris = load_iris()
clf = tree.DecisionTreeClassifier()

# model, examples, labels, K
accuracies = cross_val_score(clf, iris.data, iris.target, cv=5)
# by default returns the mean accuracy
print(accuracies) # 5 scores, one for each iteration of K fold cross validation
[ 0.96666667 0.96666667 0.9 0.93333333 1. ]
Plotting
For values of K = 1, 2, ..., 20, run the ID3 code and the DecisionTreeClassifier code, storing each models performance in terms of the previously specified evaluation metrics. Plot each of these evaluation metrics (Y-axis) separately as a function of K (X-axis).
Write up your observations of the plots.
- What do you notice?
- How does K impact each of the evaluation metrics?
- How does the different tree implementation affect the performance?
Bonus (10 pts)
- (5 pts) Programmatically visualize the ID3 decision tree and the
sci-kit learndecision tree. You are free to use the example code from class (usingnetworkxandpydot) or you can use another Python library. Include the plots as .png or .pdf files in your final zip file.- Note: You may want to check out: sklearn.tree.export_graphviz (uses Graphviz)
- (5 pts) Compare the ID3 decision tree and the
sci-kit learndecision tree to at least two other classification models insci-kit learn. I recommend checking out the following algorithms:
Include plots for the results for these classifiers against the ID3 decision tree in your final zip file.
Submitting Assignments
- Use the Blackboard tool https://learn.wsu.edu to submit your assignment. You will submit your code to the corresponding programming assignment under the "Content" tab. You must upload your solutions as
<your last name>_pa4.zipby the due date and time. - Your .zip file should contain your .ipynb file, .py files (tree class code), and your .txt files used to test your program.
Grading Guidelines
This assignment is worth 100 points + 10 points bonus. Your assignment will be evaluated based on a successful compilation and adherence to the program requirements. We will grade according to the following criteria:
- 5 pts for reading information in from command line
- 5 pts for using a
pandasDataframeto store the dataset - 15 pts for correct object oriented tree implementation and ID3 adaptation
- 15 pts for correct K fold cross validation implementation
- 20 pts (5 pts/each) for correct evaluation metric
- 10 pts for utilizing the
sci-kit learnDecisionTreeClassifierimplementation - 15 pts for plotting
- 10 pts for write up of observations
- 5 pts for adherence to proper programming style and comments established for the class