Make me look good. Click on the cell below and press Ctrl+Enter.
from IPython.core.display import HTML
HTML(open('css/custom.css', 'r').read())
SM286D · Introduction to Applied Mathematics with Python · Spring 2020 · Uhan
Lesson 14.
Working with images in Python
This lesson...
- The bigger picture
- Binary numbers
- Digital images: pixels, 8-bit images
- Images as matrices
The bigger picture
In the next lesson, we will learn how to perform steganography, or the practice of concealing messages or information within other nonsecret text or data.
In particular, we will learn how to hide a secret image inside another image.
To do this, though, we first need to learn how to work with digital images!
Binary numbers
First, some background on binary numbers.
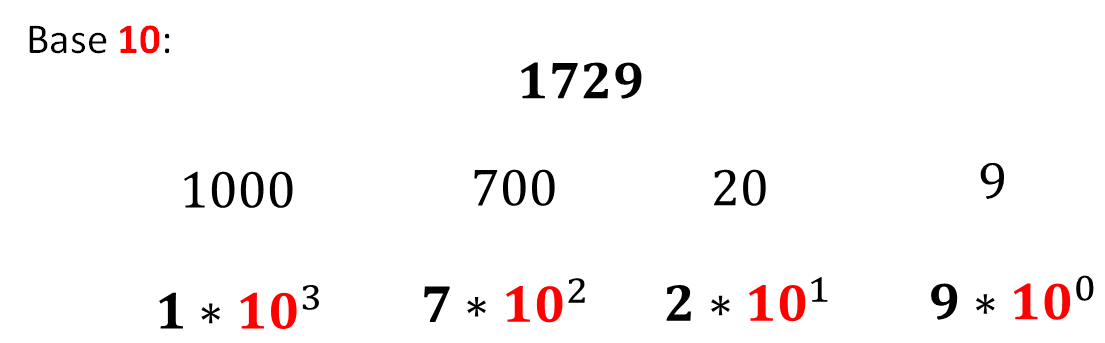
Figure 1 below shows how the number 1729 can be written using a decimal, or Base 10, expansion.
Binary numbers are Base 2 numbers: each digit can be 0 or 1.
- In a binary number, the digits are also referred to as bits.
For example, $[1001]_2$ is a 4-bit binary number. Figure 2 below shows the Base 2 expansion of this binary number.
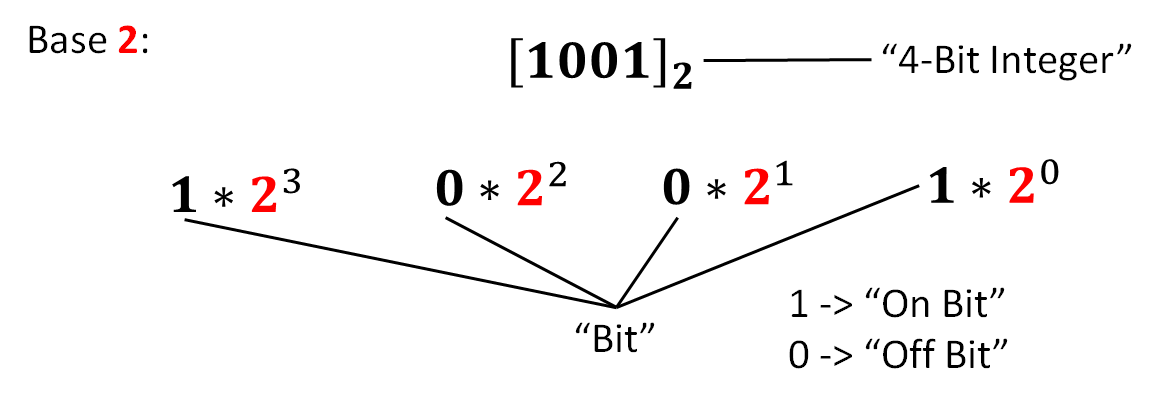
Based on the expansion above, the Base 10 equivalent of $[1001]_2$ is
$$ (1 \times 2^3) + (0 \times 2^2) + (0 \times 2^1) + (1 \times 2^0) = 9. $$
In a binary number, a 1 is also known as an on bit and a 0 is also known as an off bit.
We index the bits from right to left, starting at 0.
The leftmost bit is the most significant bit. The rightmost bit is the least signficant bit.
Digital images
- Digital images are really just a collection of picture elements, or pixels, as shown below.
Each pixel contains color information for the three primary colors, red, green, and blue.
In an 8-bit image, the total number of shades for each color is $2^8 = 256$.
Figure 4 below shows an example of a pixel and its associated color information stored as 8-bit integers.
- The pixel from Figure 4 is shown in Figure 5 below with the 8-bit integers given in their binary and decimal representations.
Images as matrices
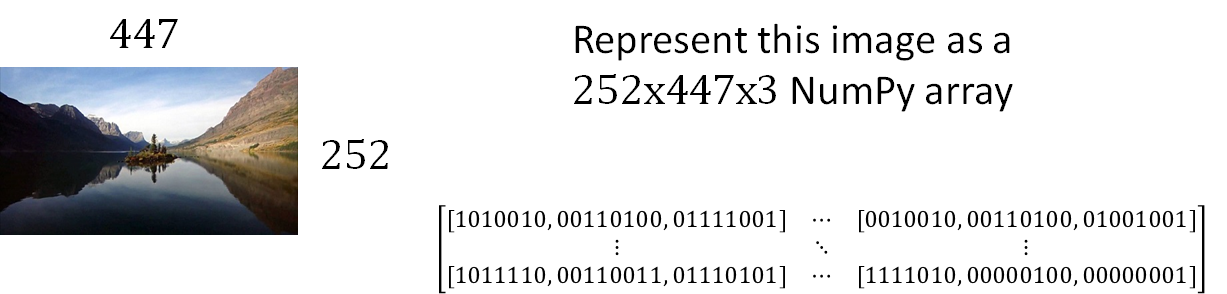
- We can represent the image shown in Figure 6 below as a 3-dimensional NumPy array with dimensions 252 x 447 x 3.
The code in the cell below reads the image file
GooseIsland.jpg, stores it in a variable calledgoose_island, and plots it as a Matplotlib figure.- Note. You may have to run the code twice to get the image to appear.
import matplotlib.pyplot as plt
import matplotlib.image as img

# Read the image file called 'GooseIsland.jpg'
# Store image information in variable
goose_island = img.imread('GooseIsland.jpg')

# View the image as a Matplotlib figure
plt.imshow(goose_island)
<matplotlib.image.AxesImage at 0x114119f90>

- We can access the information stored in a single pixel of the image like this:
# Get information about pixel 50 rows down from the top of the image
# and 75 columns from the left side of the image
goose_island[50, 75]
array([171, 195, 219], dtype=uint8)
The resulting array contains the red, green, and blue color information for this pixel, represented as 8-bit integers in Base 10.
The color information is actually stored in memory as unsigned, 8-bit integers as indicated by
dtype=uint8.For further information about the uint8 data type, see the NumPy documentation on its data types.
We'll come back to why we care about representing the image color information in Base 2 instead of Base 10 in the next lesson.
Classwork
Problem 1. Go through the examples below. The examples demonstrate how images can be represented as $m\times n \times 3$ arrays of numbers between 0 and 255. After this brief introduction, you should be ready to tackle Problem 2.
import numpy as np
import matplotlib.pyplot as plt

# Start by defining M1 as a 3-dimensional array of size 100 x 100 x 3 of 0s
# Make sure the array consists of unsigned 8-bit integers with the keyword argument dtype='uint8'
# Resulting image is 100 pixels tall and 100 pixels wide
# The last dimension is size 3, to represent RGB (red/green/blue) levels
M1 = np.zeros((100, 100, 3), dtype='uint8')

# Since all color levels = 0, we get a black box.
plt.imshow(M1)
<matplotlib.image.AxesImage at 0x1143ad210>

# Start with 100 x 100x 3 array of 0s
M2 = np.zeros((100, 100, 3), dtype='uint8')

# For each pixel, make its red value 255
# Note that we can use slices instead of single indices
# Below, we're changing the value of M2[i, j, 0]
# for i and j both ranging between 0 and 99
M2[0:100, 0:100, 0] = 255

# We get a red box
plt.imshow(M2)
<matplotlib.image.AxesImage at 0x114473310>

# Similar to above, but with green
# What's different about this code?
M3 = np.zeros((100, 100, 3), dtype='uint8')
M3[0:100, 0:100, 1] = 255
plt.imshow(M3)
<matplotlib.image.AxesImage at 0x1141c0810>

# Similar to above, but with blue
# What's different about this code?
M4 = np.zeros((100, 100, 3), dtype='uint8')
M4[0:100, 0:100, 2] = 255
plt.imshow(M4)
<matplotlib.image.AxesImage at 0x11458a410>

# We can mix colors: red and blue make purple
M5 = np.zeros((100, 100, 3), dtype='uint8')
M5[0:100, 0:100, 0] = 255  # red
M5[0:100, 0:100, 2] = 255  # blue
plt.imshow(M5)
<matplotlib.image.AxesImage at 0x114659350>

The code below is a bit more complicated. It draws the flag of Ireland (pictured below).

# Ireland
# Green: R: 22, G: 155, B: 98
# White: R: 255, G: 255, B: 255
# Orange: R: 255, G: 136, B: 62

# Start with 100x300x3 array of 0s
ireland = np.zeros((100,300,3),dtype='uint8')

# Green goes in the left third
ireland[0:100, 0:100, 0] = 22
ireland[0:100, 0:100, 1] = 155
ireland[0:100, 0:100, 2] = 98

# White goes in the middle third
ireland[0:100, 100:200, 0] = 255
ireland[0:100, 100:200, 1] = 255
ireland[0:100, 100:200, 2] = 255

# Orange goes in the right third
ireland[0:100, 200:300, 0] = 255
ireland[0:100, 200:300, 1] = 136
ireland[0:100, 200:300, 2] = 62

# Show the resulting image without the axes
plt.imshow(ireland)
plt.axis("off")
(-0.5, 299.5, 99.5, -0.5)

Hint. For more complex colors, to get the necessary values for red, green, and blue, do a Google search for "RGB color picker".
Problem 2. Write code to display a $101 \times 101$ white box.
# Solution 1
M6a = 255 * np.ones((101, 101, 3), dtype='uint8')
plt.imshow(M6a)

# Alternate solution
M6 = np.zeros((101, 101, 3), dtype='uint8')
M6[0:101, 0:101, 0] = 255
M6[0:101, 0:101, 1] = 255
M6[0:101, 0:101, 2] = 255
plt.imshow(M6)
<matplotlib.image.AxesImage at 0x114789810>

Problem 3. Write code that uses appropriately sized arrays to display the flags of the following countries.
Italy

# Italy
# Green: 0, 146, 70 (R, G, B)
# White: 255, 255, 255
# Red: 206, 43, 55

# Start with 100x300x3 array of 0s
italy = np.zeros((100, 300, 3), dtype='uint8')

# Green goes in the left third
italy[0:100, 0:100, 0] = 0
italy[0:100, 0:100, 1] = 146
italy[0:100, 0:100, 2] = 70

# White goes in the middle third
italy[0:100, 100:200, 0] = 255
italy[0:100, 100:200, 1] = 255
italy[0:100, 100:200, 2] = 255

# Red goes in the right third
italy[0:100, 200:300, 0] = 206
italy[0:100, 200:300, 1] = 43
italy[0:100, 200:300, 2] = 55

# Show the resulting image without the axes
plt.imshow(italy)
plt.axis("off")
(-0.5, 299.5, 99.5, -0.5)

Belgium

# Belgium
# Black: 0, 0, 0
# Yellow: 250, 224, 66
# Red: 237, 41, 57

# Start with 100x300x3 array of 0s
belgium = np.zeros((100, 300, 3), dtype='uint8')

# Black goes in the left third
belgium[0:100, 0:100, 0] = 0
belgium[0:100, 0:100, 1] = 0
belgium[0:100, 0:100, 2] = 0

# Yellow goes in the middle third
belgium[0:100, 100:200, 0] = 250
belgium[0:100, 100:200, 1] = 224
belgium[0:100, 100:200, 2] = 66

# Red goes in the right third
belgium[0:100, 200:300, 0] = 237
belgium[0:100, 200:300, 1] = 41
belgium[0:100, 200:300, 2] = 57

# Show the resulting image without the axes
plt.imshow(belgium)
plt.axis("off")
(-0.5, 299.5, 99.5, -0.5)

Chad

# Chad
# Blue: 0, 36, 100
# Yellow : 254, 203, 0
# Red: 198, 12, 48

# Start with 100x300x3 array of 0s
chad = np.zeros((100, 300, 3), dtype='uint8')

# Blue goes in the left third
chad[0:100, 0:100, 0] = 0
chad[0:100, 0:100, 1] = 36
chad[0:100, 0:100, 2] = 100

# Yellow goes in the middle third
chad[0:100, 100:200, 0] = 254
chad[0:100, 100:200, 1] = 203
chad[0:100, 100:200, 2] = 0

# Red goes in the right third
chad[0:100, 200:300, 0] = 198
chad[0:100, 200:300, 1] = 12
chad[0:100, 200:300, 2] = 48

# Show the resulting image without the axes
plt.imshow(chad)
plt.axis("off")
(-0.5, 299.5, 99.5, -0.5)

Problem 4. Write code that fills in the $41\times41$ center of your $101\times101$ white box from Problem 2 with a red box. Display the resulting image.
# Create 3D array representing white box
M = 255 * np.ones((101, 101, 3), dtype='uint8')

# Make the center pixels red by making the green and blue values 0.
# Note the use of the slice `1:` - recall this accesses indices starting at 1 up to the last index.
M[30:72, 30:72, 1:] = 0

# Show the resulting image
plt.imshow(M)
<matplotlib.image.AxesImage at 0x114a5a410>

Problem 5. Write code that draws a solid blue disk inscribed in a $101 \times 101$ white box. Display the resulting image.
Take some time to think through how you ought to do this question rather than just jumping in to try to code it up. Hint. Can you find the distance from (50, 50), the center of the box, to the point (i, j)?
# Distance from (50, 50) to (i, j) is ((i - 50)**2 + (j - 50)**2)**(0.5).
# We want to draw a circle of radius 50 centered at (50, 50).

# Initialize white box, 101x101 pixels
M = 255 * np.ones((101, 101, 3), dtype='uint8')

# Loop over all the pixels in the box
# Color the pixel blue if its distance from the center <= 50
# Otherwise, leave the pixel white
for i in range(101):
    for j in range(101):
        distance = ((i - 50)**2 + (j - 50)**2) ** (0.5)
        if distance <= 50:
            # Want point to be blue, so turn off green and red
            M[i, j, 0:2] = 0

# Show resulting image
plt.imshow(M)
<matplotlib.image.AxesImage at 0x114828910>

Problem 6.
You should have already imported the image subpackage of matplotlib as img. Use its imread command to read in the file herndon2019.jpg (in the same folder as this notebook) and store it in the matrix M. Display the image to reproduce the image below.

M = img.imread('herndon2019.jpg')
plt.imshow(M)
<matplotlib.image.AxesImage at 0x11498d9d0>

The matrix M is read in to memory in non-mutable form — that is, we can't change it. But in this question we want to modify the image!
Here's how to do that. Make a new array N that is the same size as M. Now set the values of N equal to the values of M using the slicing notation as in the code below.
(Note that this is similar to the technique we used to copy lists — see PCC page 63.)
# Get dimensions of M
h, w, c = M.shape

# Initialize matrix N to be an array of 0s, same dimension as M
N = np.zeros((h, w, c), dtype='uint8')

# Copy each entry of M to N
N[0:h, 0:w, 0:c] = M[0:h, 0:w, 0:c]
Using the slicing notation allows us to change the values of N. If we'd just written N = M, then the values of N would point to the values of M, meaning we wouldn't be able to change the values of N either, because that would mean that we'd be changing the values of M!
Now change the values of N as follows.
Erase the green layer by setting all of the green values of N to zero. Display the new image.
# Erase the green layer
N[0:h, 0:w, 1] = 0

# Display the image without the green layer
plt.imshow(N)
<matplotlib.image.AxesImage at 0x114a7b410>

Write the new image to the file herndon2019-g.jpg using the code below.
# Save image to file
plt.imsave('herndon2019-g.jpg', N, format='jpg')
Problem 7.
Load the file Reynolds.jpg (in the same folder as this notebook) into a 3-dimensional NumPy array M. Create three 3-dimensional arrays, M_r, M_g, and M_b, which are the red, green and blue components of M. For instance, to make M_r you should set the blue and green components of the image M to zero. Then produce a 1 $\times$ 3 figure of the components as shown below.

Hint. Recall fig.add_subplot() from Project 1.
# Load image file into array
M = img.imread('Reynolds.jpg')

# Get dimensions of array
h, w, c = M.shape

# Create red component of M by zeroing out green and blue values
M_r = 255 * np.ones((h, w, c), dtype ='uint8')
M_r[0:h, 0:w, 0:c] = M[0:h, 0:w, 0:c]  # copy array M, then modify
M_r[:, :, 1:3] = 0

# Create green component of M by zeroing out red and blue values
M_g = 255 * np.ones((h, w, c), dtype ='uint8')
M_g[0:h, 0:w, 0:c] = M[0:h, 0:w, 0:c]   # copy array M, then modify
M_g[:, :, 0] = 0
M_g[:, :, 2] = 0

# Create blue component of M by zeroing out red and green values
M_b = 255 * np.ones((h, w, c),  dtype ='uint8')
M_b[0:h, 0:w, 0:c] = M[0:h, 0:w, 0:c]   # copy array M, then modify
M_b[:, :, 0:2] = 0

# Create figure with 3 subplots
fig = plt.figure()

# Subplot 1: red
ax = fig.add_subplot(1,  3,  1)
ax.imshow(M_r)
ax.set_title("Red")
ax.axis("off")

# Subplot 2: green
ax = fig.add_subplot(1,  3,  2)
ax.imshow(M_g)
ax.set_title("Green")
ax.axis("off")

# Subplot 3: blue
ax = fig.add_subplot(1,  3,  3)
ax.imshow(M_b)
ax.set_title("Blue")
ax.axis("off")

# Display figure
fig.show(warn=False)  # Avoid backend warnings with keyword argument warn=False

Problem 8.
Load the image calico_cat_in_greece.jpg (in the same folder as this notebook) into an array S. Using what that you've learned today, make an image with the cat picture surrounded by a black border. One way to do this is to make a larger, all black image, and then set the central pixels equal to the cat picture. Display the new image.
# Load image into array
S = img.imread('calico_cat_in_greece.jpg')

# Get dimensions of array
h, w, c = S.shape

# Create new 3D array to represent image with 100 more pixels
# in the vertical (height) and horizontal (width) directions
S_new = np.zeros((h + 100, w + 100, c), dtype='uint8')

# Copy the values of S into S_new
S_new[50:h + 50, 50:w + 50, 0:3] = S[:, :, :]

# Display resulting image
plt.imshow(S_new)
<matplotlib.image.AxesImage at 0x1152bdc50>

Problem 9. What decimal number is represented by the 8-bit integer $[10101101]_2$?
Write code to perform the Base 2 expansion. You may represent $[10101101]_2$ as a list, that is:
n = [1, 0, 1, 0, 1, 1, 0, 1]
# Put the bits of the given 8-bit integer into an array
n = [1,0,1,0,1,1,0,1]

# Base 2 expansion
val = 0
for pos in range(len(n)):
    val += n[-1 - pos] * (2 ** pos)

# Print the decimal number
print(f'The decimal representation of {n}_2 is {val}.')
The decimal representation of [1, 0, 1, 0, 1, 1, 0, 1]_2 is 173.
Problem 10. In Problem 9, you determined the decimal number represented by the 8-bit integer $[10101101]_2$.
Generalize your solution to Problem 9 by creating a function num_from_bits that will return the decimal number represented by an 8-bit integer input. You may assume that the 8-bit integer is input as a list.
Test your function on the 8-bit integer $[10101101]_2$. Also test that your function returns the number of a famous U.S. highway when applied to $[01000010]_2$.
Challenge. Can you make your function work with bit vectors of arbitrary length?
def num_from_bits(n):
    """Return decimal representation of binary number."""
    val = 0
    for pos in range(len(n)):
        val += n[-1 - pos] * (2 ** pos)
    return val

# Test the function
n = [1, 0, 1, 0, 1, 1, 0, 1]
print(f'The decimal representation of {n}_2 is {num_from_bits(n)}.')

n = [0, 1, 0, 0, 0, 0, 1, 0]
print(f'The decimal representation of {n}_2 is {num_from_bits(n)}.')
The decimal representation of [1, 0, 1, 0, 1, 1, 0, 1]_2 is 173.
The decimal representation of [0, 1, 0, 0, 0, 0, 1, 0]_2 is 66.
Problem 11. Create a function bits_from_num that takes a decimal number as input and returns the binary representation of the number. Check that your answer returns the correct bit representation for each of the following input: 128, 255, 33, 18 and 0. Also check that if you run num_from_bits(bits_from_num(13)) you get the number 13 back again.
def bits_from_num(num):
    """Return binary representation of decimal number"""
    n = []
    for exp in range(8):
        if num >= 2 ** (7 - exp):
            n.append(1)
            num = num - 2 ** (7 - exp)
        else:
            n.append(0)
    return n

# Test the function
print(bits_from_num(128))
print(bits_from_num(255))
print(bits_from_num(33))
print(bits_from_num(18))
print(bits_from_num(0))
print(num_from_bits(bits_from_num(13)))
[1, 0, 0, 0, 0, 0, 0, 0]
[1, 1, 1, 1, 1, 1, 1, 1]
[0, 0, 1, 0, 0, 0, 0, 1]
[0, 0, 0, 1, 0, 0, 1, 0]
[0, 0, 0, 0, 0, 0, 0, 0]
13