
Focus of this talk
- Not Math
- Not Programming
- Problem Solving
- Under-utilized methods
- Showcase Ipython Notebooks
Background – What we do as a company
- Programmatic Advertising
- Custom ad campaigns for agencies and large companies
- Targeting Platform
- Hyper local geo targeting
- Cookie and cookieless user targeting
- Contextual and Performance based media targeting

Background – What does our system do
- Real Time Bidding with 12B-15B ad requests
- We want to serve several hundred million ads
- Data intelligence paltform
- Offline and online models to create scored lists
- Users
- Media
- Geography
- Time
- Auction theory
- Score every ad request
- Bidders execute on scores in under 50ms roundtrip
Background – What we do as data scientists
- Focus
- Machine learning
- Automation
- Scale
- Process
- Prototype examples
- Implement in production if possible
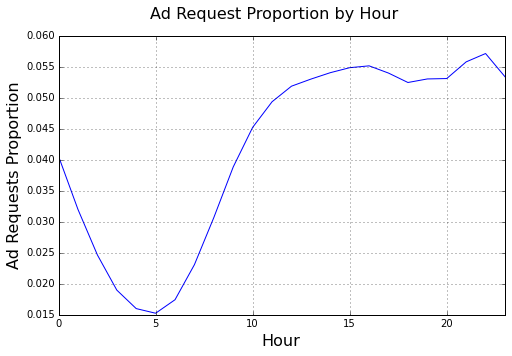
Background – The pacing problem
For each campaign we have a target for the number of ads to serve every minute. We would like to serve the best quality ads at every opportunity.
Why?
- Best time to influence people
- Always serve the best ads possible
- Smooth serving accross the day (hedging)
- To beat competition
Problem 1: How do I control the speed of ad serving?
PID Control
A proportional-integral-derivative controller is a control loop feedback mechanism.
- $SP$ : Set point (target you would like your process to hit)
- $PV$ : Process value (where your process currently is)
- $e$ : Error ($SP - PV$)
- $K_p$ : Proportional gain, a tuning parameter
- $K_i$ : Integral gain, a tuning parameter
- $K_d$ : Derivative gain, a tuning parameter
- $t$ : Time or instantaneous time (the present)
- $\tau$ : Variable of integration; takes on values from time 0 to the present
- $u(t)$ : PID Controller output at time $t$
PID Tuning
- PID loops are very sensitive to tuning the parameters
- Tuning parameters are also specific to each implementation
- Tuning is made easier through dimension reduction of parameter space via Ziegler-Nichols transformation
| $K_p$ | $K_i$ | $K_d$ | |
|---|---|---|---|
| PID | $0.6K_u$ | $2K_p/P_u$ | $K_pP_u/8$ |
import pandas as pd
from pandas import Series
import matplotlib.pyplot as plt
import numpy.random as rand
import numpy as np
%matplotlib inline
pd.set_option('display.width',200)

import time
from bokeh.plotting import *
from bokeh.objects import Glyph
from bokeh.objects import Range1d
output_notebook(url="default")
Using saved session configuration for http://localhost:5006/
To override, pass 'load_from_config=False' to Session
class PID:
    def __init__(self):
        self.Kp = 0
        self.Kd = 0
        self.Ki = 0
        self.Ku = 0
        self.Pu = 0
        self.previous_error = 0
        self.cumulative_error = 0

    def update_params(self):
        self.Kp = 0.6*self.Ku
        self.Ki = 2*0.2*self.Ku/self.Pu
        self.Kd = 0.6*self.Ku*self.Pu/8

    def set_zn_params(self,Ku, Pu):
        ''' Ziegler-Nichols Parameters '''
        self.Pu = Pu
        self.Ku = Ku
        self.update_params()

    def set_pid_params(self,Kp, Ki, Kd):
        self.Kp = Kp
        self.Kd = Ki
        self.Ki = Kd

    def step(self, error, time_delta):

        error_delta = error - self.previous_error

        self.p_contribution = self.Kp * error
        self.cumulative_error += error * time_delta
        self.i_contribution =  self.Ki * self.cumulative_error
        self.d_contribution = 0
        if time_delta > 0:
            self.d_contribution = self.Kd * error_delta/time_delta

        self.previous_error = error

        return self.p_contribution + self.i_contribution + self.d_contribution
def pid_plot(res):
    fig = plt.figure()
    ax = res.process_value.plot(figsize=(12,6), label = 'Process Value' )
    res.set_point.plot(secondary_y=False, style='y', label = 'Setpoint Target' )
    ax2 = res.controller_output.plot(secondary_y=True, style='r', label = 'Controller Output'  )

    ax.set_xlabel('Iteration', fontsize=16)
    ax.set_ylabel('Target Values', fontsize=16)
    ax2.set_ylabel('Controller Output', fontsize=16)

    handles, labels = ax.get_legend_handles_labels()
    handles2, labels2 = ax2.get_legend_handles_labels()

    handles.extend(handles2)
    labels.extend(labels2)

    ax.legend(handles, labels)
    plt.show()
def pid_stream_plot1(res):
    N = len(res.iteration)

    figure(tools="",
            title = 'PID Process',
            x_axis_label = 'Iteration',
            y_axis_label = 'Process Value',
            y_range=Range1d(start=0, end=15))

    hold()

    line(res.iteration,res.set_point, color="#DF7401", plot_width=800, plot_height=500, legend='Set Point')
    line(res.iteration[:1],res.process_value[:1], color="#013ADF", plot_width=800, plot_height=500, legend='Process Value')
    line(res.iteration[:1],res.controller_output[:1], color="#FF0000", plot_width=800, plot_height=500, legend='Controller Output')

    grid().grid_line_alpha=0.3

    renderer1 = [r for r in curplot().renderers if isinstance(r, Glyph)][1]
    ds1 = renderer1.data_source
    renderer2 = [r for r in curplot().renderers if isinstance(r, Glyph)][2]
    ds2 = renderer2.data_source

    #xaxis().axis_label='Iteration'
    #yaxis().axis_label='Values'
    show()

    for i in range(N):
        ds1.data["x"] = res.iteration[:i]
        ds1.data["y"] = res.process_value[:i]
        ds2.data["x"] = res.iteration[:i]
        ds2.data["y"] = res.controller_output[:i]
        ds1._dirty = True
        ds2._dirty = True
        cursession().store_objects(ds1)
        cursession().store_objects(ds2)
        time.sleep(0.01)
def run_pid(Ku = 0.2, Pu = 5):
    pid = PID()
    pid.set_zn_params(Ku, Pu)

    res = pd.DataFrame(columns=('iteration', 'set_point', 'process_value',
                             'controller_output', 'controller_change', 'error'))
    iteration = 0
    set_point = 5
    process_value = 0
    controller_output = 1
    controller_change = 0
    error = 0
    time_delta = 1

    row = pd.DataFrame([dict(iteration = iteration,
                             set_point = set_point,
                             process_value = process_value,
                             controller_output = controller_output,
                             controller_change = controller_change,
                             error = error)])
    res = res.append(row, ignore_index=True)

    for i in range(1, 250):
        process_value = 1.7*(controller_output + 1)
        error = set_point - process_value
        controller_change = pid.step(error,time_delta)
        controller_output += controller_change
        controller_output = min(max(controller_output,1),30)

        #arbitrary set_point changes
        if (i==50):
            set_point = 8
        if (i==100):
            set_point = 12
        if (i==150):
            set_point = 4

        row = pd.DataFrame([dict(iteration = i,
                                 set_point = set_point,
                                 process_value = process_value,
                                 error = error,
                                 controller_output = controller_output,
                                 controller_change = controller_change)])
        res = res.append(row, ignore_index=True)

    return res
PID Toy Example
res = run_pid(Ku = 0.2, Pu = 5)
pid_plot(res)
#pid_stream_plot1(res)

Some Lessons
- So this kind of works!
- Tuning is important
- Build in safeguards
Problem 2: But my process value is not nearly that smooth
We need some kind of time series smoothing.
Anything ARIMA or moving average based is a really bad idea:
- It's slow changing
- Has a built in lag
- Entirely backwards looking
- Offline Algorithm
What we really need is a Dynamic Linear Model$^1$
- Forward looking
- Online Algorithm
- Certainty estimates about current state
- Bayesian
$ $
$^1$ We run about 3B DLMs a day, pacing is only 4-5M of those
Kalman Filter
Kalman filter is a very basic DLM$^2$
The general problem is to estimate the state $x \in \mathbb{R}^n$ of a discrete-time controlled process that is governed by the linear stochastic difference equation:
$$ x_k = Ax_{k-1} + Bu_{k-1} + w_{k} $$with measurement $z \in \mathbb{R}^m$ that is
$$ z_k = Hx_k + v_k $$where $w_k$ and $v_k$ are the process and measurement noise with
$$ p(w) \backsim N(0,Q) $$$$ p(v) \backsim N(0,R) $$$A$ is $n \times n$ is the difference equation relating state $k$ to state $k-1$.
$B$ relates to the optional control input $u \in \mathbb{R}^l$ to state $x$.
$H$ is an $m \times n$ matrix in the measurement equation relating to the observed measurements $z_k$.
$ $
$^2$ (2006) Welch and Bishop - 'An Introduction to the Kalman Filter'
Kalman Filter continued
We can define $\hat{x}^-_k \in \mathbb{R}^n$ as a priori estimate a step $k$ given all our knowledge up to step $k$, and $\hat{x}_k \in \mathbb{R}^n$ is the a posteriori state estimate at step $k$ given measurement $z_k$.
Thus a priori and a posteriori errors are:
$$e^-_k \equiv x_k - \hat{x}^-_k $$$$e_k \equiv x_k - \hat{x}_k $$With covariances:
$$ P^-_k = E[e^-_ke^{-T}_k] \\ P_k = E[e_ke^{T}_k]$$We eventually end up with something called blending factor
$$K_k = P^-_kH^t(HP^-_kH^T+R)^{-1} $$So as the measurement error covariance $R$ approaches $0$, $K$ weights the process residual more heavily.
Conversely, as the a priori estimate error covariance $P^-_k$ approaches $0$, $K$ weights the process residual less heavily.
Kalman Filter Algorithm
Get initial estimates for $\hat{x}_k$ and $P_{k-1}$
Time update step (Predict)
Project the new state
$$\hat{x}^-_k = A \hat{x}_{k-1} + Bu_{k-1}$$Project the new error covariance
$$P^-_k=AP_{k-1}A^T+Q$$Measurement Update (Correct)
Compute blending factor
$$K_k = P^-_kH^T(HP^-_kH^T+R)^{-1}$$Update process estimate with new measurement
$$\hat{x}_k = \hat{x}^-_k + K_k(z_k-H\hat{x}^-_k)$$Update error covariance
$$P_k = (I-K_kH)P^-_k$$class KalmanFilter:
def __init__(self, x, A, B, P, Q, H, R):
self.x_aposteriori = x # Starting state
self.A = A # State transition matrix
self.B = B # Control matrix
self.covariance_aposteriori = P # Starting covariance
self.Q = Q # Process Error
self.H = H # Observation matrix
self.R = R # Measurement Error
def update(self, measurement, control = 0):
# Time update
x_apriori = self.A * self.x_aposteriori + self.B * control
covariance_apriori = self.A * self.covariance_aposteriori * self.A.T + self.Q
# Measurement Update
kalman_gain = covariance_apriori * self.H.T * np.linalg.inv((self.H * covariance_apriori * self.H.T + self.R))
self.x_aposteriori = x_apriori + kalman_gain * (measurement - self.H * x_apriori)
dimension = self.covariance_aposteriori.size
self.covariance_aposteriori = (np.eye(dimension) - kalman_gain * self.H) * covariance_apriori
def plot_kf(df):
    fig = plt.figure()
    ax = df.measurement.plot(figsize=(12,6), label = 'Measurement' )
    df.smoothed_measurement.plot(secondary_y=False, style='g', label = 'Smoothed Measurement' )

    ax.set_xlabel('Iteration', fontsize=16)
    ax.set_ylabel('Measured Values', fontsize=16)

    handles, labels = ax.get_legend_handles_labels()

    ax.legend(handles, labels)
    plt.show()

def kf_stream_plot1(df):
    N = len(df.iteration)

    figure(tools="",
            title = 'Kalman Filter Toy Example',
            x_axis_label = 'Iteration',
            x_range=Range1d(start=0, end=N),
            y_range=Range1d(start=0, end=df.measurement.max() + 1))

    hold()

    line(res.iteration[:1],df.measurement[:1], color="#013ADF", plot_width=800, plot_height=500, legend='Measurement Value')
    line(res.iteration[:1],df.smoothed_measurement[:1], color="#088A08", plot_width=800, plot_height=500, legend='Smoothed Measurement')

    grid().grid_line_alpha=0.3

    renderer1 = [r for r in curplot().renderers if isinstance(r, Glyph)][0]
    ds1 = renderer1.data_source
    renderer2 = [r for r in curplot().renderers if isinstance(r, Glyph)][1]
    ds2 = renderer2.data_source

    xaxis().axis_label='Iteration'
    yaxis().axis_label='Values'
    show()

    for i in range(N):
        ds1.data["x"] = df.iteration[:i]
        ds1.data["y"] = df.measurement[:i]
        ds2.data["x"] = df.iteration[:i]
        ds2.data["y"] = df.smoothed_measurement[:i]
        ds1._dirty = True
        ds2._dirty = True
        cursession().store_objects(ds1)
        cursession().store_objects(ds2)
        time.sleep(0.01)
Kalman Filter Toy Example
Create some noisy series which has a clear underlying mean that will never clearly be measured.
Generate $z \backsim \sum\limits^n I(Uniform(0,10)>5)$.
x = np.matrix(1)
A = np.matrix(1)
B = np.matrix(0)
P = np.matrix(1)
Q = np.matrix(0.05)
H = np.matrix(1)
R = np.matrix(2)

kf = KalmanFilter(x, A, B, P, Q, H, R)

df = pd.DataFrame(columns=('iteration','measurement','smoothed_measurement'))
smoothed_measurement = 0
measurement = 0

row = pd.DataFrame([dict(iteration = 0,
                         measurement = measurement,
                         smoothed_measurement = smoothed_measurement)])

df = df.append(row, ignore_index=True)
trials = 20

for i in range(1,100):
    measurement = 1*(np.random.uniform(0,10,trials)>5).sum()
    kf.update(measurement)
    smoothed_measurement = kf.x_aposteriori[(0,0)]
    row = pd.DataFrame([dict(iteration = i,
                             measurement = measurement,
                             smoothed_measurement = smoothed_measurement)])
    df = df.append(row, ignore_index=True)
    if i == 50:
        trials += 10

#plot_kf(df)
kf_stream_plot1(df)
Some more Lessons
- So this also kind of works!
- Tuning is also important
- We don't want a smooth filter
def pid_plot2(res):
    fig = plt.figure()
    ax = res.process_value.plot(figsize=(12,6), label = 'Process Value' )
    res.set_point.plot(secondary_y=False, style='y', label = 'Setpoint Target' )
    res.smoothed.plot(secondary_y=False, style='g', label = 'Smoothed Process Value' )
    ax2 = res.controller_output.plot(secondary_y=True, style='r', label = 'Controller Output'  )

    ax.set_xlabel('Iteration', fontsize=16)
    ax.set_ylabel('Target Values', fontsize=16)
    ax2.set_ylabel('Controller Output', fontsize=16)

    handles, labels = ax.get_legend_handles_labels()
    handles2, labels2 = ax2.get_legend_handles_labels()

    handles.extend(handles2)
    labels.extend(labels2)

    ax.legend(handles, labels)
    plt.show()

def pid_stream_plot2(res):
    N = len(res.iteration)

    figure(tools="pan,wheel_zoom,box_zoom,reset,previewsave",
            title = 'PID Process with noisy data',
            y_range = Range1d(start=0, end=res.controller_output.max()+1),
            x_axis_label = 'Iteration')

    hold()

    line(res.iteration,res.set_point, color="#DF7401", plot_width=800, plot_height=500, legend='Set Point')
    line(res.iteration[:1],res.process_value[:1], color="#013ADF", plot_width=800, plot_height=500, legend='Process Value')
    line(res.iteration[:1],res.controller_output[:1], color="#FF0000", plot_width=800, plot_height=500, legend='Controller Output')
    line(res.iteration[:1],res.smoothed[:1], color="#088A08", plot_width=800, plot_height=500, legend='Smoothed Process Value')

    grid().grid_line_alpha=0.3

    renderer1 = [r for r in curplot().renderers if isinstance(r, Glyph)][1]
    ds1 = renderer1.data_source
    renderer2 = [r for r in curplot().renderers if isinstance(r, Glyph)][2]
    ds2 = renderer2.data_source
    renderer3 = [r for r in curplot().renderers if isinstance(r, Glyph)][3]
    ds3 = renderer3.data_source

    xaxis().axis_label='Iteration'
    yaxis().axis_label='Values'
    show()

    for i in range(N):
        ds1.data["x"] = res.iteration[:i]
        ds1.data["y"] = res.process_value[:i]
        ds2.data["x"] = res.iteration[:i]
        ds2.data["y"] = res.controller_output[:i]
        ds3.data["x"] = res.iteration[:i]
        ds3.data["y"] = res.smoothed[:i]
        ds1._dirty = True
        ds2._dirty = True
        ds3._dirty = True
        cursession().store_objects(ds1)
        cursession().store_objects(ds2)
        cursession().store_objects(ds3)
        time.sleep(0.01)
Putting it together
def init_system(Ku = 0.3,Pu = 25):
    res = pd.DataFrame(columns=('iteration', 'set_point', 'process_value', 'smoothed',
                             'controller_output', 'controller_change', 'error'))
    iteration = 0
    set_point = 5
    process_value = 0
    controller_output = 1
    controller_change = 0
    error = 0
    smoothed = 0

    row = pd.DataFrame([dict(iteration = iteration,
                             set_point = set_point,
                             process_value = process_value,
                             smoothed = smoothed,
                             controller_output = controller_output,
                             controller_change = controller_change,
                             error = error)])
    res = res.append(row, ignore_index=True)

    #initialise PID
    pid = PID()
    pid.set_zn_params(Ku, Pu)

    #initialise Kalman Filter
    x = np.matrix(1)
    A = np.matrix(1)
    B = np.matrix(0)
    P = np.matrix(1)
    Q = np.matrix(0.5)
    H = np.matrix(1)
    R = np.matrix(10)
    kf = KalmanFilter(x, A, B, P, Q, H, R)

    return res, pid, kf
def exec_system(res, pid, kf):
    controller_output = res.controller_output[0]
    set_point = res.set_point[0]
    time_delta = 1
    for i in range(1, 250):
        process_value = 1*(rand.uniform(0,10,controller_output)>5).sum()
        kf.update(process_value)
        smoothed = kf.x_aposteriori[(0,0)]
        error = set_point - smoothed.item()
        controller_change = pid.step(error,time_delta)
        controller_output += controller_change
        controller_output = min(max(controller_output,1),30)

        #arbitrary set_point changes
        if (i==50):
            set_point = 8
        if (i==100):
            set_point = 12
        if (i==150):
            set_point = 4


        row = pd.DataFrame([dict(iteration = i,
                                 set_point = set_point,
                                 process_value = process_value,
                                 smoothed = smoothed,
                                 error = error,
                                 controller_output = controller_output,
                                 controller_change = controller_change)])
        res = res.append(row, ignore_index=True)

    return res
res, pid, kf = init_system(Ku = 0.3,Pu = 5)
res = exec_system(res, pid, kf)
pid_plot2(res)
#pid_stream_plot2(res)

Even more Lessons
- So this still also kind of works!
- Tuning is also important but all ad campaigns are different
- Movements of the PID controller output is not smooth
Particle Swarm Optimization
- Create a population (called a swarm) of candidate solutions (called particles).
- These particles are moved around in the search-space according to a few simple formulae.
- The movements of the particles are guided by their own best known position in the search-space as well as the entire swarm's best known position.
- When improved positions are being discovered these will then come to guide the movements of the swarm.
Naïve Particle Swarm Optimization
- Pick a safe starting point (the system has to start somewhere)
- After each iteration spawn $k$ new particles around the previous used particle
- Validate retroactively which particle would have performed the best in the last iteration
- Update used particle to be the optimal back tested particle
def pid_neighbours(pid, w):

    # create neighbouring PIDs
    pidKminus = copy(pid)
    pidKminus.set_params(max(pid.Ku*(1-w),ku_floor), pid.Pu)

    pidKplus = copy(pid)
    pidKplus.set_params(min(pid.Ku*(1+w),ku_ceiling), pid.Pu)

    pidPminus = copy(pid)
    pidPminus.set_params(pid.Ku, max(pid.Pu*(1-w), pu_floor))

    pidPplus = copy(pid)
    pidPplus.set_params(pid.Ku, min(pid.Pu*(1+w), pu_ceiling))

    return pidKminus, pidKplus, pidPminus, pidPplus
df3 = pd.read_csv('test_dat.csv')

pacing_all = pd.DataFrame(columns=('thour','tmin','imps'))
for i in range(7,23):
    for j in range(2,58):
        impressions = df3[(df3.thour==i) & (df3.tminute==j)]['dirretargetingflag'].notnull().sum()
        row = pd.DataFrame([dict(thour = i,tmin = j,imps = impressions), ])
        pacing_all = pacing_all.append(row, ignore_index=True)

def score_plot(df3):
    plt.figure()
    ax = df3['final_score'].hist(bins=100, range = (0,10),figsize=(12,6))
    ax.set_xlabel('Score', fontsize=16)
    ax.set_ylabel('Available ads', fontsize=16)
    handles, labels = ax.get_legend_handles_labels()

def ts_plot(pacing_all):
    plt.figure()
    ax = pacing_all.imps.plot(figsize=(12,6), label = 'Ads Available')
    ax.set_xlabel('Minute', fontsize=16)
    ax.set_ylabel('Available ads', fontsize=16)
    handles, labels = ax.get_legend_handles_labels()
So let's try some real data
Skew and variable score distributions
score_plot(df3)

Highly volatile stream of ad requests
ts_plot(pacing_all)

Finally a realistic simulation
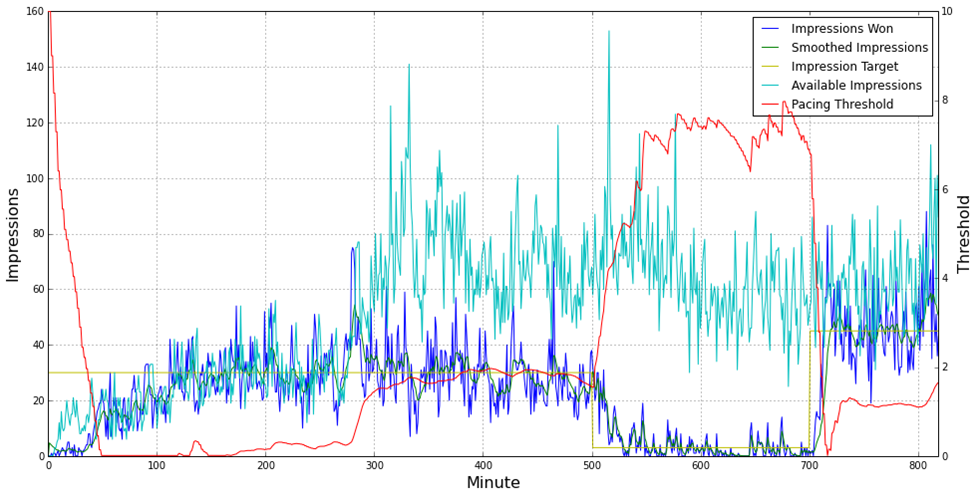
With self-tuning PID paramaters

Business Should Shape the Algorithm and its Learning
- Self-tuning systems can work well
- System specific safeguards are needed
- Slow servers causing data delays
- Raising and lowering threshold values are not symmetric business decisions
- Start carefully
- Check for bad behaviour
- Monitor systems
Our production system
