Exploring data on COVID-19
In this notebook we will explore and analyse some data on the advance of the COVID-19 pandemic. The goal is to produce a plot like this:
Shift-enter to evaluate a cell
$y = x^2$
url = "https://raw.githubusercontent.com/CSSEGISandData/COVID-19/master/csse_covid_19_data/csse_covid_19_time_series/time_series_covid19_confirmed_global.csv"
"https://raw.githubusercontent.com/CSSEGISandData/COVID-19/master/csse_covid_19_data/csse_covid_19_time_series/time_series_covid19_confirmed_global.csv"
url
"https://raw.githubusercontent.com/CSSEGISandData/COVID-19/master/csse_covid_19_data/csse_covid_19_time_series/time_series_covid19_confirmed_global.csv"
typeof(url)
String
x = 3
3
typeof(x)
Int64
x * x
9
url * url
"https://raw.githubusercontent.com/CSSEGISandData/COVID-19/master/csse_covid_19_data/csse_covid_19_time_series/time_series_covid19_confirmed_global.csvhttps://raw.githubusercontent.com/CSSEGISandData/COVID-19/master/csse_covid_19_data/csse_covid_19_time_series/time_series_covid19_confirmed_global.csv"
*
* (generic function with 357 methods)
methods(*); # remove `;` to see the output
(1 + 2im) * (3 + im)
1 + 7im
@which (1 + 2im) * (3 + im)
url
"https://raw.githubusercontent.com/CSSEGISandData/COVID-19/master/csse_covid_19_data/csse_covid_19_time_series/time_series_covid19_confirmed_global.csv"
Grab the data
download(url, "covid_data.csv")
"covid_data.csv"
readdir
readdir (generic function with 2 methods)
readdir()
3-element Array{String,1}:
 ".ipynb_checkpoints"
 "01 - Exploring COVID-19 data.ipynb"
 "covid_data.csv"
Install a package ONCE in our current Julia installation:
using Pkg   # built-in package manager in Julia: Pkg
Pkg.add("CSV")   # calls the `add` function from the module Pkg.  This installs a package
Updating registry at `~/.julia/registries/General`
Updating git-repo `https://github.com/JuliaRegistries/General.git`
Fetching: [======================> ] [1mFetching: [========================================>] 100.0 %
  Resolving package versions...
  Installed OpenSSL_jll ─ v1.1.1+2
######################################################################### 100.0%##O#- #
   Updating `~/.julia/environments/v1.4/Project.toml`
 [no changes]
   Updating `~/.julia/environments/v1.4/Manifest.toml`
  [458c3c95] ↑ OpenSSL_jll v1.1.1+1 ⇒ v1.1.1+2
Load a package every time we run a Julia session:
using CSV # Comma Separated Values
CSV.read("covid_data.csv") # run the function `read` from the package CSV
| Province/State | Country/Region | Lat | Long | 1/22/20 | |
|---|---|---|---|---|---|
| String⍰ | String | Float64 | Float64 | Int64 | |
| 1 | missing | Afghanistan | 33.0 | 65.0 | 0 |
| 2 | missing | Albania | 41.1533 | 20.1683 | 0 |
| 3 | missing | Algeria | 28.0339 | 1.6596 | 0 |
| 4 | missing | Andorra | 42.5063 | 1.5218 | 0 |
| 5 | missing | Angola | -11.2027 | 17.8739 | 0 |
| 6 | missing | Antigua and Barbuda | 17.0608 | -61.7964 | 0 |
| 7 | missing | Argentina | -38.4161 | -63.6167 | 0 |
| 8 | missing | Armenia | 40.0691 | 45.0382 | 0 |
| 9 | Australian Capital Territory | Australia | -35.4735 | 149.012 | 0 |
| 10 | New South Wales | Australia | -33.8688 | 151.209 | 0 |
| 11 | Northern Territory | Australia | -12.4634 | 130.846 | 0 |
| 12 | Queensland | Australia | -28.0167 | 153.4 | 0 |
| 13 | South Australia | Australia | -34.9285 | 138.601 | 0 |
| 14 | Tasmania | Australia | -41.4545 | 145.971 | 0 |
| 15 | Victoria | Australia | -37.8136 | 144.963 | 0 |
| 16 | Western Australia | Australia | -31.9505 | 115.861 | 0 |
| 17 | missing | Austria | 47.5162 | 14.5501 | 0 |
| 18 | missing | Azerbaijan | 40.1431 | 47.5769 | 0 |
| 19 | missing | Bahamas | 25.0343 | -77.3963 | 0 |
| 20 | missing | Bahrain | 26.0275 | 50.55 | 0 |
| 21 | missing | Bangladesh | 23.685 | 90.3563 | 0 |
| 22 | missing | Barbados | 13.1939 | -59.5432 | 0 |
| 23 | missing | Belarus | 53.7098 | 27.9534 | 0 |
| 24 | missing | Belgium | 50.8333 | 4.0 | 0 |
| 25 | missing | Benin | 9.3077 | 2.3158 | 0 |
| 26 | missing | Bhutan | 27.5142 | 90.4336 | 0 |
| 27 | missing | Bolivia | -16.2902 | -63.5887 | 0 |
| 28 | missing | Bosnia and Herzegovina | 43.9159 | 17.6791 | 0 |
| 29 | missing | Brazil | -14.235 | -51.9253 | 0 |
| 30 | missing | Brunei | 4.5353 | 114.728 | 0 |
| ⋮ | ⋮ | ⋮ | ⋮ | ⋮ | ⋮ |
data = CSV.read("covid_data.csv");
data
| Province/State | Country/Region | Lat | Long | 1/22/20 | |
|---|---|---|---|---|---|
| String⍰ | String | Float64 | Float64 | Int64 | |
| 1 | missing | Afghanistan | 33.0 | 65.0 | 0 |
| 2 | missing | Albania | 41.1533 | 20.1683 | 0 |
| 3 | missing | Algeria | 28.0339 | 1.6596 | 0 |
| 4 | missing | Andorra | 42.5063 | 1.5218 | 0 |
| 5 | missing | Angola | -11.2027 | 17.8739 | 0 |
| 6 | missing | Antigua and Barbuda | 17.0608 | -61.7964 | 0 |
| 7 | missing | Argentina | -38.4161 | -63.6167 | 0 |
| 8 | missing | Armenia | 40.0691 | 45.0382 | 0 |
| 9 | Australian Capital Territory | Australia | -35.4735 | 149.012 | 0 |
| 10 | New South Wales | Australia | -33.8688 | 151.209 | 0 |
| 11 | Northern Territory | Australia | -12.4634 | 130.846 | 0 |
| 12 | Queensland | Australia | -28.0167 | 153.4 | 0 |
| 13 | South Australia | Australia | -34.9285 | 138.601 | 0 |
| 14 | Tasmania | Australia | -41.4545 | 145.971 | 0 |
| 15 | Victoria | Australia | -37.8136 | 144.963 | 0 |
| 16 | Western Australia | Australia | -31.9505 | 115.861 | 0 |
| 17 | missing | Austria | 47.5162 | 14.5501 | 0 |
| 18 | missing | Azerbaijan | 40.1431 | 47.5769 | 0 |
| 19 | missing | Bahamas | 25.0343 | -77.3963 | 0 |
| 20 | missing | Bahrain | 26.0275 | 50.55 | 0 |
| 21 | missing | Bangladesh | 23.685 | 90.3563 | 0 |
| 22 | missing | Barbados | 13.1939 | -59.5432 | 0 |
| 23 | missing | Belarus | 53.7098 | 27.9534 | 0 |
| 24 | missing | Belgium | 50.8333 | 4.0 | 0 |
| 25 | missing | Benin | 9.3077 | 2.3158 | 0 |
| 26 | missing | Bhutan | 27.5142 | 90.4336 | 0 |
| 27 | missing | Bolivia | -16.2902 | -63.5887 | 0 |
| 28 | missing | Bosnia and Herzegovina | 43.9159 | 17.6791 | 0 |
| 29 | missing | Brazil | -14.235 | -51.9253 | 0 |
| 30 | missing | Brunei | 4.5353 | 114.728 | 0 |
| ⋮ | ⋮ | ⋮ | ⋮ | ⋮ | ⋮ |
typeof(data)
DataFrames.DataFrame
using DataFrames
data_2 = rename(data, 1 => "province", 2 => "country")
| province | country | Lat | Long | 1/22/20 | |
|---|---|---|---|---|---|
| String⍰ | String | Float64 | Float64 | Int64 | |
| 1 | missing | Afghanistan | 33.0 | 65.0 | 0 |
| 2 | missing | Albania | 41.1533 | 20.1683 | 0 |
| 3 | missing | Algeria | 28.0339 | 1.6596 | 0 |
| 4 | missing | Andorra | 42.5063 | 1.5218 | 0 |
| 5 | missing | Angola | -11.2027 | 17.8739 | 0 |
| 6 | missing | Antigua and Barbuda | 17.0608 | -61.7964 | 0 |
| 7 | missing | Argentina | -38.4161 | -63.6167 | 0 |
| 8 | missing | Armenia | 40.0691 | 45.0382 | 0 |
| 9 | Australian Capital Territory | Australia | -35.4735 | 149.012 | 0 |
| 10 | New South Wales | Australia | -33.8688 | 151.209 | 0 |
| 11 | Northern Territory | Australia | -12.4634 | 130.846 | 0 |
| 12 | Queensland | Australia | -28.0167 | 153.4 | 0 |
| 13 | South Australia | Australia | -34.9285 | 138.601 | 0 |
| 14 | Tasmania | Australia | -41.4545 | 145.971 | 0 |
| 15 | Victoria | Australia | -37.8136 | 144.963 | 0 |
| 16 | Western Australia | Australia | -31.9505 | 115.861 | 0 |
| 17 | missing | Austria | 47.5162 | 14.5501 | 0 |
| 18 | missing | Azerbaijan | 40.1431 | 47.5769 | 0 |
| 19 | missing | Bahamas | 25.0343 | -77.3963 | 0 |
| 20 | missing | Bahrain | 26.0275 | 50.55 | 0 |
| 21 | missing | Bangladesh | 23.685 | 90.3563 | 0 |
| 22 | missing | Barbados | 13.1939 | -59.5432 | 0 |
| 23 | missing | Belarus | 53.7098 | 27.9534 | 0 |
| 24 | missing | Belgium | 50.8333 | 4.0 | 0 |
| 25 | missing | Benin | 9.3077 | 2.3158 | 0 |
| 26 | missing | Bhutan | 27.5142 | 90.4336 | 0 |
| 27 | missing | Bolivia | -16.2902 | -63.5887 | 0 |
| 28 | missing | Bosnia and Herzegovina | 43.9159 | 17.6791 | 0 |
| 29 | missing | Brazil | -14.235 | -51.9253 | 0 |
| 30 | missing | Brunei | 4.5353 | 114.728 | 0 |
| ⋮ | ⋮ | ⋮ | ⋮ | ⋮ | ⋮ |
rename!(data, 1 => "province", 2 => "country") # ! is convention: function *modifies* its argument in place
| province | country | Lat | Long | 1/22/20 | |
|---|---|---|---|---|---|
| String⍰ | String | Float64 | Float64 | Int64 | |
| 1 | missing | Afghanistan | 33.0 | 65.0 | 0 |
| 2 | missing | Albania | 41.1533 | 20.1683 | 0 |
| 3 | missing | Algeria | 28.0339 | 1.6596 | 0 |
| 4 | missing | Andorra | 42.5063 | 1.5218 | 0 |
| 5 | missing | Angola | -11.2027 | 17.8739 | 0 |
| 6 | missing | Antigua and Barbuda | 17.0608 | -61.7964 | 0 |
| 7 | missing | Argentina | -38.4161 | -63.6167 | 0 |
| 8 | missing | Armenia | 40.0691 | 45.0382 | 0 |
| 9 | Australian Capital Territory | Australia | -35.4735 | 149.012 | 0 |
| 10 | New South Wales | Australia | -33.8688 | 151.209 | 0 |
| 11 | Northern Territory | Australia | -12.4634 | 130.846 | 0 |
| 12 | Queensland | Australia | -28.0167 | 153.4 | 0 |
| 13 | South Australia | Australia | -34.9285 | 138.601 | 0 |
| 14 | Tasmania | Australia | -41.4545 | 145.971 | 0 |
| 15 | Victoria | Australia | -37.8136 | 144.963 | 0 |
| 16 | Western Australia | Australia | -31.9505 | 115.861 | 0 |
| 17 | missing | Austria | 47.5162 | 14.5501 | 0 |
| 18 | missing | Azerbaijan | 40.1431 | 47.5769 | 0 |
| 19 | missing | Bahamas | 25.0343 | -77.3963 | 0 |
| 20 | missing | Bahrain | 26.0275 | 50.55 | 0 |
| 21 | missing | Bangladesh | 23.685 | 90.3563 | 0 |
| 22 | missing | Barbados | 13.1939 | -59.5432 | 0 |
| 23 | missing | Belarus | 53.7098 | 27.9534 | 0 |
| 24 | missing | Belgium | 50.8333 | 4.0 | 0 |
| 25 | missing | Benin | 9.3077 | 2.3158 | 0 |
| 26 | missing | Bhutan | 27.5142 | 90.4336 | 0 |
| 27 | missing | Bolivia | -16.2902 | -63.5887 | 0 |
| 28 | missing | Bosnia and Herzegovina | 43.9159 | 17.6791 | 0 |
| 29 | missing | Brazil | -14.235 | -51.9253 | 0 |
| 30 | missing | Brunei | 4.5353 | 114.728 | 0 |
| ⋮ | ⋮ | ⋮ | ⋮ | ⋮ | ⋮ |
data
| province | country | Lat | Long | 1/22/20 | |
|---|---|---|---|---|---|
| String⍰ | String | Float64 | Float64 | Int64 | |
| 1 | missing | Afghanistan | 33.0 | 65.0 | 0 |
| 2 | missing | Albania | 41.1533 | 20.1683 | 0 |
| 3 | missing | Algeria | 28.0339 | 1.6596 | 0 |
| 4 | missing | Andorra | 42.5063 | 1.5218 | 0 |
| 5 | missing | Angola | -11.2027 | 17.8739 | 0 |
| 6 | missing | Antigua and Barbuda | 17.0608 | -61.7964 | 0 |
| 7 | missing | Argentina | -38.4161 | -63.6167 | 0 |
| 8 | missing | Armenia | 40.0691 | 45.0382 | 0 |
| 9 | Australian Capital Territory | Australia | -35.4735 | 149.012 | 0 |
| 10 | New South Wales | Australia | -33.8688 | 151.209 | 0 |
| 11 | Northern Territory | Australia | -12.4634 | 130.846 | 0 |
| 12 | Queensland | Australia | -28.0167 | 153.4 | 0 |
| 13 | South Australia | Australia | -34.9285 | 138.601 | 0 |
| 14 | Tasmania | Australia | -41.4545 | 145.971 | 0 |
| 15 | Victoria | Australia | -37.8136 | 144.963 | 0 |
| 16 | Western Australia | Australia | -31.9505 | 115.861 | 0 |
| 17 | missing | Austria | 47.5162 | 14.5501 | 0 |
| 18 | missing | Azerbaijan | 40.1431 | 47.5769 | 0 |
| 19 | missing | Bahamas | 25.0343 | -77.3963 | 0 |
| 20 | missing | Bahrain | 26.0275 | 50.55 | 0 |
| 21 | missing | Bangladesh | 23.685 | 90.3563 | 0 |
| 22 | missing | Barbados | 13.1939 | -59.5432 | 0 |
| 23 | missing | Belarus | 53.7098 | 27.9534 | 0 |
| 24 | missing | Belgium | 50.8333 | 4.0 | 0 |
| 25 | missing | Benin | 9.3077 | 2.3158 | 0 |
| 26 | missing | Bhutan | 27.5142 | 90.4336 | 0 |
| 27 | missing | Bolivia | -16.2902 | -63.5887 | 0 |
| 28 | missing | Bosnia and Herzegovina | 43.9159 | 17.6791 | 0 |
| 29 | missing | Brazil | -14.235 | -51.9253 | 0 |
| 30 | missing | Brunei | 4.5353 | 114.728 | 0 |
| ⋮ | ⋮ | ⋮ | ⋮ | ⋮ | ⋮ |
DataFrames.rename!(...)
Ctrl-M, Y to switch to code cell
Ctrl-M, M to switch to markdown
Esc instead of Ctrl-M
Interact.jl: Simple interactive visualizations
using Interact
Unable to load WebIO. Please make sure WebIO works for your Jupyter client. For troubleshooting, please see the WebIO/IJulia documentation.
for i in 1:10
    @show i
end
i = 1
i = 2
i = 3
i = 4
i = 5
i = 6
i = 7
i = 8
i = 9
i = 10
typeof(1:10)
UnitRange{Int64}
collect(1:10)
10-element Array{Int64,1}:
  1
  2
  3
  4
  5
  6
  7
  8
  9
 10
for i in 1:10
    println("i = ", i)
end
i = 1
i = 2
i = 3
i = 4
i = 5
i = 6
i = 7
i = 8
i = 9
i = 10
for i in 1:10
    @show i
end
i = 1
i = 2
i = 3
i = 4
i = 5
i = 6
i = 7
i = 8
i = 9
i = 10
for i in 1:10
    i
end
@manipulate for i in 1:10
    HTML(i^2)
end
countries = data[2:5, 2]
4-element Array{String,1}:
 "Albania"
 "Algeria"
 "Andorra"
 "Angola"
countries = data[1:end, 2]
253-element Array{String,1}:
 "Afghanistan"
 "Albania"
 "Algeria"
 "Andorra"
 "Angola"
 "Antigua and Barbuda"
 "Argentina"
 "Armenia"
 "Australia"
 "Australia"
 "Australia"
 "Australia"
 "Australia"
 ⋮
 "West Bank and Gaza"
 "Guinea-Bissau"
 "Mali"
 "Saint Kitts and Nevis"
 "Canada"
 "Canada"
 "Kosovo"
 "Burma"
 "United Kingdom"
 "United Kingdom"
 "United Kingdom"
 "MS Zaandam"
countries = collect(data[:, 2])
253-element Array{String,1}:
 "Afghanistan"
 "Albania"
 "Algeria"
 "Andorra"
 "Angola"
 "Antigua and Barbuda"
 "Argentina"
 "Armenia"
 "Australia"
 "Australia"
 "Australia"
 "Australia"
 "Australia"
 ⋮
 "West Bank and Gaza"
 "Guinea-Bissau"
 "Mali"
 "Saint Kitts and Nevis"
 "Canada"
 "Canada"
 "Kosovo"
 "Burma"
 "United Kingdom"
 "United Kingdom"
 "United Kingdom"
 "MS Zaandam"
unique_countries = unique(countries)
177-element Array{String,1}:
 "Afghanistan"
 "Albania"
 "Algeria"
 "Andorra"
 "Angola"
 "Antigua and Barbuda"
 "Argentina"
 "Armenia"
 "Australia"
 "Austria"
 "Azerbaijan"
 "Bahamas"
 "Bahrain"
 ⋮
 "Syria"
 "Timor-Leste"
 "Belize"
 "Laos"
 "Libya"
 "West Bank and Gaza"
 "Guinea-Bissau"
 "Mali"
 "Saint Kitts and Nevis"
 "Kosovo"
 "Burma"
 "MS Zaandam"
@manipulate for i in 1:length(countries)
    countries[i]
end
Julia has 1-based indexing: indices of vectors start at 1, not 0
@manipulate for i in 1:length(countries)
    data[i, 1:15]
end
Extract data and plot
startswith("United", "U")
true
startswith("David", "U")
false
Array comprehension:
U_countries = [startswith(country, "U") for country in countries];
data[U_countries, :]
| province | country | Lat | Long | 1/22/20 | 1/23/20 | |
|---|---|---|---|---|---|---|
| String⍰ | String | Float64 | Float64 | Int64 | Int64 | |
| 1 | missing | Uganda | 1.0 | 32.0 | 0 | 0 |
| 2 | missing | Ukraine | 48.3794 | 31.1656 | 0 | 0 |
| 3 | missing | United Arab Emirates | 24.0 | 54.0 | 0 | 0 |
| 4 | Bermuda | United Kingdom | 32.3078 | -64.7505 | 0 | 0 |
| 5 | Cayman Islands | United Kingdom | 19.3133 | -81.2546 | 0 | 0 |
| 6 | Channel Islands | United Kingdom | 49.3723 | -2.3644 | 0 | 0 |
| 7 | Gibraltar | United Kingdom | 36.1408 | -5.3536 | 0 | 0 |
| 8 | Isle of Man | United Kingdom | 54.2361 | -4.5481 | 0 | 0 |
| 9 | Montserrat | United Kingdom | 16.7425 | -62.1874 | 0 | 0 |
| 10 | missing | United Kingdom | 55.3781 | -3.436 | 0 | 0 |
| 11 | missing | Uruguay | -32.5228 | -55.7658 | 0 | 0 |
| 12 | missing | US | 37.0902 | -95.7129 | 1 | 1 |
| 13 | missing | Uzbekistan | 41.3775 | 64.5853 | 0 | 0 |
| 14 | Anguilla | United Kingdom | 18.2206 | -63.0686 | 0 | 0 |
| 15 | British Virgin Islands | United Kingdom | 18.4207 | -64.64 | 0 | 0 |
| 16 | Turks and Caicos Islands | United Kingdom | 21.694 | -71.7979 | 0 | 0 |
countries == "US"
false
countries .== "US"
# . is "broadcasting": apply operation to each element of a vector
253-element BitArray{1}:
 0
 0
 0
 0
 0
 0
 0
 0
 0
 0
 0
 0
 0
 ⋮
 0
 0
 0
 0
 0
 0
 0
 0
 0
 0
 0
 0
US_row = findfirst(countries .== "US")
226
US_data_row = data[US_row, :]
DataFrameRow (72 columns)
| province | country | Lat | Long | 1/22/20 | 1/23/20 | 1/24/20 | 1/25/20 | 1/26/20 | |
|---|---|---|---|---|---|---|---|---|---|
| String⍰ | String | Float64 | Float64 | Int64 | Int64 | Int64 | Int64 | Int64 | |
| 226 | missing | US | 37.0902 | -95.7129 | 1 | 1 | 2 | 2 | 5 |
US_data = convert(Vector, US_data_row[5:end])
68-element Array{Int64,1}:
      1
      1
      2
      2
      5
      5
      5
      5
      5
      7
      8
      8
     11
      ⋮
   7783
  13677
  19100
  25489
  33276
  43847
  53740
  65778
  83836
 101657
 121478
 140886
using Plots
┌ Info: Precompiling Plots [91a5bcdd-55d7-5caf-9e0b-520d859cae80]
└ @ Base loading.jl:1260
plot(US_data)
col_names = names(data)
72-element Array{Symbol,1}:
 :province
 :country
 :Lat
 :Long
 Symbol("1/22/20")
 Symbol("1/23/20")
 Symbol("1/24/20")
 Symbol("1/25/20")
 Symbol("1/26/20")
 Symbol("1/27/20")
 Symbol("1/28/20")
 Symbol("1/29/20")
 Symbol("1/30/20")
 ⋮
 Symbol("3/18/20")
 Symbol("3/19/20")
 Symbol("3/20/20")
 Symbol("3/21/20")
 Symbol("3/22/20")
 Symbol("3/23/20")
 Symbol("3/24/20")
 Symbol("3/25/20")
 Symbol("3/26/20")
 Symbol("3/27/20")
 Symbol("3/28/20")
 Symbol("3/29/20")
date_strings = String.(names(data))[5:end]; # apply String function to each element
Parse: convert string representation into a Julia object:
date_strings[1]
"1/22/20"
using Dates
format = Dates.DateFormat("d/m/Y")
dateformat"d/m/Y"
parse(Date, date_strings[1], format)
ArgumentError: Month: 22 out of range (1:12)

Stacktrace:
 [1] Date(::Int64, ::Int64, ::Int64) at /Users/julia/buildbot/worker/package_macos64/build/usr/share/julia/stdlib/v1.4/Dates/src/types.jl:223
 [2] parse(::Type{Date}, ::String, ::DateFormat{Symbol("d/m/Y"),Tuple{Dates.DatePart{'d'},Dates.Delim{Char,1},Dates.DatePart{'m'},Dates.Delim{Char,1},Dates.DatePart{'Y'}}}) at /Users/julia/buildbot/worker/package_macos64/build/usr/share/julia/stdlib/v1.4/Dates/src/parse.jl:285
 [3] top-level scope at In[95]:1
format = Dates.DateFormat("m/d/Y")
dateformat"m/d/Y"
parse(Date, date_strings[1], format) + Year(2000)
2020-01-22
dates = parse.(Date, date_strings, format) .+ Year(2000)
68-element Array{Date,1}:
 2020-01-22
 2020-01-23
 2020-01-24
 2020-01-25
 2020-01-26
 2020-01-27
 2020-01-28
 2020-01-29
 2020-01-30
 2020-01-31
 2020-02-01
 2020-02-02
 2020-02-03
 ⋮
 2020-03-18
 2020-03-19
 2020-03-20
 2020-03-21
 2020-03-22
 2020-03-23
 2020-03-24
 2020-03-25
 2020-03-26
 2020-03-27
 2020-03-28
 2020-03-29
plot(dates, US_data, xticks=dates[1:5:end], xrotation=45, leg=:topleft,
    label="US data", m=:o)

xlabel!("date")
ylabel!("confirmed cases in US")
title!("US confirmed COVID-19 cases")

# annotate!(20, US_data[end], text("US", :blue, :left))
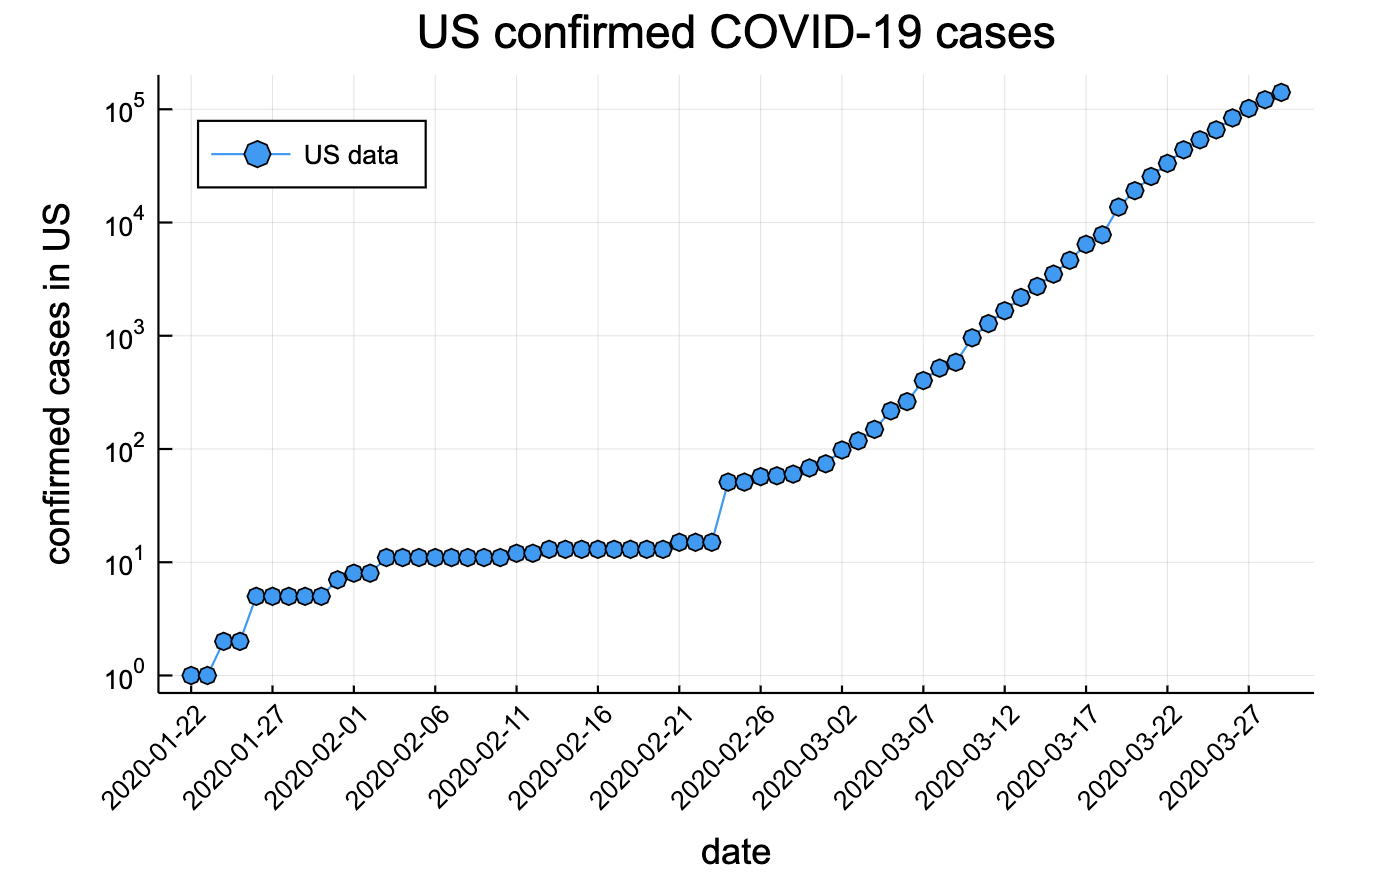
plot(dates, US_data, xticks=dates[1:5:end], xrotation=45, leg=:topleft,
    label="US data", m=:o,
    yscale=:log10)

xlabel!("date")
ylabel!("confirmed cases in US")
title!("US confirmed COVID-19 cases")

# annotate!(20, US_data[end], text("US", :blue, :left))
Straight line on semi-log scale means exponential growth!
function f(country)
    return country * country
end
f (generic function with 1 method)
f("US")
"USUS"
plot! add new curve onto the same graph