Codecademy Portfolio Project: "OKCupid Date-A-Scientist"
Project Author: Alexander Lacson
Project Description
In this project, I will work with data from OKCupid, an online dating app. This dataset was provided to me by Codecademy as part of their "Data Science Career Path". In this project I seek to accomplish the following:
- Visualize and explore OKCupid user data.
"Who uses OKCupid? What do people usually share on their profiles? How do people describe themselves?" - Use Machine Learning to predict gender.
"If a user's gender was kept hidden, can the other pieces of information be used to correctly predict the gender? If yes, what information was most important for making the prediction?" - Use Unsupervised Machine Learning to create a simple dating recommendation algorithm.
"Can we recommend who you should date?"
Disclaimer: This data is from mid 2011 to 2012
Visualization
Who uses OKCupid?
Numerical Features


Categorical Features


The charts tell us that the typical profile on OKCupid back in 2012 was:
- not fat or skinny
- has drinks socially
- doesn't do drugs
- finished college
- white ethnicity
- varied in terms of possible job background
- doesn't have kids
- straight
- male
- doesn't smoke
- single
- lives in San Francisco, California
- eats anything
- agnostic or atheist
- likes dogs and/or cats but doesn't have them
- not multiracial
- speaks only one language
It's possible that people misrepresent themselves on their profile, paint themselves more positively, and carefully omit negative information.

Everyone speaks English. Hilariously some people speak C++... why not Python?

Disclaimer: My comments below are pure speculation and hypothesis
| Feature | Hypothesis For Not Sharing Information |
|---|---|
| Income | If you're rich you don't want the IRS to know. If you're poor, you don't want potential matches to see that either |
| Children | Finding out someone has kids can be a turn off and perceived as extra baggage |
| Diet | People are afraid of being criticized for choosing to shun some foods |
| Religion | Some people are xenophobic. As a result, some people hide their religion so as not to immediately turn away those xenophobes |
| Pets | No idea why a third of users don't share this information |
| Essays | There's a pattern where the higher up the chart you go, the higher the essay number. This is because the questions are presented to the user in a fixed order. Not all users have the patience to answer questions all the way to the last one. The reason why essay 8 stands out significantly more than the rest is because the question being asked is "Share something private", which of course is rather controversial considering you can't take back what you share online. See below section for the essay questions. |
| Drugs | Drugs are illegal in some states |
Essay Responses


| Essay Number | Personal best guess of the question asked | Comment on tf-idf Result |
|---|---|---|
| essay 0 | Describe yourself | Users use this essay question to talk about what they like, love, and the qualities of who(someone) they're looking for |
| essay 1 | What are you currently doing? | A lot of the smaller words are clear answers to the question while the biggest words are a little bit more difficult to interpret or could be weighted to have a lower score |
| essay 2 | What are you good at? | Users say they're good at listening and that they have a great smile and laugh |
| essay 3 | Describe yourself physically | Users talk about their eyes, hair, smile, and height |
| essay 4 | What are your favorite books, movies, tv shows, music, food, etc | Not a very meaningful result. More useful for guessing the essay question. |
| essay 5 | You can't live without... | Users cannot live without their cellphone, money, gym, job, god, sports, fun. Not sure though what it means that 'good' is top keyword |
| essay 6 | What do you think about? | Users think about life and the future |
| essay 7 | What is a typical friday night for you? | Users are with their friends on friday nights |
| essay 8 | Share something private | Users say 'message/ask me about private things and ill share it with you, but I won't share it here on my public profile'. From the previous section, we can also see that this is the least answered essay question. |
| essay 9 | You would like me if... | Doesn't seem like a very meaningful result |
Date Recommendation using K-Means Clustering
"Can we recommend who you should date?"
Clustering, is a technique which groups similar data points together. Let's use this to group similar people together and recommend who you should date. People in the same cluster as you are the people who we will recommend.
Feature Selection
Which, among the features, would you want your date to have in common with you?
After asking someone which features they would want to have in common with them, the chosen features are:
- Drugs
- Diet
- Pets
- Orientation
- Religion (attitude only)
Choosing a value of k

k = 100 is where the linearity begins. Let's create the model we will use for clustering with k = 100.

Date Match Recommendations (only interactive if opened with Jupyter Notebooks and required packages are installed)
Let's discover who you can date! Select from the dropdown lists to enter your information. Click the 'Run Interact' button to predict your cluster number and display the profile of a potential date. Your cluster contains users that are similar to you - someone you might want to date! Click Run to see another random profile from your cluster.
- Note that as an experiment, null values have been included as their own category. The model groups people who similarly leave a lot of fields blank. The values of 'nan' or 'None' or 'No Prefix' means that you are not sharing information for that particular field. Go ahead and try out 'nan' and see how that affects your matches.


Date Recommendation using K-Means Clustering Recap
In this section, we accomplished the following:
- Selected features for our model, on the basis of wanting a potential date to be similar for those particular features
- Used the 'elbow method' for selecting a value of k for our k-means clustering model
- Created an interactive interface for presenting profiles of suggested users to date based on input user data
Predictive Models with Supervised Machine Learning
"If a user's gender was kept hidden, can the other pieces of information be used to correctly predict the gender? If yes, what information was most important for making the prediction?"
Block Diagram of Model Tuning and Evaluation
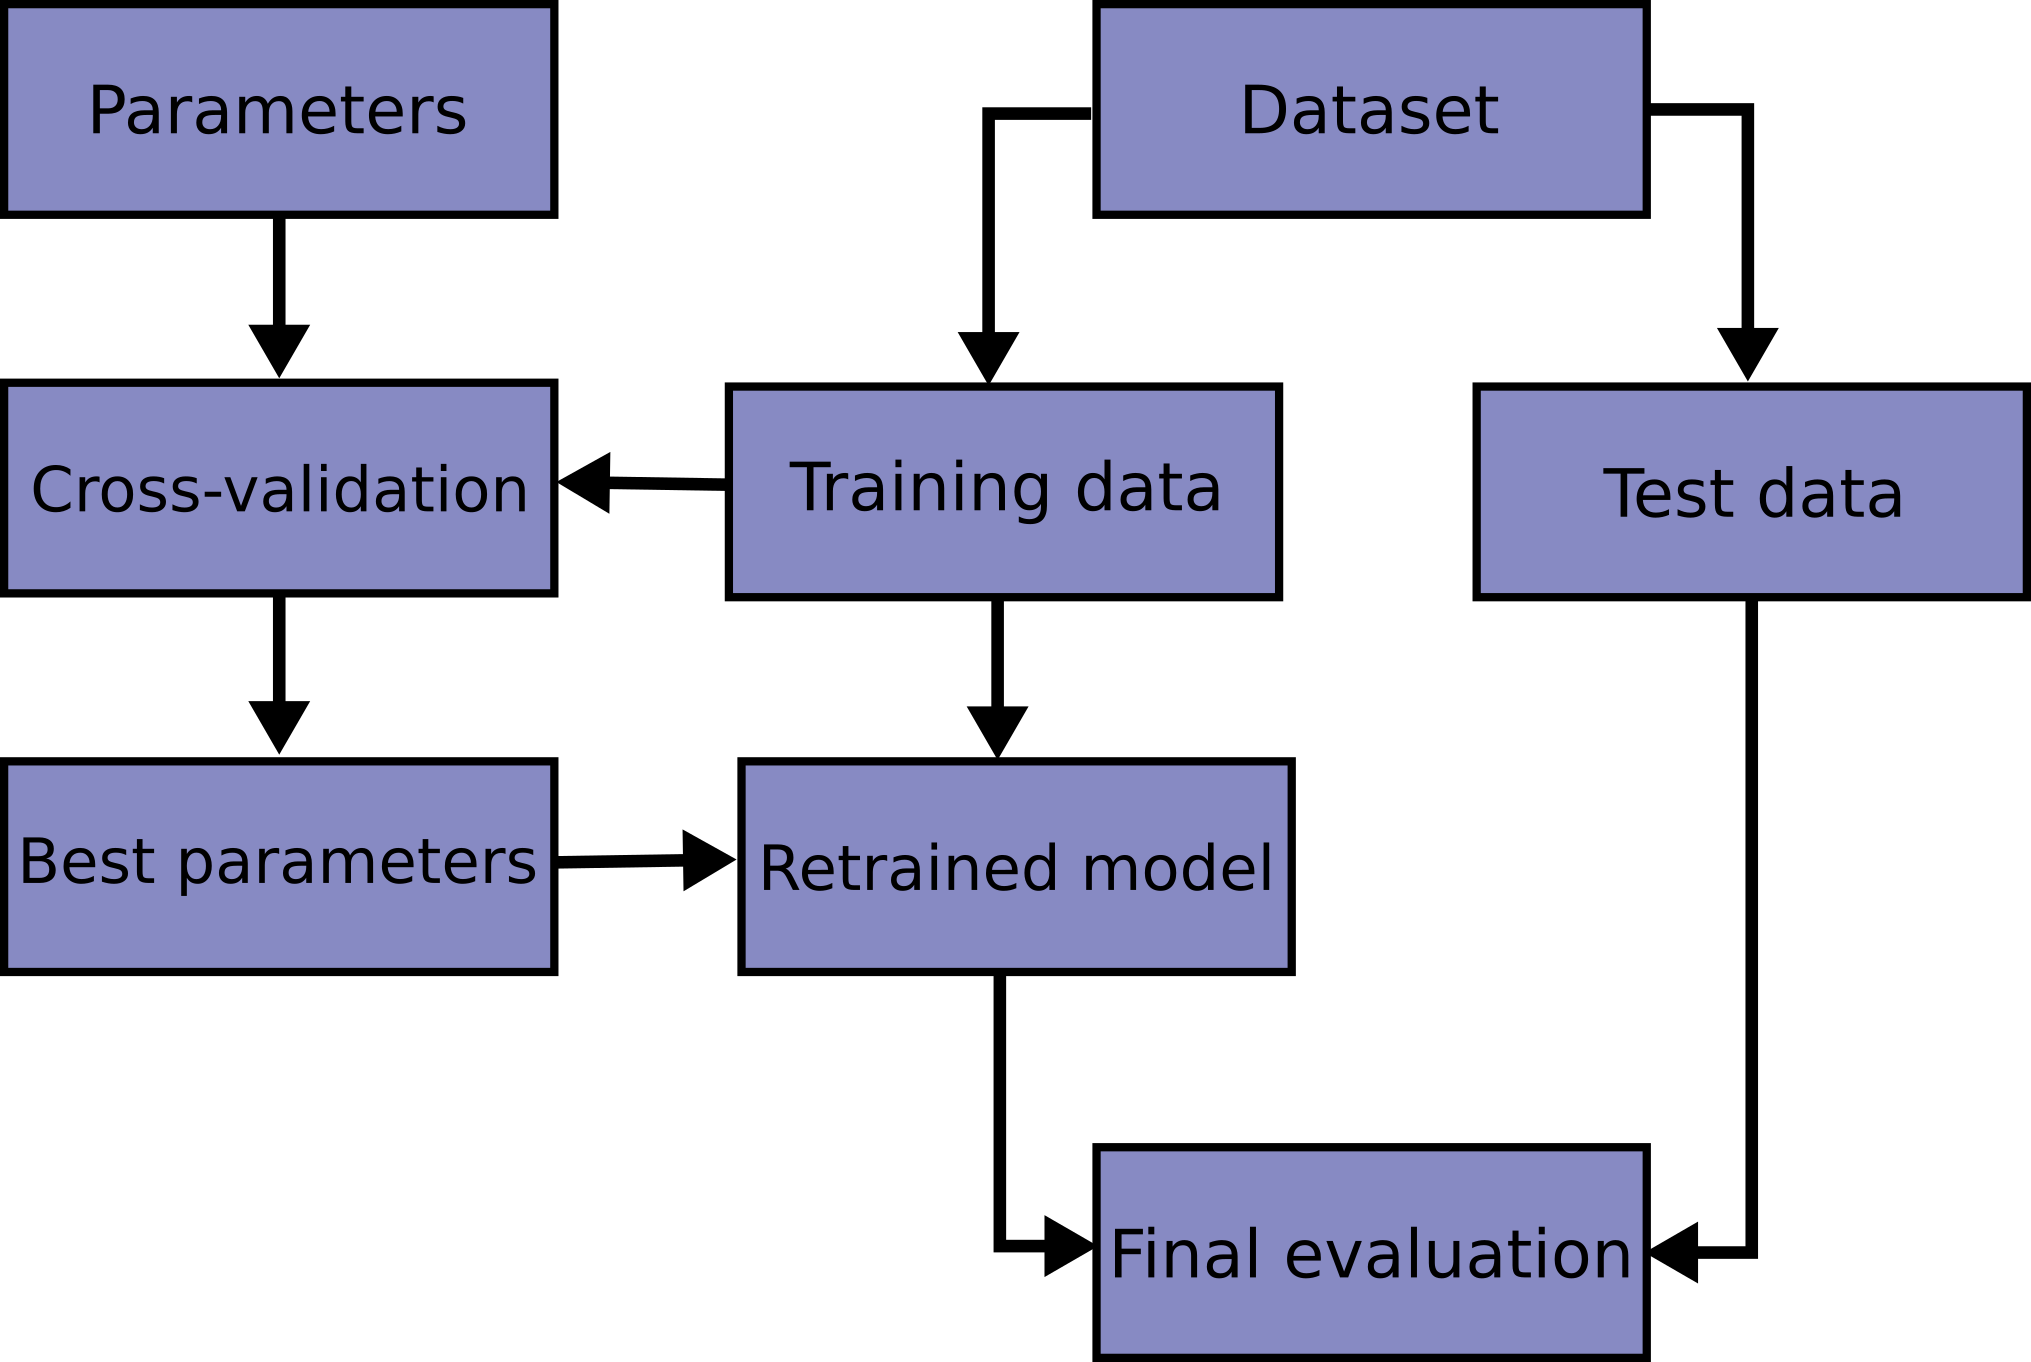
Parameter Tuning
Logistic Regression

Decision Tree

Random Forest

Parameter Tuning Results
| Model | Parameter | Best Value |
|---|---|---|
| Logistic Regression | C (Regularization Strength) | 1 |
| Decision Tree | Max Depth | 7 |
| Random Forest | Max Depth | 39 |
| Random Forest | N Estimators | 300 |
Model Evaluation and Comparison

| actual_Female | actual_Male | Model | |
|---|---|---|---|
| pred_Female | 85.586149 | 8.369368 | LogisticRegression |
| pred_Male | 14.413851 | 91.630632 | LogisticRegression |
| pred_Female | 80.767626 | 9.024969 | DecisionTreeClassifier |
| pred_Male | 19.232374 | 90.975031 | DecisionTreeClassifier |
| pred_Female | 83.166458 | 7.783512 | RandomForestClassifier |
| pred_Male | 16.833542 | 92.216488 | RandomForestClassifier |

In all cases the models perform better at classifying males than females. In the best case, the logistic regression model, men are classified 6.77% times better than women. A consequence of either training on a male-skewed dataset or not having enough reliable features that allow the model to confidently classify women (or both).
This is not without consequence in the real world. I recommend the Netflix documentary "Coded Bias". In the documentary, during a senate hearing, Alexandra Ocasio-Cortez questions Joy Buolamwini. Here is a selected excerpt:
AOC: "What demographic is it [AI models] mostly effective on?"
JB: "White Men"
AOC: "And who are the primary engineers and designers of these algorithms?"
JB: "Definitely white men"
Despite the oral exchange above, it's possible to make a biased AI model without being a "white man". You could be an ML engineer who failed to properly evaluate the performance of your model at identifying all class labels. This issue has already entered the mainstream social and political spheres.
Examination of Predictor Weights and Importances


For all models, height and body_type_curvy are our top predictors. Probably because men are taller than women on average, and because men are not likely to describe themselves as curvy whereas women are. It is interesting to see that after the top two predictors, there is a different order of feature importances for the random forest compared to the other models.
With Logistic Regression we can conveniently see which features were more useful for predicting class (male or female) because we have negative and positive weight coefficients, unlike with the Random Forest and Decision Tree. We can see that the model has more confidence in its male predictors than in its female predictors.
Next Steps
Although not presented here, most likely because the age distribution is skewed towards the young, the model is more effective at classifying young people than old people. The way to alleviate this is to apply a power transform to the age distribution, which makes it more like a normal distribution, before training (you will also have to apply the same transform to the test set before predicting). We will then have to evaluate the model's performance with young vs old subsets of our data.
Model evaluation can still be taken steps further. In scikit learn there is an example of applying frequentist and bayesian statistical approaches to more definitively make model comparisons.
Now that you know how to evaluate a model, the challenge is to learn how to improve model performance. Not just in general, but to be fair at identifying all classes. You will rarely ever have a dataset that is perfectly balanced.