Membuat fungsi Sinus
Fungsi sinus dapat dibuat menggunakan Library Numpy, sbb:
In [31]:
import numpy as np
import matplotlib.pyplot as plt
import math
t = np.arange(0,100)*0.02
d = np.zeros(100)
d = np.sin(2 * math.pi * t)
plt.plot(t,d)
plt.show()

Fungsi Gauss
Buatlah gambar something like in this wikipedia:

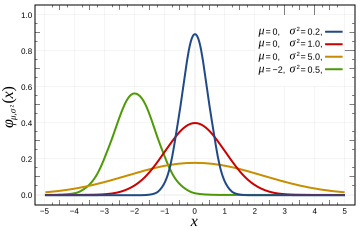
Fungsi Gauss didefinisikan sebagai:
$g(x)=\frac{1}{\sigma \sqrt{2 \pi}}\exp (-\frac{1}{2} (\frac{x-\mu}{\sigma})^2) $
In [52]:
def gaussian(x, mu, sig):
    return 1./(sig*math.sqrt(2*math.pi))*np.exp(-np.power(x - mu, 2.) / (2 * np.power(sig, 2.)))
In [61]:
x_values = np.linspace(-5, 5, 120)
for mu, sig in [(0, 0.44721), (0, 1), (0, 2.23607),(-2,0.5)]:
    plt.plot(x_values, gaussian(x_values, mu, sig))
plt.xlabel('x')
plt.show()

In [59]:
math.sqrt(5)
Out[59]:
2.23606797749979
In [ ]: