In [1]:
{-# LANGUAGE TypeOperators #-}
import Prelude ()
import qualified Prelude
import Data.Manifold.TreeCover
import Data.Manifold.Web
import Data.Random
import Data.Random.Manifold
import Data.Manifold.Types
import Math.LinearMap.Category
import Linear(V2(..))
import Data.VectorSpace
import Data.Semigroup
import qualified Data.List.NonEmpty as NE
import Data.Foldable (toList)
import Control.Monad (replicateM)

import Control.Category.Constrained.Prelude
import Control.Arrow.Constrained
:opt no-lint  -- lint gives bogus warnings with constrained-categories
From dynamic-plot:
In [2]:
import Graphics.Dynamic.Plot.R2 -- hiding (plotWindow)
-- plotWindow _ = return ()
import Diagrams.Prelude ((^&), (&), r2, white, opacity, fc)

plotPoints :: [ℝ²] -> DynamicPlottable
plotPoints ps = plot [p|±|[0.01^&0, 0^&0.01] | p<-ps]

viewShadeCombination :: [Shade' ℝ²] -> [DynamicPlottable]
viewShadeCombination [] = []
viewShadeCombination shs' = [ plot . sconcat $ ellipsoid<$>shs
                            , plot (mixShade's shs) & tweakPrerendered (opacity 0.3 . fc white) ]
 where shs = NE.fromList shs'
In [3]:
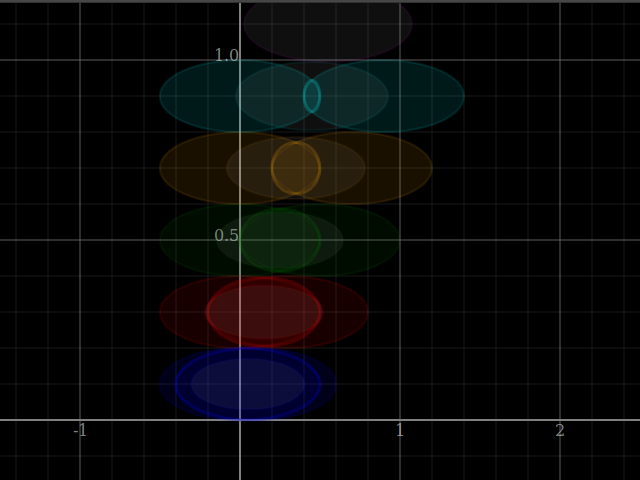
plotWindow $ [plot $ viewShadeCombination [V2 0 y|±|[V2 0.5 0, V2 0 0.1], V2 y y|±|[V2 0.5 0,V2 0 0.1]]
| y <- [0.1,0.3 .. 1.5] ]
++ (plot<$>[xInterval (-1,2), yInterval (0,1)])
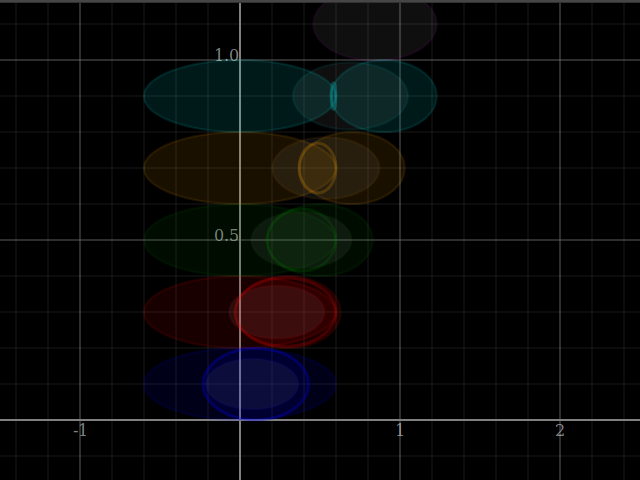
plotWindow $ [plot $ viewShadeCombination [V2 0 y|±|[V2 0.6 0,V2 0 0.1], V2 y y|±|[V2 0.33 0,V2 0 0.1]]
| y <- [0.1,0.3 .. 1.5] ]
++ (plot<$>[xInterval (-1,2), yInterval (0,1)])
GraphWindowSpecR2{lBound=-1.5, rBound=2.4999999999999996, bBound=-0.1666666666666666, tBound=1.1666666666666665, xResolution=640, yResolution=480}
GraphWindowSpecR2{lBound=-1.5000000000000002, rBound=2.5, bBound=-0.16666666666666663, tBound=1.1666666666666665, xResolution=640, yResolution=480}
In [4]:
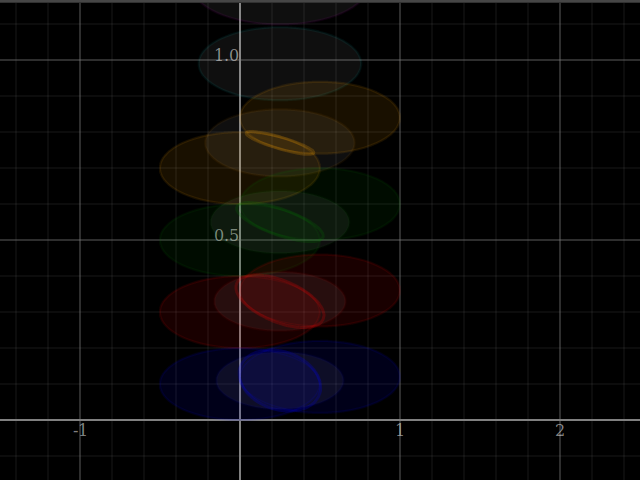
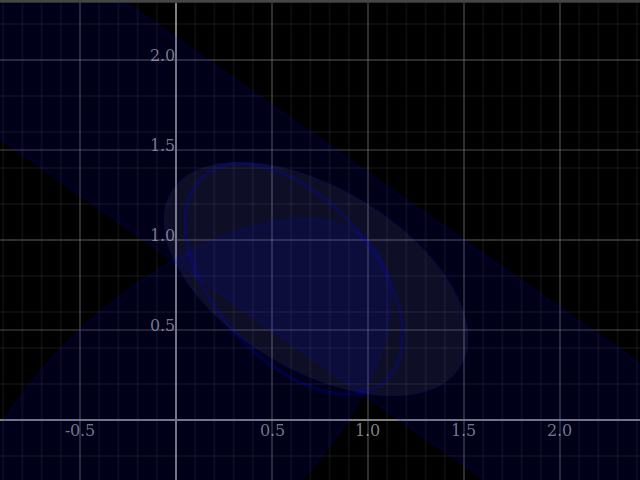
plotWindow $ [plot $ viewShadeCombination [V2 0 y|±|[V2 0.5 0,V2 0 0.1], V2 0.5 (1.2*y)|±|[V2 0.5 0,V2 0 0.1]]
             | y <- [0.1,0.3 .. 1.5] ]
          ++ (plot<$>[xInterval (-1,2), yInterval (0,1)])
GraphWindowSpecR2{lBound=-1.5000000000000004, rBound=2.5000000000000004, bBound=-0.16666666666666669, tBound=1.166666666666667, xResolution=640, yResolution=480}
In [5]:
plotWindow $ [plot $ viewShadeCombination [V2 0 0|±|[V2 0.5 (-0.5)], V2 2 0|±|[V2 0.3 0.4]]]
          ++ (plot<$>[xInterval (-0.5,2), yInterval (0,2)])
GraphWindowSpecR2{lBound=-0.9166666666666667, rBound=2.416666666666666, bBound=-0.33333333333333326, tBound=2.333333333333333, xResolution=640, yResolution=480}
In [6]:
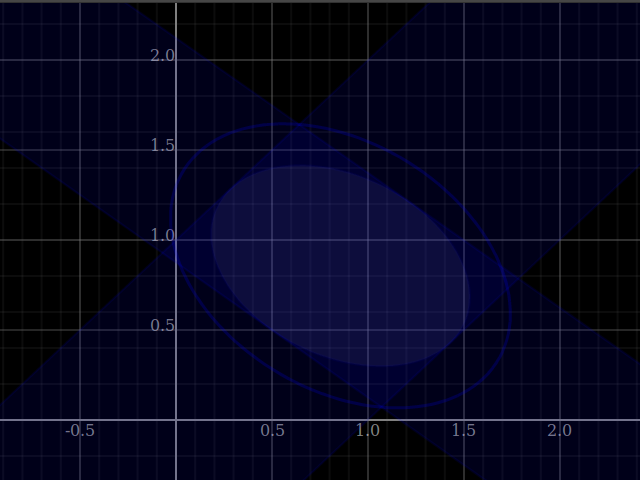
plotWindow $ [plot $ viewShadeCombination [V2 0 0|±|[V2 0.5 (-0.5), V2 1 1], V2 2 0|±|[V2 0.3 0.4]]]
          ++ (plot<$>[xInterval (-0.5,2), yInterval (0,2)])
GraphWindowSpecR2{lBound=-0.9166666666666667, rBound=2.416666666666666, bBound=-0.33333333333333326, tBound=2.3333333333333335, xResolution=640, yResolution=480}
In [7]:
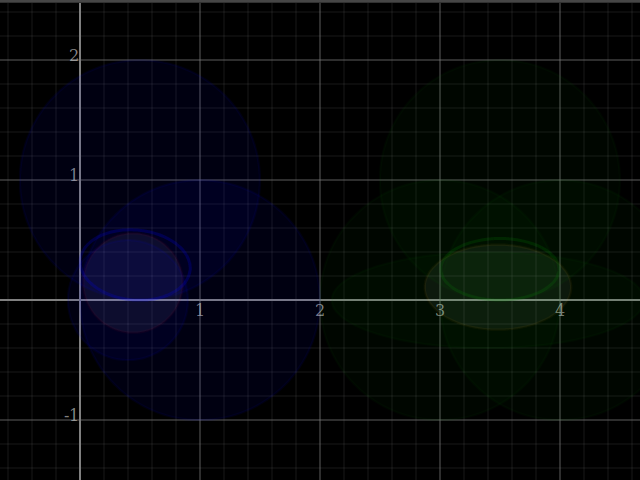
plotWindow $ [ plot $ viewShadeCombination [V2 1 0|±|[V2 1 0, V2 0 3], V2 0 0|±|[V2 (-0.3) 0.4]]
             , plot $ viewShadeCombination [V2 4 0|±|[V2 (-0.3) 0.4], V2 5 0|±|[V2 1 0, V2 0 3]] ]
          ++ (plot<$>[xInterval (0,6), yInterval (-1.5,2.5)])
GraphWindowSpecR2{lBound=-1.0, rBound=6.999999999999999, bBound=-2.1666666666666665, tBound=3.166666666666666, xResolution=640, yResolution=480}
In [8]:
plotWindow $ viewShadeCombination [ V2 0   0|±|[V2 1 0,V2 0 1]
                                  , V2 0.4 0|±|[V2 0.5 0,V2 0 0.5]
                                  , V2 1   0|±|[V2 1 0,V2 0 1]
                                  , V2 0.5 1|±|[V2 1 0,V2 0 1] ]
          ++ viewShadeCombination [ V2 3   0|±|[V2 1 0,V2 0 1]
                                  , V2 3.4 0|±|[V2 1.3 0,V2 0 0.4]
                                  , V2 4   0|±|[V2 1 0,V2 0 1]
                                  , V2 3.5 1|±|[V2 1 0,V2 0 1] ]
          ++ (plot<$>[xInterval (0,4), yInterval (-1,2)])
GraphWindowSpecR2{lBound=-0.6666666666666664, rBound=4.666666666666668, bBound=-1.5, tBound=2.5, xResolution=640, yResolution=480}
In [10]:
convolveShade' (0|±|[1]) (0|±|[1]) :: Shade' ℝ
Shade' {_shade'Ctr = 0.0, _shade'Narrowness = spanNorm [0.5000000000000002]}
In [11]:
convolveShade' ((0,0)|±|[(1,0),(0,1)]) ((0,0)|±|[(99,0),(0,99)]) :: Shade' (ℝ,ℝ)
Shade' {_shade'Ctr = (0.0,0.0), _shade'Narrowness = spanNorm [(9.999999999983312e-3,0.0),(0.0,9.999999999983312e-3)]}
In [12]:
convoTests :: [[Shade' (ℝ,ℝ)]]
convoTests = [ [ (0,6) |±| [(4,0),(0,2)]
               , (9,4) |±| [(4,0),(0,2)] ]
             , [ (8,0) |±| [(4,0),(0,1)]
               , (0,8) |±| [(1,0),(0,4)] ]
             , [ (9,0) |±| [(2  ,2) ,(0.1,2.5)]
               , (0,8) |±| [(0.5,-0.1),(1,3)] ]
             , [ (8,0) |±| [(1  ,-0.7)]
               , (0,8) |±| [(0.7,-0.2),(2.7 ,2  )] ]
             , [ (2,6) |±| [(4,0),(0,4)]
               , (9,0) |±| [(1,0),(0,0.1)] ] ]
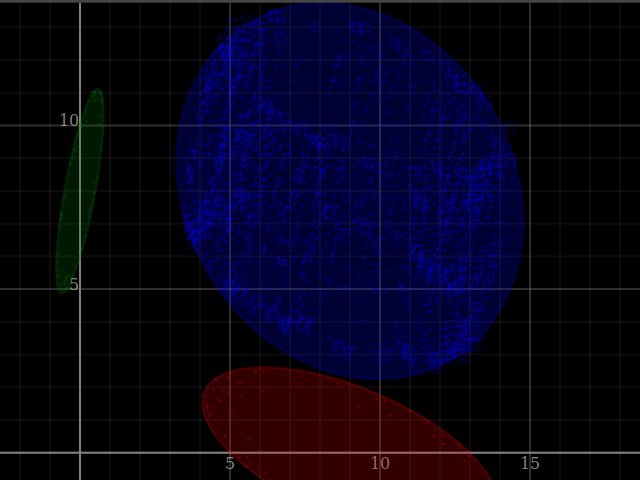
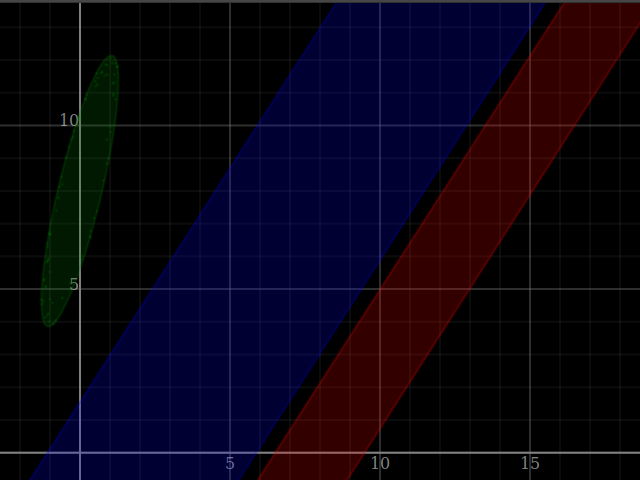
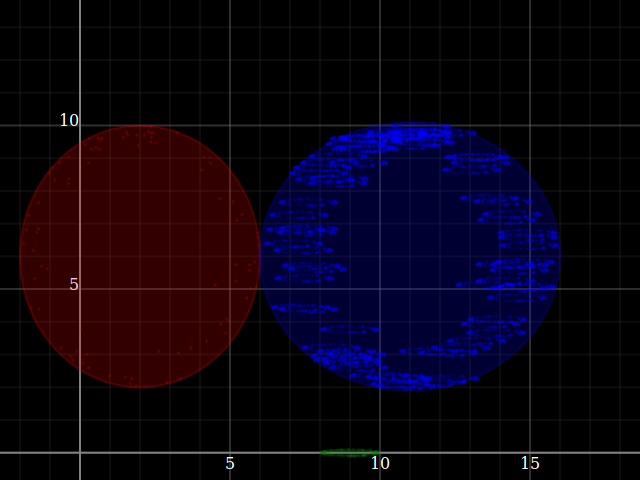
In [13]:
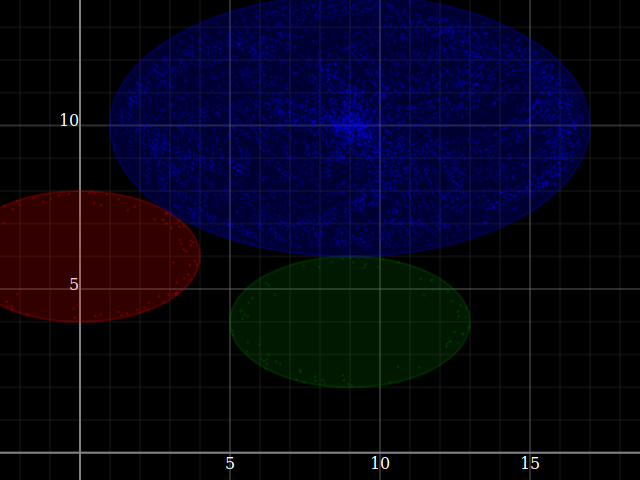
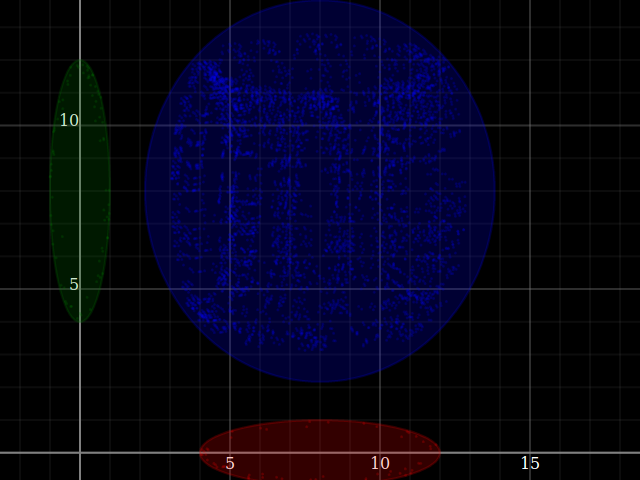
forM_ convoTests $ \wings -> do
  let convo = convolveShade' (wings!!0) (wings!!1)

  testPts <- runRVar (forM wings $ \sh@(Shade' cs es) ->
    fmap (filter $ \p -> occlusion sh p > exp(-1))
     . replicateM 150 $ do
        φ <- uniform 0 (2*pi)
        r <- normal 1 0.1
        let [v₁,v₂] = normSpanningSystem' es
        return $ cs ^+^ (r*cos φ)*^v₁ ^+^ (r*sin φ)*^v₂
   ) StdRandom  :: IO [[(ℝ,ℝ)]]

  plotWindow $ [ plot [plot sh, plotPoints $ r2 <$> tps]
               | (sh,tps) <- zip (convo:wings) ([a^+^b | a<-testPts!!0, b<-testPts!!1] : testPts)]
            ++ (plot<$>[xInterval (0,16), yInterval (1,12)])
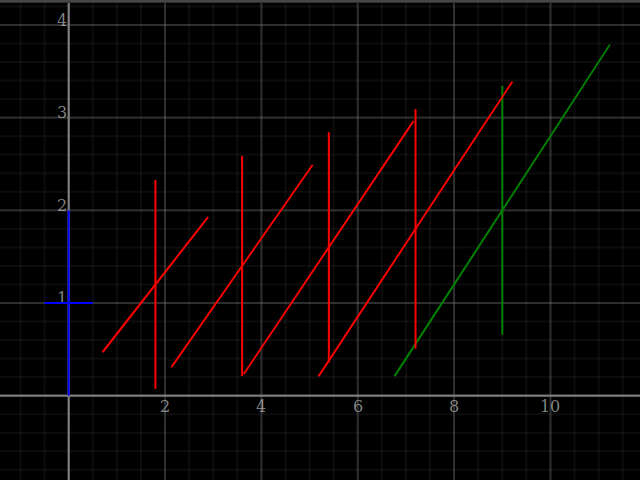
In [14]:
import Data.Manifold.Riemannian

interpolate₀, interpolate₁ :: Shade (ℝ,ℝ)
interpolate₀ = (0,1):±[(0.5,0),(0,1)]
interpolate₁ = (9,2):±[(2,1),(1,2)]

Just interpolation = geodesicBetween interpolate₀ interpolate₁

plotWindow [ plot interpolate₀
           , plot [ plot $ interpolation (D¹ x)
                  | x <- [-0.6, -0.2 .. 0.6] ]
           , plot interpolate₁]
GraphWindowSpecR2{lBound=-2.456011329583298, rBound=13.192079307083088, bBound=-0.9969665083072043, tBound=4.983644332615075, xResolution=640, yResolution=480}
In [15]:
interpolate₀, interpolate₁ :: Shade (ℝ,ℝ)
interpolate₀ = (0,1):±[(0.5,-0.5)]
interpolate₁ = (9,2):±[(2,1),(1,2)]

Just interpolation = geodesicBetween interpolate₀ interpolate₁

plotWindow [ plot interpolate₀
           , plot [ plot $ interpolation (D¹ x)
                  | x <- [-0.6, -0.2 .. 0.6] ]
           , plot interpolate₁]
GraphWindowSpecR2{lBound=-2.4560113295832986, rBound=13.192079307083088, bBound=-0.9814239699997196, tBound=4.981423969999719, xResolution=640, yResolution=480}
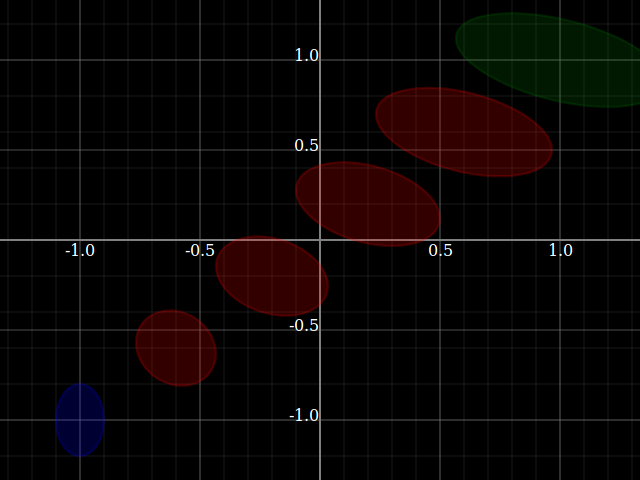
In [16]:
interpolate₀', interpolate₁' :: Shade' (ℝ,ℝ)
interpolate₀' = (-1,-1)|±|[(0.1,0),(0,0.2)]
interpolate₁' = (1,1)  |±|[(0.1,0.2),(-0.3,0.3)]

Just interpolation' = geodesicBetween interpolate₀' interpolate₁'

plotWindow [ plot interpolate₀'
           , plot [ plot $ interpolation' (D¹ x)
                  | x <- [-0.6, -0.2 .. 0.6] ]
           , plot interpolate₁']
GraphWindowSpecR2{lBound=-1.3333333333333328, rBound=1.3333333333333328, bBound=-1.3333333333333328, tBound=1.3333333333333328, xResolution=640, yResolution=480}
In [17]:
let pss = [[(-1)^&0, (-1)^&0.1, 0^&0, 0^&(0.1), 1^&0.2, 1^&ye :: ℝ²] | ye <- [0.3,0.31..]]
 in plotWindow [plotLatest [[plotPoints ps, plotLatest (pointsCover's ps :: [Shade' ℝ²])] | ps<-pss]]
GraphWindowSpecR2{lBound=-1.333333333333333, rBound=1.333333333333333, bBound=-1.333333333333333, tBound=1.333333333333333, xResolution=640, yResolution=480}
In [ ]: