Cross-validation for parameter tuning, model selection, and feature selection (video #7)
Created by Data School. Watch all 10 videos on YouTube. Download the notebooks from GitHub.
Note: This notebook uses Python 3.9.1 and scikit-learn 0.23.2. The original notebook (shown in the video) used Python 2.7 and scikit-learn 0.16.
Agenda
- What is the drawback of using the train/test split procedure for model evaluation?
- How does K-fold cross-validation overcome this limitation?
- How can cross-validation be used for selecting tuning parameters, choosing between models, and selecting features?
- What are some possible improvements to cross-validation?
Review of model evaluation procedures
Motivation: Need a way to choose between Machine Learning models
- Goal is to estimate likely performance of a model on out-of-sample data
Initial idea: Train and test on the same data
- But, maximizing training accuracy rewards overly complex models which overfit the training data
Alternative idea: Train/test split
- Split the dataset into two pieces, so that the model can be trained and tested on different data
- Testing accuracy is a better estimate than training accuracy of out-of-sample performance
- But, it provides a high variance estimate since changing which observations happen to be in the testing set can significantly change testing accuracy
# added empty cell so that the cell numbering matches the video
from sklearn.datasets import load_iris
from sklearn.model_selection import train_test_split
from sklearn.neighbors import KNeighborsClassifier
from sklearn import metrics
# read in the iris data
iris = load_iris()

# create X (features) and y (response)
X = iris.data
y = iris.target
# use train/test split with different random_state values
X_train, X_test, y_train, y_test = train_test_split(X, y, random_state=4)

# check classification accuracy of KNN with K=5
knn = KNeighborsClassifier(n_neighbors=5)
knn.fit(X_train, y_train)
y_pred = knn.predict(X_test)
print(metrics.accuracy_score(y_test, y_pred))
0.9736842105263158
Question: What if we created a bunch of train/test splits, calculated the testing accuracy for each, and averaged the results together?
Answer: That's the essense of cross-validation!
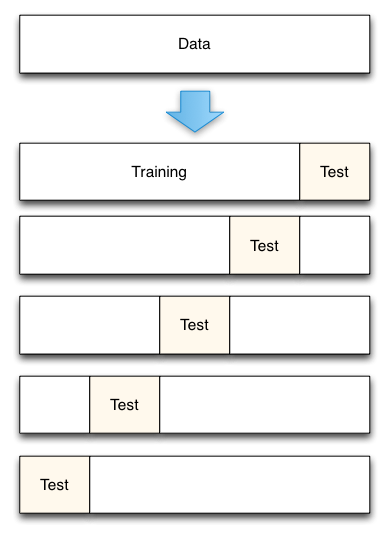
Steps for K-fold cross-validation
- Split the dataset into K equal partitions (or "folds").
- Use fold 1 as the testing set and the union of the other folds as the training set.
- Calculate testing accuracy.
- Repeat steps 2 and 3 K times, using a different fold as the testing set each time.
- Use the average testing accuracy as the estimate of out-of-sample accuracy.
Diagram of 5-fold cross-validation:
# added empty cell so that the cell numbering matches the video
# added empty cell so that the cell numbering matches the video
# simulate splitting a dataset of 25 observations into 5 folds
from sklearn.model_selection import KFold
kf = KFold(n_splits=5, shuffle=False).split(range(25))

# print the contents of each training and testing set
print('{} {:^61} {}'.format('Iteration', 'Training set observations', 'Testing set observations'))
for iteration, data in enumerate(kf, start=1):
    print('{:^9} {} {:^25}'.format(iteration, data[0], str(data[1])))
Iteration                   Training set observations                   Testing set observations
    1     [ 5  6  7  8  9 10 11 12 13 14 15 16 17 18 19 20 21 22 23 24]        [0 1 2 3 4]
    2     [ 0  1  2  3  4 10 11 12 13 14 15 16 17 18 19 20 21 22 23 24]        [5 6 7 8 9]
    3     [ 0  1  2  3  4  5  6  7  8  9 15 16 17 18 19 20 21 22 23 24]     [10 11 12 13 14]
    4     [ 0  1  2  3  4  5  6  7  8  9 10 11 12 13 14 20 21 22 23 24]     [15 16 17 18 19]
    5     [ 0  1  2  3  4  5  6  7  8  9 10 11 12 13 14 15 16 17 18 19]     [20 21 22 23 24]
- Dataset contains 25 observations (numbered 0 through 24)
- 5-fold cross-validation, thus it runs for 5 iterations
- For each iteration, every observation is either in the training set or the testing set, but not both
- Every observation is in the testing set exactly once
Comparing cross-validation to train/test split
Advantages of cross-validation:
- More accurate estimate of out-of-sample accuracy
- More "efficient" use of data (every observation is used for both training and testing)
Advantages of train/test split:
- Runs K times faster than K-fold cross-validation
- Simpler to examine the detailed results of the testing process
Cross-validation recommendations
- K can be any number, but K=10 is generally recommended
- For classification problems, stratified sampling is recommended for creating the folds
- Each response class should be represented with equal proportions in each of the K folds
- scikit-learn's
cross_val_scorefunction does this by default
Cross-validation example: parameter tuning
Goal: Select the best tuning parameters (aka "hyperparameters") for KNN on the iris dataset
from sklearn.model_selection import cross_val_score
# 10-fold cross-validation with K=5 for KNN (the n_neighbors parameter)
knn = KNeighborsClassifier(n_neighbors=5)
scores = cross_val_score(knn, X, y, cv=10, scoring='accuracy')
print(scores)
[1.         0.93333333 1.         1.         0.86666667 0.93333333
 0.93333333 1.         1.         1.        ]
# use average accuracy as an estimate of out-of-sample accuracy
print(scores.mean())
0.9666666666666668
# search for an optimal value of K for KNN
k_range = list(range(1, 31))
k_scores = []
for k in k_range:
    knn = KNeighborsClassifier(n_neighbors=k)
    scores = cross_val_score(knn, X, y, cv=10, scoring='accuracy')
    k_scores.append(scores.mean())
print(k_scores)
[0.96, 0.9533333333333334, 0.9666666666666666, 0.9666666666666666, 0.9666666666666668, 0.9666666666666668, 0.9666666666666668, 0.9666666666666668, 0.9733333333333334, 0.9666666666666668, 0.9666666666666668, 0.9733333333333334, 0.9800000000000001, 0.9733333333333334, 0.9733333333333334, 0.9733333333333334, 0.9733333333333334, 0.9800000000000001, 0.9733333333333334, 0.9800000000000001, 0.9666666666666666, 0.9666666666666666, 0.9733333333333334, 0.96, 0.9666666666666666, 0.96, 0.9666666666666666, 0.9533333333333334, 0.9533333333333334, 0.9533333333333334]
import matplotlib.pyplot as plt
%matplotlib inline

# plot the value of K for KNN (x-axis) versus the cross-validated accuracy (y-axis)
plt.plot(k_range, k_scores)
plt.xlabel('Value of K for KNN')
plt.ylabel('Cross-Validated Accuracy')
Text(0, 0.5, 'Cross-Validated Accuracy')

Cross-validation example: model selection
Goal: Compare the best KNN model with logistic regression on the iris dataset
# 10-fold cross-validation with the best KNN model
knn = KNeighborsClassifier(n_neighbors=20)
print(cross_val_score(knn, X, y, cv=10, scoring='accuracy').mean())
0.9800000000000001
# 10-fold cross-validation with logistic regression
from sklearn.linear_model import LogisticRegression
logreg = LogisticRegression(solver='liblinear')
print(cross_val_score(logreg, X, y, cv=10, scoring='accuracy').mean())
0.9533333333333334
Cross-validation example: feature selection
Goal: Select whether the Newspaper feature should be included in the linear regression model on the advertising dataset
import pandas as pd
import numpy as np
from sklearn.linear_model import LinearRegression
# read in the advertising dataset
data = pd.read_csv('data/Advertising.csv', index_col=0)
# create a Python list of three feature names
feature_cols = ['TV', 'Radio', 'Newspaper']

# use the list to select a subset of the DataFrame (X)
X = data[feature_cols]

# select the Sales column as the response (y)
y = data.Sales
# 10-fold cross-validation with all three features
lm = LinearRegression()
scores = cross_val_score(lm, X, y, cv=10, scoring='neg_mean_squared_error')
print(scores)
[-3.56038438 -3.29767522 -2.08943356 -2.82474283 -1.3027754  -1.74163618
 -8.17338214 -2.11409746 -3.04273109 -2.45281793]
# fix the sign of MSE scores
mse_scores = -scores
print(mse_scores)
[3.56038438 3.29767522 2.08943356 2.82474283 1.3027754  1.74163618
 8.17338214 2.11409746 3.04273109 2.45281793]
# convert from MSE to RMSE
rmse_scores = np.sqrt(mse_scores)
print(rmse_scores)
[1.88689808 1.81595022 1.44548731 1.68069713 1.14139187 1.31971064
 2.85891276 1.45399362 1.7443426  1.56614748]
# calculate the average RMSE
print(rmse_scores.mean())
1.6913531708051797
# 10-fold cross-validation with two features (excluding Newspaper)
feature_cols = ['TV', 'Radio']
X = data[feature_cols]
print(np.sqrt(-cross_val_score(lm, X, y, cv=10, scoring='neg_mean_squared_error')).mean())
1.6796748419090768
Improvements to cross-validation
Repeated cross-validation
- Repeat cross-validation multiple times (with different random splits of the data) and average the results
- More reliable estimate of out-of-sample performance by reducing the variance associated with a single trial of cross-validation
Creating a hold-out set
- "Hold out" a portion of the data before beginning the model building process
- Locate the best model using cross-validation on the remaining data, and test it using the hold-out set
- More reliable estimate of out-of-sample performance since hold-out set is truly out-of-sample
Feature engineering and selection within cross-validation iterations
- Normally, feature engineering and selection occurs before cross-validation
- Instead, perform all feature engineering and selection within each cross-validation iteration
- More reliable estimate of out-of-sample performance since it better mimics the application of the model to out-of-sample data
Resources
- scikit-learn documentation: Cross-validation, Model evaluation
- scikit-learn issue on GitHub: MSE is negative when returned by cross_val_score
- Section 5.1 of An Introduction to Statistical Learning (11 pages) and related videos: K-fold and leave-one-out cross-validation (14 minutes), Cross-validation the right and wrong ways (10 minutes)
- Scott Fortmann-Roe: Accurately Measuring Model Prediction Error
- Machine Learning Mastery: An Introduction to Feature Selection
- Harvard CS109: Cross-Validation: The Right and Wrong Way
- Journal of Cheminformatics: Cross-validation pitfalls when selecting and assessing regression and classification models
Comments or Questions?
- Email: kevin@dataschool.io
- Website: https://www.dataschool.io
- Twitter: @justmarkham
© 2021 Data School. All rights reserved.