Model Evaluation
Review of last class
- Goal was to predict the response value of an unknown observation
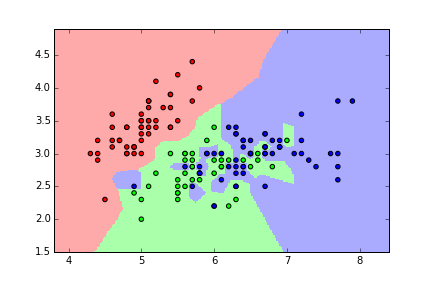
- predict the species of an unknown iris
- predict the position of an unknown NBA player
- Made predictions using KNN models with different values of K
- Need a way to choose the "best" model: the one that "generalizes" to "out-of-sample" data
Solution: Create a procedure that estimates how well a model is likely to perform on out-of-sample data and use that to choose between models.
Note: These procedures can be used with any machine learning model, not only KNN.
Evaluation procedure #1: Train and test on the entire dataset
- Train the model on the entire dataset.
- Test the model on the same dataset, and evaluate how well we did by comparing the predicted response values with the true response values.
# read the NBA data into a DataFrame
import pandas as pd
url = 'https://raw.githubusercontent.com/justmarkham/DAT4-students/master/kerry/Final/NBA_players_2015.csv'
nba = pd.read_csv(url, index_col=0)
# map positions to numbers
nba['pos_num'] = nba.pos.map({'C':0, 'F':1, 'G':2})
# create feature matrix (X)
feature_cols = ['ast', 'stl', 'blk', 'tov', 'pf']
X = nba[feature_cols]
# create response vector (y)
y = nba.pos_num
KNN (K=50)
# import the class
from sklearn.neighbors import KNeighborsClassifier

# instantiate the model
knn = KNeighborsClassifier(n_neighbors=50)

# train the model on the entire dataset
knn.fit(X, y)

# predict the response values for the observations in X ("test the model")
knn.predict(X)
array([1, 1, 0, 1, 2, 1, 1, 1, 1, 1, 1, 1, 1, 1, 1, 1, 1, 1, 2, 1, 1, 2, 1,
       1, 2, 1, 1, 1, 1, 2, 1, 2, 1, 1, 1, 1, 2, 2, 1, 1, 2, 1, 2, 1, 1, 2,
       0, 1, 1, 2, 2, 1, 1, 1, 1, 1, 2, 1, 1, 1, 2, 2, 1, 1, 2, 1, 1, 2, 2,
       1, 2, 1, 1, 2, 2, 1, 2, 1, 1, 1, 2, 1, 2, 0, 1, 1, 1, 1, 2, 1, 2, 2,
       1, 2, 1, 1, 2, 2, 1, 1, 2, 1, 1, 1, 2, 0, 1, 1, 1, 0, 0, 1, 1, 1, 1,
       2, 2, 2, 2, 1, 2, 1, 2, 1, 2, 1, 2, 0, 2, 1, 1, 2, 1, 2, 2, 1, 2, 1,
       1, 2, 2, 1, 1, 2, 0, 2, 1, 2, 2, 2, 2, 1, 1, 1, 2, 1, 1, 2, 1, 2, 1,
       0, 2, 0, 1, 1, 1, 1, 1, 2, 0, 1, 0, 1, 2, 1, 1, 1, 2, 2, 2, 2, 1, 1,
       1, 1, 2, 2, 1, 2, 1, 1, 1, 1, 1, 1, 2, 1, 2, 1, 0, 0, 1, 1, 2, 1, 2,
       2, 2, 1, 1, 1, 2, 0, 1, 1, 0, 2, 1, 2, 2, 2, 2, 1, 2, 1, 1, 1, 1, 2,
       1, 1, 1, 1, 1, 2, 1, 2, 1, 1, 1, 1, 0, 0, 1, 2, 0, 1, 2, 1, 1, 1, 1,
       2, 2, 1, 1, 1, 1, 2, 1, 2, 2, 1, 2, 2, 1, 0, 1, 1, 1, 2, 2, 2, 0, 0,
       2, 2, 2, 1, 2, 1, 2, 1, 2, 1, 1, 2, 2, 1, 2, 1, 1, 2, 1, 0, 1, 1, 1,
       1, 1, 2, 2, 1, 1, 2, 1, 1, 1, 2, 1, 2, 1, 1, 1, 1, 1, 2, 1, 1, 1, 1,
       0, 1, 1, 1, 2, 2, 2, 1, 2, 1, 1, 1, 2, 0, 1, 1, 2, 1, 1, 2, 1, 1, 2,
       2, 2, 2, 1, 2, 1, 0, 2, 0, 1, 1, 1, 1, 2, 2, 2, 2, 2, 1, 1, 1, 1, 2,
       1, 1, 2, 2, 1, 2, 1, 2, 1, 2, 2, 1, 2, 1, 1, 1, 1, 1, 0, 2, 1, 1, 2,
       1, 2, 2, 2, 1, 1, 2, 2, 1, 2, 2, 1, 2, 1, 1, 1, 1, 1, 2, 1, 2, 1, 0,
       2, 2, 1, 2, 1, 2, 1, 2, 2, 1, 1, 1, 1, 1, 2, 0, 1, 1, 1, 2, 1, 2, 1,
       2, 0, 1, 2, 1, 1, 1, 2, 2, 1, 2, 2, 1, 1, 2, 1, 1, 2, 2, 0, 1, 1, 1,
       2, 1, 1, 2, 1, 2, 1, 1, 1, 1, 1, 1, 2, 1, 1, 2, 1, 1], dtype=int64)
# store the predicted response values
y_pred_class = knn.predict(X)
To evaluate a model, we also need an evaluation metric:
- Numeric calculation used to quantify the performance of a model
- Appropriate metric depends on the goals of your problem
Most common choices for classification problems:
- Classification accuracy: percentage of correct predictions ("reward function" since higher is better)
- Classification error: percentage of incorrect predictions ("loss function" since lower is better)
In this case, we'll use classification accuracy.
# compute classification accuracy
from sklearn import metrics
print metrics.accuracy_score(y, y_pred_class)
0.665271966527
This is known as training accuracy because we are evaluating the model on the same data we used to train the model.
KNN (K=1)
knn = KNeighborsClassifier(n_neighbors=1)
knn.fit(X, y)
y_pred_class = knn.predict(X)
print metrics.accuracy_score(y, y_pred_class)
1.0
Problems with training and testing on the same data
- Goal is to estimate likely performance of a model on out-of-sample data
- But, maximizing training accuracy rewards overly complex models that won't necessarily generalize
- Unnecessarily complex models overfit the training data:
- Will do well when tested using the in-sample data
- May do poorly on out-of-sample data
- Learns the "noise" in the data rather than the "signal"
- From Quora: What is an intuitive explanation of overfitting?
Thus, training accuracy is not a good estimate of out-of-sample accuracy.
Evaluation procedure #2: Train/test split
- Split the dataset into two pieces: a training set and a testing set.
- Train the model on the training set.
- Test the model on the testing set, and evaluate how well we did.
What does this accomplish?
- Model can be trained and tested on different data (we treat testing data like out-of-sample data).
- Response values are known for the testing set, and thus predictions can be evaluated.
This is known as testing accuracy because we are evaluating the model on an independent "test set" that was not used during model training.
Testing accuracy is a better estimate of out-of-sample performance than training accuracy.
Understanding "unpacking"
def min_max(nums):
    smallest = min(nums)
    largest = max(nums)
    return [smallest, largest]
min_and_max = min_max([1, 2, 3])
print min_and_max
print type(min_and_max)
[1, 3]
<type 'list'>
the_min, the_max = min_max([1, 2, 3])
print the_min
print type(the_min)
print the_max
print type(the_max)
1
<type 'int'>
3
<type 'int'>
Understanding the train_test_split function
from sklearn.cross_validation import train_test_split
X_train, X_test, y_train, y_test = train_test_split(X, y)
# before splitting
print X.shape

# after splitting
print X_train.shape
print X_test.shape
(478, 5)
(358, 5)
(120, 5)
# before splitting
print y.shape

# after splitting
print y_train.shape
print y_test.shape
(478L,)
(358L,)
(120L,)

Understanding the random_state parameter
# WITHOUT a random_state parameter
X_train, X_test, y_train, y_test = train_test_split(X, y)

# print the first element of each object
print X_train.head(1)
print X_test.head(1)
print y_train.head(1)
print y_test.head(1)
     ast  stl  blk  tov   pf
230  0.9  0.6  0.3  0.5  1.7
     ast  stl  blk  tov  pf
424  0.4  0.2  0.1  0.8   1
230    1
Name: pos_num, dtype: int64
424    1
Name: pos_num, dtype: int64
# WITH a random_state parameter
X_train, X_test, y_train, y_test = train_test_split(X, y, random_state=99)

# print the first element of each object
print X_train.head(1)
print X_test.head(1)
print y_train.head(1)
print y_test.head(1)
     ast  stl  blk  tov   pf
401  2.9  1.3  0.2  1.4  2.3
    ast  stl  blk  tov   pf
32  1.5  0.9  0.6  1.1  3.1
401    2
Name: pos_num, dtype: int64
32    1
Name: pos_num, dtype: int64
Using the train/test split procedure (K=1)
# STEP 1: split X and y into training and testing sets (using random_state for reproducibility)
X_train, X_test, y_train, y_test = train_test_split(X, y, random_state=99)
# STEP 2: train the model on the training set (using K=1)
knn = KNeighborsClassifier(n_neighbors=1)
knn.fit(X_train, y_train)
KNeighborsClassifier(algorithm='auto', leaf_size=30, metric='minkowski',
           metric_params=None, n_neighbors=1, p=2, weights='uniform')
# STEP 3: test the model on the testing set, and check the accuracy
y_pred_class = knn.predict(X_test)
print metrics.accuracy_score(y_test, y_pred_class)
0.616666666667
Repeating for K=50
knn = KNeighborsClassifier(n_neighbors=50)
knn.fit(X_train, y_train)
y_pred_class = knn.predict(X_test)
print metrics.accuracy_score(y_test, y_pred_class)
0.675

Comparing testing accuracy with null accuracy
Null accuracy is the accuracy that could be achieved by always predicting the most frequent class. It is a benchmark against which you may want to measure your classification model.
# examine the class distribution
y_test.value_counts()
2    60
1    49
0    11
dtype: int64
# compute null accuracy
y_test.value_counts().head(1) / len(y_test)
2    0.5
dtype: float64
Searching for the "best" value of K
# calculate TRAINING ERROR and TESTING ERROR for K=1 through 100

k_range = range(1, 101)
training_error = []
testing_error = []

for k in k_range:

    # instantiate the model with the current K value
    knn = KNeighborsClassifier(n_neighbors=k)

    # calculate training error
    knn.fit(X, y)
    y_pred_class = knn.predict(X)
    training_accuracy = metrics.accuracy_score(y, y_pred_class)
    training_error.append(1 - training_accuracy)

    # calculate testing error
    knn.fit(X_train, y_train)
    y_pred_class = knn.predict(X_test)
    testing_accuracy = metrics.accuracy_score(y_test, y_pred_class)
    testing_error.append(1 - testing_accuracy)
# allow plots to appear in the notebook
%matplotlib inline
import matplotlib.pyplot as plt
plt.style.use('fivethirtyeight')
# create a DataFrame of K, training error, and testing error
column_dict = {'K': k_range, 'training error':training_error, 'testing error':testing_error}
df = pd.DataFrame(column_dict).set_index('K').sort_index(ascending=False)
df.head()
| testing error | training error | |
|---|---|---|
| K | ||
| 100 | 0.366667 | 0.351464 |
| 99 | 0.358333 | 0.347280 |
| 98 | 0.366667 | 0.345188 |
| 97 | 0.366667 | 0.347280 |
| 96 | 0.366667 | 0.345188 |
# plot the relationship between K (HIGH TO LOW) and TESTING ERROR
df.plot(y='testing error')
plt.xlabel('Value of K for KNN')
plt.ylabel('Error (lower is better)')
<matplotlib.text.Text at 0x17406438>

# find the minimum testing error and the associated K value
df.sort('testing error').head()
| testing error | training error | |
|---|---|---|
| K | ||
| 14 | 0.258333 | 0.286611 |
| 13 | 0.266667 | 0.282427 |
| 18 | 0.266667 | 0.284519 |
| 16 | 0.266667 | 0.282427 |
| 15 | 0.266667 | 0.284519 |
# alternative method
min(zip(testing_error, k_range))
(0.2583333333333333, 14)
What could we conclude?
- When using KNN on this dataset with these features, the best value for K is likely to be around 14.
- Given the statistics of an unknown player, we estimate that we would be able to correctly predict his position about 74% of the time.
Training error versus testing error
# plot the relationship between K (HIGH TO LOW) and both TRAINING ERROR and TESTING ERROR
df.plot()
plt.xlabel('Value of K for KNN')
plt.ylabel('Error (lower is better)')
<matplotlib.text.Text at 0x17fe76d8>

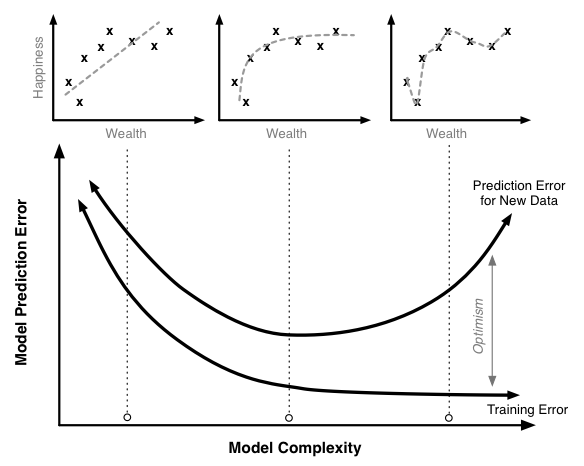
- Training error decreases as model complexity increases (lower value of K)
- Testing error is minimized at the optimum model complexity
Making predictions on out-of-sample data
Given the statistics of a (truly) unknown player, how do we predict his position?
# instantiate the model with the best known parameters
knn = KNeighborsClassifier(n_neighbors=14)

# re-train the model with X and y (not X_train and y_train) - why?
knn.fit(X, y)

# make a prediction for an out-of-sample observation
knn.predict([1, 1, 0, 1, 2])
array([1], dtype=int64)
Disadvantages of train/test split?
What would happen if the train_test_split function had split the data differently? Would we get the same exact results as before?
# try different values for random_state
X_train, X_test, y_train, y_test = train_test_split(X, y, random_state=98)
knn = KNeighborsClassifier(n_neighbors=50)
knn.fit(X_train, y_train)
y_pred_class = knn.predict(X_test)
print metrics.accuracy_score(y_test, y_pred_class)
0.641666666667
- Testing accuracy is a high-variance estimate of out-of-sample accuracy
- K-fold cross-validation overcomes this limitation and provides more reliable estimates
- But, train/test split is still useful because of its flexibility and speed