Subspace Identification: Fractionator example
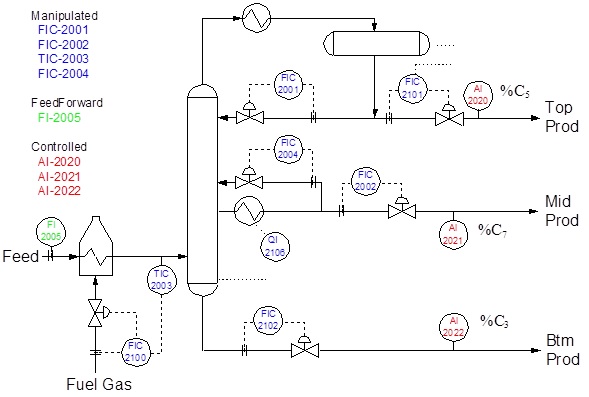
Reflux (FIC-2001) Increasing reflux (and keeping everything else constant) will decrease the Top Product (FIC-2101) and increase the bottoms product (FIC-2102) by the same amount.
Mid Product (FIC-2002) Increasing the side draw FIC-2002 will affect FIC-2101 and FIC-2102. If we increase the side draw by 1 unit then both top and bottoms product will have to decrease by 1 unit.
Feed Temperature (TIC-2003) Increasing the feed temperature also affects the mass balance in the fractionator and the feed is split in the top and bottoms product.
Mid Reflux (FIC-2004) Increasing the mid reflux (FIC-2004) will also affect both top and bottoms product flow:
In [1]:
import numpy as np
import pandas as pd
from scipy import signal, stats, fftpack
import matplotlib.pyplot as plt
import sys, os
sys.path.append(os.path.dirname(os.getcwd()))
from sysidbox.subspace import system_identification
from sysidbox.functionsetSIM import get_model_uncertainty, get_deadtime, get_fir_coef, get_step_response, simulate_fir
from harold import simulate_step_response, simulate_impulse_response, undiscretize, discretize
from detrend.detrending_filter import DetrendingFilter
# %matplotlib widget
In [2]:
# Load spteptest data from a TSV file
file = os.path.join(os.path.dirname(os.getcwd()),'data','FRAC2.csv')
columns = ['Time', 'AI-2020', 'AI-2021', 'AI-2022', 'FIC-2100', 'FIC-2101', 'FIC-2102', 'FI-2005', 'FIC-2001', 'FIC-2002', 'FIC-2004', 'QI-2106', 'TIC-2003']
step_test_data = pd.read_csv(file,skiprows=[1,2,3], usecols=columns, index_col='Time', parse_dates=True)
In [3]:
step_test_data.head()
Out[3]:
| AI-2020 | AI-2021 | AI-2022 | FIC-2100 | FIC-2101 | FIC-2102 | FI-2005 | FIC-2001 | FIC-2002 | FIC-2004 | QI-2106 | TIC-2003 | |
|---|---|---|---|---|---|---|---|---|---|---|---|---|
| Time | ||||||||||||
| 2015-10-01 08:14:00 | 2.00000 | 3.00000 | 4.00000 | 8.50000 | 2.10000 | 1.70000 | 5.02153 | 2.5 | 1.5 | 8.0 | 2.00000 | 200.0 |
| 2015-10-01 08:15:00 | 2.00360 | 3.00954 | 3.99831 | 8.50735 | 2.09686 | 1.71730 | 4.98768 | 2.5 | 1.5 | 8.0 | 1.99772 | 200.0 |
| 2015-10-01 08:16:00 | 2.00870 | 2.99518 | 3.97746 | 8.50977 | 2.09280 | 1.72500 | 4.93990 | 2.5 | 1.5 | 8.0 | 1.99552 | 200.0 |
| 2015-10-01 08:17:00 | 2.00385 | 3.01356 | 3.97262 | 8.50838 | 2.08587 | 1.71878 | 4.93333 | 2.5 | 1.5 | 8.0 | 1.99483 | 200.0 |
| 2015-10-01 08:18:00 | 1.99852 | 3.02963 | 3.98841 | 8.50365 | 2.08028 | 1.71360 | 4.96880 | 2.5 | 1.5 | 8.0 | 1.99465 | 200.0 |
In [3]:
step_test_data.describe()
Out[3]:
| AI-2020 | AI-2021 | AI-2022 | FIC-2100 | FIC-2101 | FIC-2102 | FI-2005 | FIC-2001 | FIC-2002 | FIC-2004 | QI-2106 | TIC-2003 | |
|---|---|---|---|---|---|---|---|---|---|---|---|---|
| count | 5820.000000 | 5820.000000 | 5820.000000 | 5820.000000 | 5820.000000 | 5820.000000 | 5820.000000 | 5820.000000 | 5820.000000 | 5820.000000 | 5820.000000 | 5820.000000 |
| mean | -154.245680 | 3.347584 | 3.974376 | 9.033256 | 2.924300 | 1.795645 | 5.994956 | 2.731959 | 1.556701 | 8.365979 | 2.175489 | 200.278351 |
| std | 1240.862066 | 0.234960 | 0.364111 | 0.535641 | 0.810603 | 0.595210 | 0.619313 | 0.400175 | 0.236797 | 0.761627 | 0.485643 | 0.646094 |
| min | -9999.000000 | 2.820780 | 3.067540 | 7.999970 | 1.167090 | 0.273632 | 0.000000 | 1.500000 | 1.000000 | 7.000000 | 0.380137 | 199.000000 |
| 25% | 1.809913 | 3.169485 | 3.777985 | 8.558795 | 2.273465 | 1.389850 | 5.548435 | 2.500000 | 1.500000 | 8.000000 | 1.869215 | 200.000000 |
| 50% | 2.115230 | 3.301415 | 4.020915 | 8.996355 | 2.827195 | 1.794675 | 6.004360 | 3.000000 | 1.500000 | 8.000000 | 2.028820 | 200.000000 |
| 75% | 2.434028 | 3.517735 | 4.226025 | 9.412683 | 3.594180 | 2.183885 | 6.500992 | 3.000000 | 1.500000 | 9.000000 | 2.513087 | 200.500000 |
| max | 3.297840 | 3.930950 | 4.856360 | 10.611500 | 4.838140 | 3.446710 | 11.534700 | 3.500000 | 2.000000 | 10.000000 | 3.986420 | 202.000000 |
In [4]:
plt.rcParams['figure.figsize'] = [16, 8]
plt.rcParams['figure.dpi'] = 100
step_test_data[['FIC-2001', 'FIC-2002','TIC-2003', 'FIC-2004','FI-2005']].iloc[:].plot(subplots=True)
Out[4]:
array([<AxesSubplot:xlabel='Time'>, <AxesSubplot:xlabel='Time'>,
       <AxesSubplot:xlabel='Time'>, <AxesSubplot:xlabel='Time'>,
       <AxesSubplot:xlabel='Time'>], dtype=object)

In [5]:
inputs = ['FIC-2001','FIC-2002', 'TIC-2003', 'FIC-2004','FI-2005']
outputs = ['FIC-2101', 'FIC-2102']
In [6]:
#slice data for model identification case
slices = {
            "slice1":{"type":"bad", "isGlobal": False, "start":1040, "end":1135, "Description": "OPC bad for AI-2020","tags":['AI-2020']},
            "slice2":{"type":"interpolate", "isGlobal": False,"start":3845, "end":3855, "Description": "Suspicious value for  FI-2005", "tags":['FI-2005']}
        }
In [7]:
#specify model identification parameters, reffer the documentation for detais.
tss = 120                  # Process time to steady state
controller_sampling = 1    # Controller sampling time
filter_tss_mult_factor = 3 # 3 for self-regulating CV, 6 for ramp CV
resampling = 1             # For tss more than 90 use 2, and if grater than 240 use 3
id_method='CVA'            # CVA, MOESP, N4SID
IC = 'AIC'                 # None, AIC, AICc, BIC
TH =  100                  # The length of time horizon used for regression
fix_ordr = 23              # Used if and only if IC = 'None'
ss_orders = [1, 45]        # SS orser min and max, Used if IC = AIC, AICc or BIC
SS_threshold = 0.1         # Singular value threshold
req_D = True
force_A_stable = False
In [8]:
# Create FIR filter to detrend signal
tags = inputs + outputs
filter_type  = 'highpass' # Valid filters ['highpass', 'difference', 'doubledifference', 'zeromean', 'none']
d_filter = DetrendingFilter().get_filter(filter_type)
if filter_type == 'highpass':
    d_filter.apply_filter(step_test_data[tags], tss, filter_tss_mult_factor, slices)
else:
    d_filter.apply_filter(step_test_data[tags], slices)

idinput = d_filter.filterdata.data["output"]
In [9]:
tag = 'FIC-2101'
trend = d_filter.filterdata.data["trend"]
plt.plot(step_test_data.index, step_test_data[tag], idinput.index, idinput[tag], trend.index, trend[tag])
plt.margins(x=0)
plt.grid()

In [10]:
# Resample datadet
idinput_resampled = idinput.resample(str(resampling)+'min').mean()
tsample = pd.Timedelta(idinput_resampled.index[1] - idinput_resampled.index[0]).total_seconds() # data sampling time
# Convert dataframe to numpy array in the shape requied for SIPPY
u = idinput_resampled[inputs].to_numpy().T
y = idinput_resampled[outputs].to_numpy().T
print('Output shape:', y.shape)
print('Input shape:',u.shape)
Output shape: (2, 5820)
Input shape: (5, 5820)
In [11]:
id_result = system_identification(
    y=y,
    u=u,
    id_method=id_method,
    tsample= tsample,
    SS_fixed_order=fix_ordr,
    SS_orders=ss_orders,
    SS_threshold=SS_threshold,
    IC=IC,
    SS_f=TH,
    SS_D_required=req_D,
    SS_A_stability=force_A_stable
    )
The suggested order is: n= 12
In [12]:
firmodel = get_fir_coef(model=id_result.G, inds=inputs, deps=outputs, sampling=60, tss=tss)
step_response = get_step_response(firmodel)
t = np.arange(0, tss)
DMC3 reference model

DMC3 reference uncertinity plot
In [13]:
input_tag = 'FIC-2001'
output_tag = 'FIC-2101'
In [14]:
imp_ij = firmodel[output_tag][input_tag]
stp_ij = step_response[output_tag][input_tag]
u = idinput[input_tag]
y = idinput[output_tag]
In [15]:
freqs, mag, ci95, ci68, snr = get_model_uncertainty(u, y, imp_ij)
snr_scaled = np.interp(snr, (snr.min(), snr.max()), (0, max(mag)))
plt.figure(2)
axes = plt.gca()
ylim = max(mag)*1.2
axes.set_ylim([-0.1,ylim+0.1])
axes.plot(freqs, mag, color='red')
axes.plot(freqs, snr_scaled, color='navy',linestyle="--", linewidth=0.5)
axes.fill_between(freqs, (mag-ci95), (mag+ci95), color='yellow', alpha=0.2)
axes.fill_between(freqs, (mag-ci68), (mag+ci68), color='green', alpha=0.3)
axes.semilogx()
axes.grid(True, which="both",color='gray', linestyle="-.", linewidth=0.5)

In [16]:
plt.figure(1)
axes = plt.gca()
ylim = max(abs(stp_ij))*1.1
axes.set_ylim([-ylim,ylim])
colr = "red"
axes.grid(color='k', linestyle='--', linewidth=0.4)
axes.spines.bottom.set_position('zero')
axes.spines.bottom.set_linestyle('-.')
axes.spines.bottom.set_linewidth(0.5)
axes.spines[['left', 'top', 'right']].set_visible(False)
axes.xaxis.set_ticks_position('bottom')
axes.yaxis.set_ticks_position('left')
plt.xticks(np.arange(0, tss+2, 20.0))
plt.yticks(np.linspace(-ylim, ylim, 20))
axes.tick_params(axis='x', colors=colr,size=0,labelsize=6)
axes.tick_params(axis='y', colors=colr,size=0,labelsize=6)
axes.margins(x=0, y=0)
plt.plot(t, stp_ij, color=colr, linewidth=0.8)
Out[16]:
[<matplotlib.lines.Line2D at 0x261cb356880>]

Dead-time identification using white noise injection
In [17]:
deadtime = get_deadtime(stp_ij)
imp_ij_shift = imp_ij.copy()
if deadtime > 1:
    imp_ij_shift[:deadtime] = 0
plt.plot(imp_ij)
plt.plot(imp_ij_shift)
plt.grid()

In [18]:
shift_step = np.cumsum(imp_ij_shift)
plt.plot(stp_ij[:20])
plt.plot(shift_step[:20])
plt.grid()

In [19]:
shift_step = np.cumsum(imp_ij_shift)
plt.plot(stp_ij)
plt.plot(shift_step)
plt.grid()

In [20]:
pred = simulate_fir(firmodel, step_test_data)
In [21]:
step_test_data[output_tag].plot(color='b', label = 'Measurment')
pred[output_tag].plot(color='r', label = 'Prediction')
plt.title(output_tag)
plt.legend()
plt.grid()
