
Visualization of data and solutions


Description: Principles and functions of graphics. Examples of visualization of economic models.
Why visualize?
- Convey ideas to others
Ability to efficiently explain your idea/work to other busy people is crucial element of success in many fields
- Check your own work
Creating of new knowledge using computational tools requires absolute certainty in the code
- Aggregate large amounts of information
Makes it possible to get the big picture and the message behind it

Matplotlib and other libraries
matplotlib- Python library that abstracts from the graphical backbone of each system and ensures code mobility
Matplotlib thumbnail gallery https://matplotlib.org/gallery.html
seaborn- pretty plots geared towards statistical applications https://seaborn.pydata.org/examples/index.htmlbokehis a library for creating interactive plots http://bokeh.pydata.org/en/latest/docs/gallery.html
Plan
- Visualization examples from my own research projects
- Links to compulsory online learning resources
Graphical objects
Extensive collection of objects to modify all aspects of the graphics
- figure - axes - subplots
- lines - polygons (patches)
- fill color and edge color
- annotations and other text
Types of plots
- bar - categorical data, histograms
- scatter - individual data points
- line - continuous measure
- area - dynamics of composition
- pie - static composition
- Sankey - flow diagram
How to choose the plot type
- Number of variables to be represented
- Type of variables
- continuous
- categorical
- ordered
- What is the message of the graphics?
General tips
- Less visual clutter!
Every dot, line, shape and label has to convey useful information
- Read the the manual and change the options
Defaults are good for quick and dirty preliminary runs only
- Careful with 3D
Much harder to make clear
- “Animations”
May be useful in cases when there are one too many dimensions in the data to visualize
Less visual clutter

Choice of appropriate plot type


Using many dimensions in one plot
- location (x,y,z)
- color
- line or marker style
- size
- animation
- multiple plots in a figure

Visual debugging and dashboards
Using visual representation to verify the code
- Seeing a bug in a plot is easier than in the code!
Dashboards are ideal for aggregation of large amounts of information
- Calibration/estimation an moment matching
- Monitoring computing resources


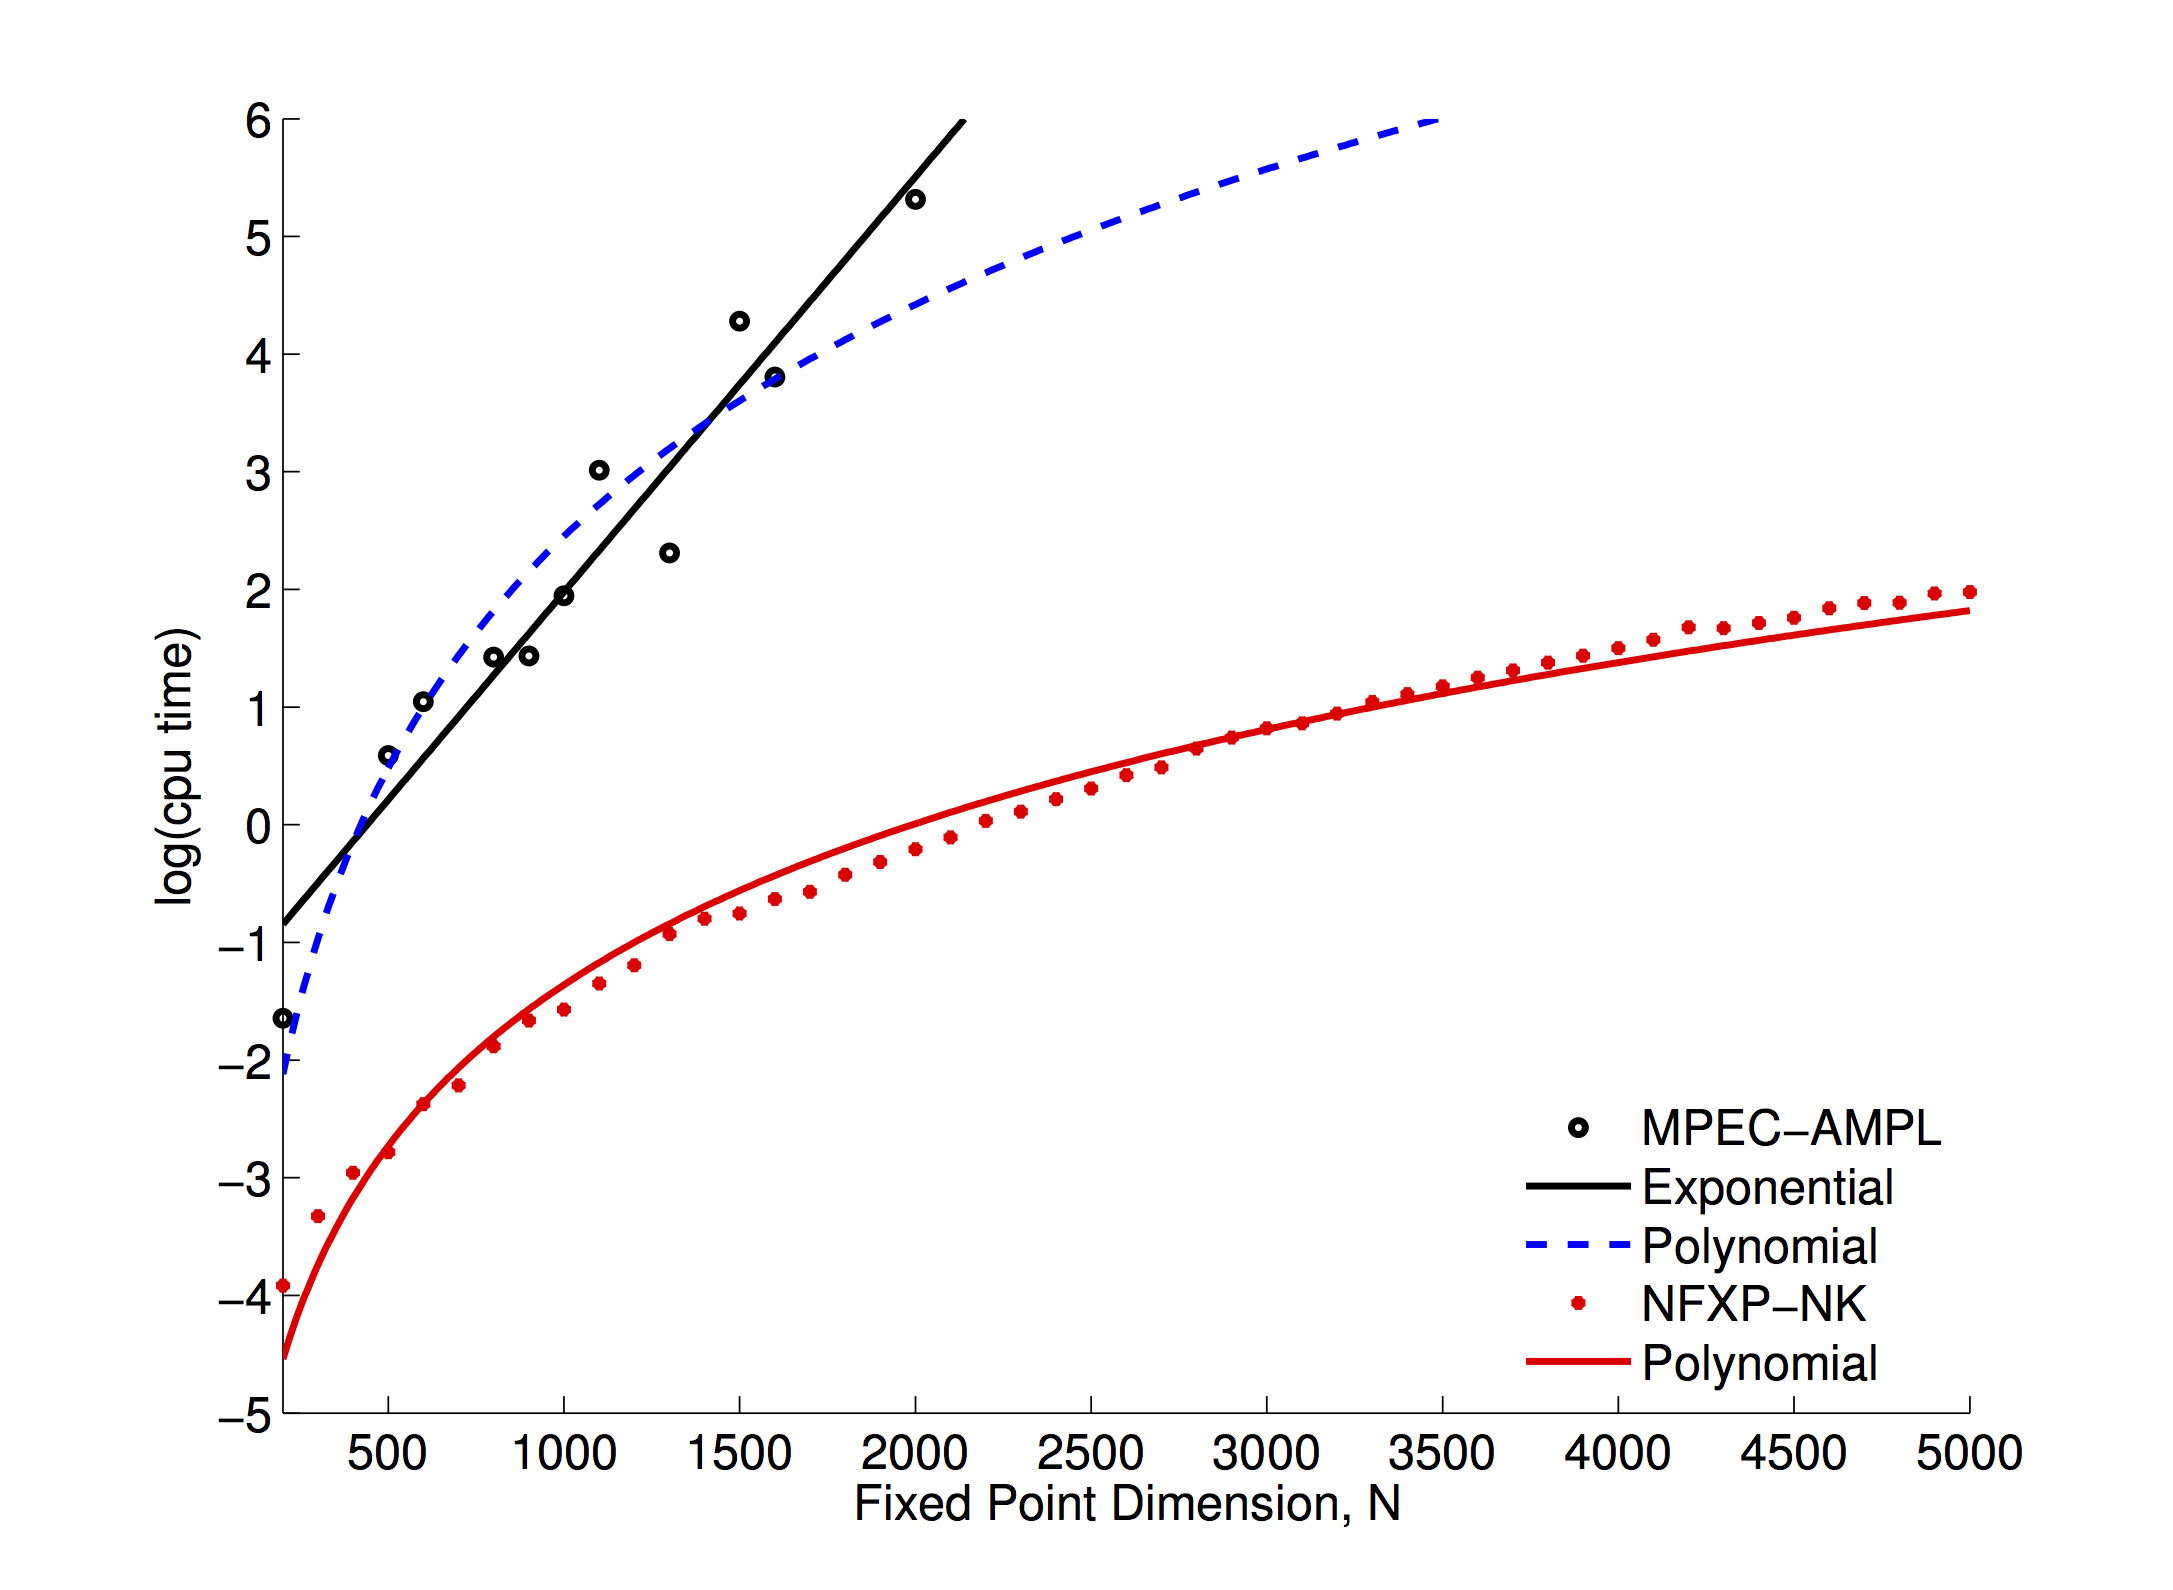
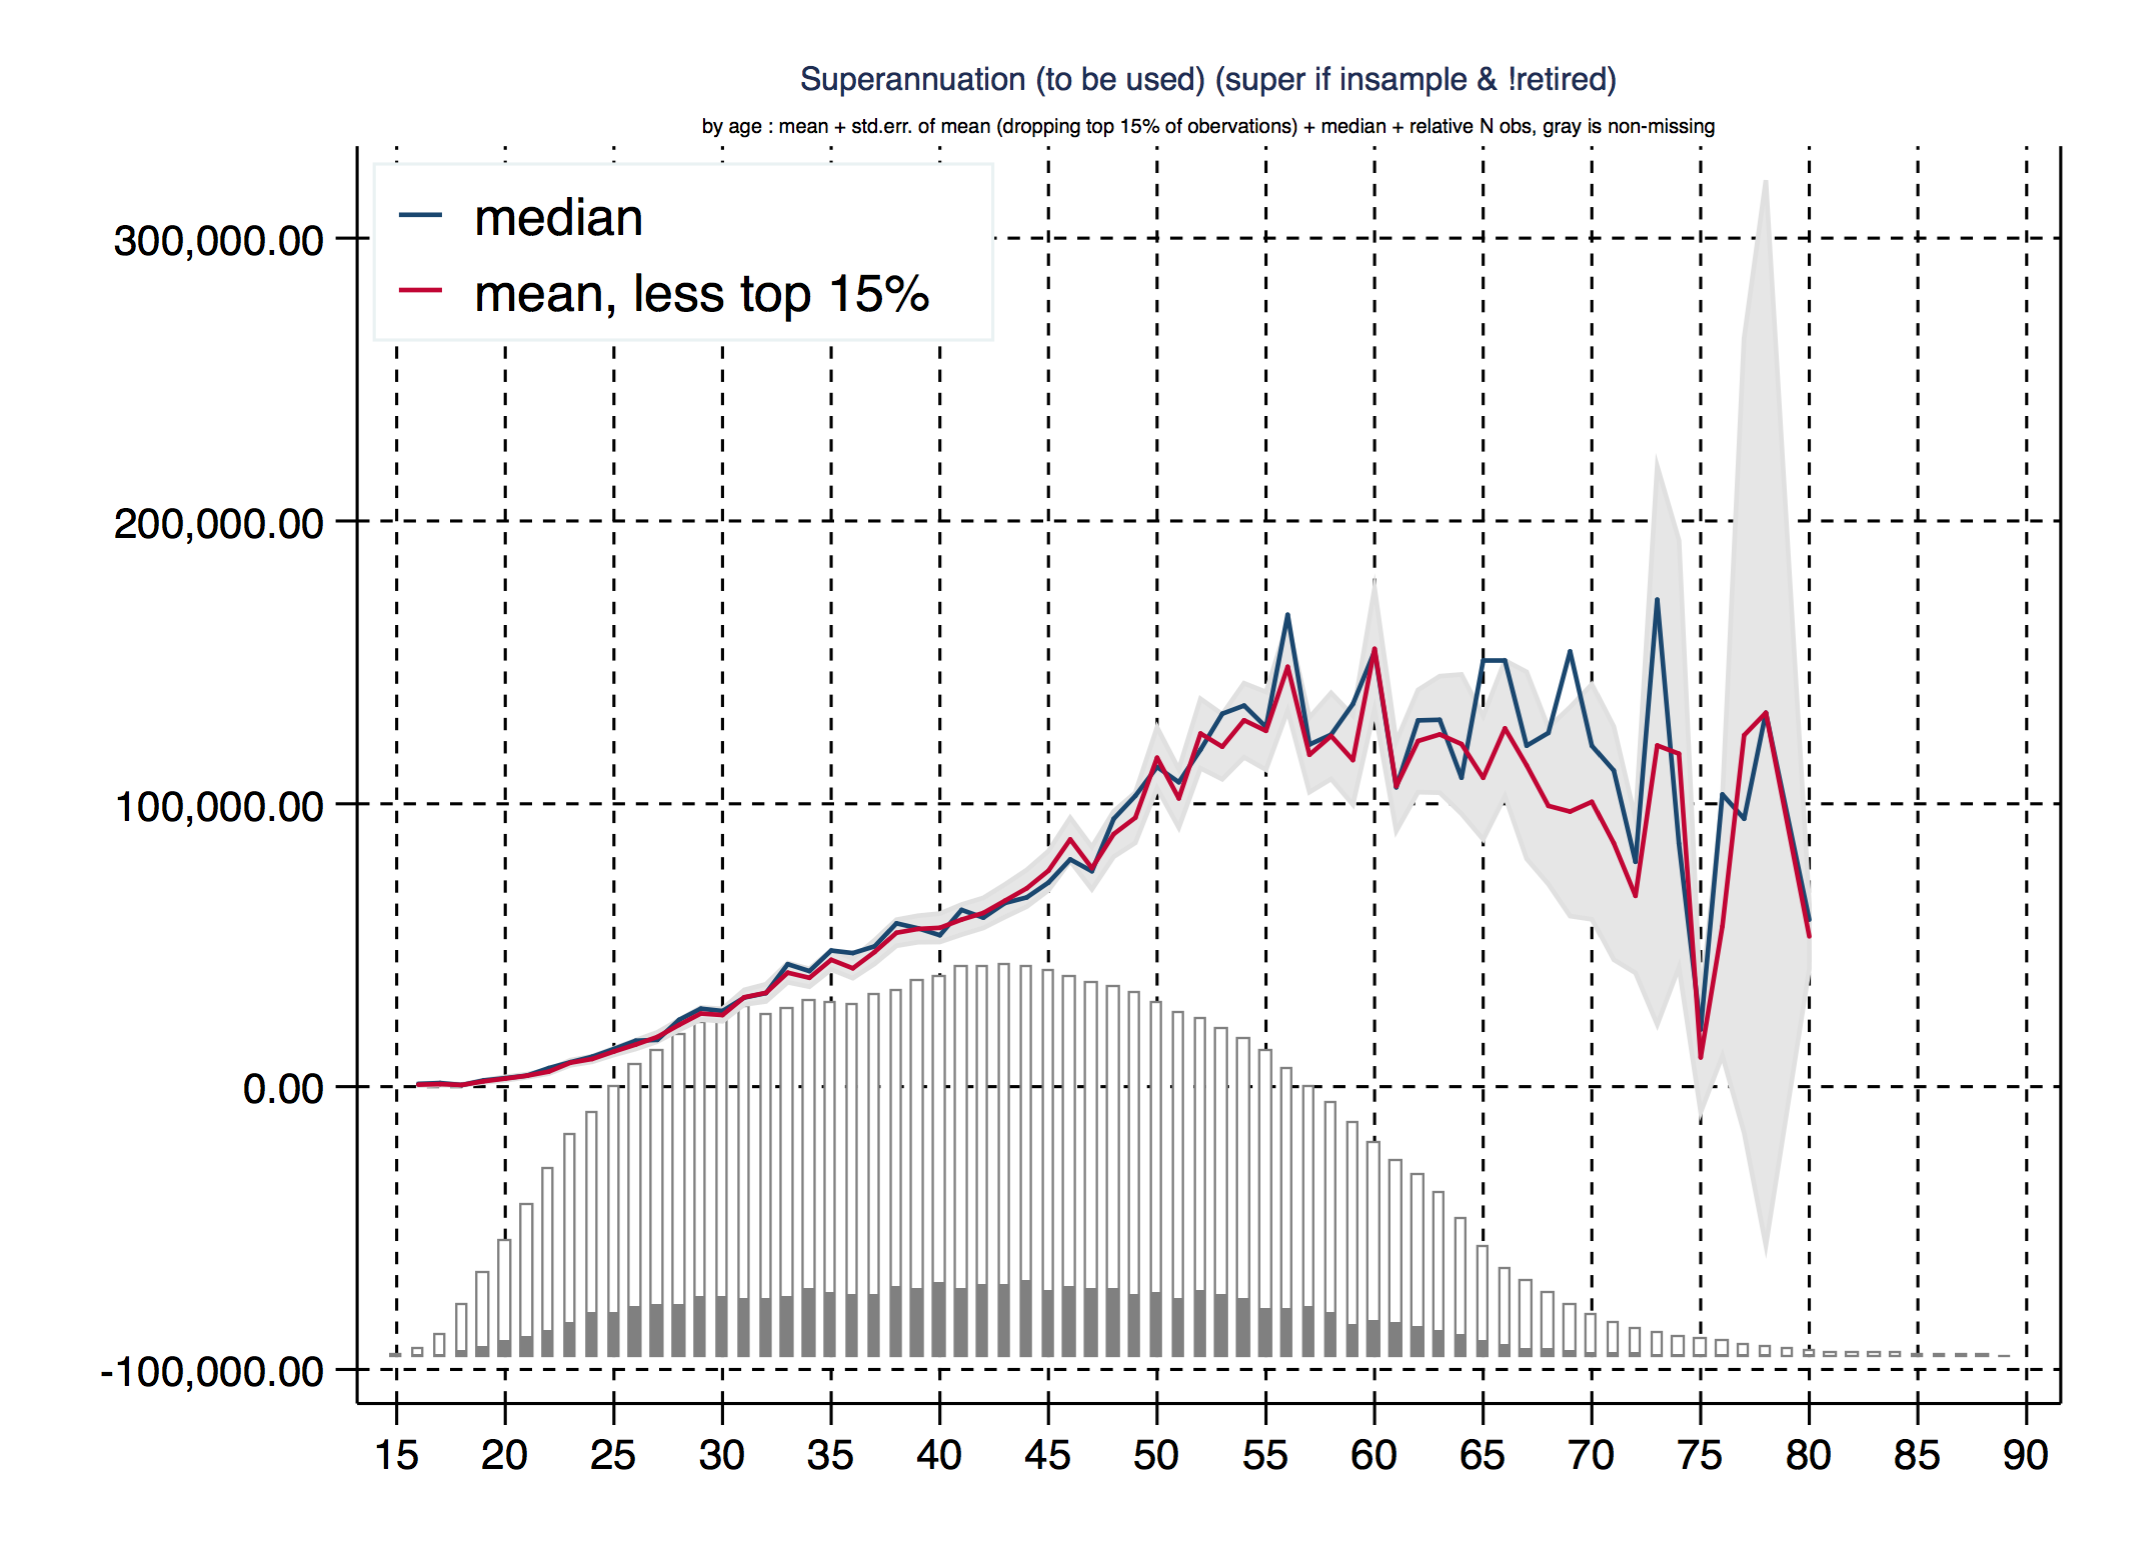
Visualizing economic model for new insights


Tutorials for compulsory self-study
- Excellent tutorial on Matplotlib on QuantEcon DataScience https://datascience.quantecon.org/applications/visualization_rules.html
- Presentation by Hans Rosling (1948-2017, Swedish physician, academic, statistician, and public speaker) https://youtu.be/hVimVzgtD6w?t=159
Further learning resources
- Excellent beginner tutorial for Matplotlib by the authors (3h) https://www.youtube.com/watch?v=6gdNUDs6QPc&t=2843s
- Playlist of lectures and tutorials https://www.youtube.com/user/EnthoughtMedia/search?query=matplotlib
- Visualization of sorting algorithms https://www.youtube.com/watch?v=kPRA0W1kECg