
In [1]:
import numpy as np
import pandas as  pd
import matplotlib.pyplot as plt

plt.style.use('ggplot')
%matplotlib inline

from scipy.stats import binom, poisson, zscore
Coming into the Fight
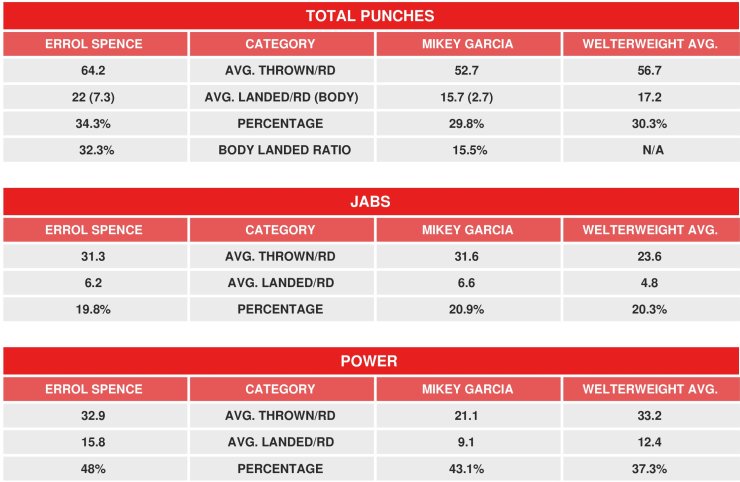
source: https://www.boxingscene.com/errol-spence-vs-mikey-garcia-compubox-historical-review--137148
(mis)Using Poisson to Get an Idea of Expected Fighter Output
Spence could be expected to be busier, but by how much and where?
In [2]:
np.random.seed(8)

sim_cnt_poi = 10000

spence_tot_poi, spence_jab_poi, spence_pow_poi = np.random.poisson(64, sim_cnt_poi), \
                                                    np.random.poisson(31, sim_cnt_poi), \
                                                    np.random.poisson(33, sim_cnt_poi)
garcia_tot_poi, garcia_jab_poi, garcia_pow_poi = np.random.poisson(53, sim_cnt_poi), \
                                                    np.random.poisson(32, sim_cnt_poi), \
                                                    np.random.poisson(21, sim_cnt_poi)


plt.figure(figsize=(16,6))

    # SPENCE

ax1 = plt.subplot(231)
plt.hist(spence_tot_poi, 14, density=True, color='green')
plt.title("Spence Total Punches/Rd")

ax2 = plt.subplot(232, sharey=ax1)
plt.hist(spence_jab_poi, 14, density=True, color='green')
plt.title("Spence Jabs/Rd")

ax3 = plt.subplot(233, sharey=ax1)
plt.hist(spence_pow_poi, 14, density=True, color='green')
plt.title("Spence Power Punches/Rd")


    # GARCIA

plt.subplot(234, sharex=ax1, sharey=ax1)
plt.hist(garcia_tot_poi, 14, density=True)
plt.title("Garcia Total Punches/Rd")

plt.subplot(235, sharex=ax2, sharey=ax1)
plt.hist(garcia_jab_poi, 14, density=True)
plt.title("Garcia Jabs/Rd")

plt.subplot(236, sharex=ax3, sharey=ax1)
plt.hist(garcia_pow_poi, 14, density=True)
plt.title("Garcia Power Punches/Rd")


plt.tight_layout()


A look at actual thrown performance v expectations
In [3]:
spence_total_thrown = [46, 55, 75, 89, 86, 95, 70, 102, 121, 125, 118, 100]
spence_jabs_thrown = [39, 43, 53, 61, 62, 56, 50, 60, 56, 58, 45, 35]
spence_power_thrown = [7, 12, 22, 28, 24, 39, 20, 42, 65, 67, 73, 65]

garcia_total_thrown = [12, 28, 31, 35, 41, 43, 26, 41, 32, 62, 15, 40]
garcia_jabs_thrown = [9, 13, 18, 20, 17, 19, 10, 22, 17, 25, 2, 16]
garcia_power_thrown = [3, 15, 13, 15, 24, 24, 16, 19, 15, 37, 13, 24]
A tale of two jabs: Spence pumped out that lead left at a ridiculous rate, neutralizing Garcia while setting-up the rest of his own offense
In [4]:
def chance_of_throwing_GE(sim, act):
    return [np.sum(sim >= x)/len(sim) for x in  act]

spence_comp_thrown = [(spence_tot_poi, spence_total_thrown), (spence_jab_poi, spence_jabs_thrown), (spence_pow_poi, spence_power_thrown)]

garcia_comp_thrown = [(garcia_tot_poi, garcia_total_thrown), (garcia_jab_poi, garcia_jabs_thrown), (garcia_pow_poi, garcia_power_thrown)]


print("SPENCE")
for spence in spence_comp_thrown:
    spence_perf = chance_of_throwing_GE(spence[0], spence[1])
    print(spence_perf, np.mean(spence_perf))

print("\nGARCIA")
for garcia in garcia_comp_thrown:
    garcia_perf = chance_of_throwing_GE(garcia[0], garcia[1])
    print(garcia_perf, np.mean(garcia_perf))
SPENCE
[0.9912, 0.882, 0.0963, 0.0015, 0.005, 0.0001, 0.2386, 0.0, 0.0, 0.0, 0.0, 0.0] 0.18455833333333335
[0.093, 0.0245, 0.0001, 0.0, 0.0, 0.0, 0.0009, 0.0, 0.0, 0.0, 0.011, 0.2537] 0.031933333333333334
[1.0, 1.0, 0.9827, 0.8285, 0.9537, 0.1682, 0.9959, 0.0747, 0.0, 0.0, 0.0, 0.0] 0.5003083333333334

GARCIA
[1.0, 1.0, 0.9997, 0.9969, 0.9615, 0.9309, 1.0, 0.9615, 0.9992, 0.1232, 1.0, 0.9713] 0.9120166666666667
[1.0, 0.9999, 0.9971, 0.9905, 0.9981, 0.995, 1.0, 0.9725, 0.9981, 0.9089, 1.0, 0.9991] 0.9882666666666666
[1.0, 0.927, 0.978, 0.927, 0.283, 0.283, 0.8865, 0.6958, 0.927, 0.0008, 0.978, 0.283] 0.6807583333333332
What about contact? "Everyone's gotta plan until they get hit."
In [5]:
s_plot = 1

fig = plt.figure(figsize=(16,6))

for stat in ((406, .298, "Garcia total", 75), (188, .209, "Garcia jabs", 21), (218, .431, "Garcia power", 54)):
    n, p, category, N = stat[0], stat[1], stat[2], stat[3]
    x = np.arange(binom.ppf(0.025, n, p),
                  binom.ppf(0.975, n, p))

    sim_bouts = 10000

    print("95 percent range for %s: \t" % category, int(np.min(x)), " - ", int(np.max(x)))
    print("\t %s actually landed: \t" % category, N)
    print("\t prob of landing this %s count or less:" % category,
          "{0:.0f}%".format(np.sum(np.random.binomial(n, p, sim_bouts) < N)/float(sim_bouts) * 100))

    ax = fig.add_subplot(1,3,s_plot)
    ax.plot(x, binom.pmf(x, n, p), 'ro', ms=5, label='binom pmf')
    plt.title(category)
    ax.vlines(x, 0, binom.pmf(x, n, p), colors='r', lw=5, alpha=0.5)
    ax.vlines(N, 0, np.max(binom.pmf(x, n, p)), lw=3, linestyles=":")
    s_plot += 1

plt.tight_layout()
plt.show()
95 percent range for Garcia total: 	 103  -  138
	 Garcia total actually landed: 	 75
	 prob of landing this Garcia total count or less: 0%
95 percent range for Garcia jabs: 	 29  -  49
	 Garcia jabs actually landed: 	 21
	 prob of landing this Garcia jabs count or less: 0%
95 percent range for Garcia power: 	 80  -  107
	 Garcia power actually landed: 	 54
	 prob of landing this Garcia power count or less: 0%

Both fighters had their rates affected but while Mikey fell off the chart, almost literally and in a bad sense, Spence's superiour activity with the jab allowed him to set up and deliver the power punches, especially in volume over the second half of the bout
In [6]:
s_plot = 1

fig = plt.figure(figsize=(16,6))

for stat in ((1082, .343, "Spence total", 345), (618, .198, "Spence jabs", 108), (464, .480, "Spence power", 237)):
    n, p, category, N = stat[0], stat[1], stat[2], stat[3]
    x = np.arange(binom.ppf(0.025, n, p),
                  binom.ppf(0.975, n, p))

    sim_bouts = 10000

    print("95 percent range for %s: \t" % category, int(np.min(x)), " - ", int(np.max(x)))
    print("\t %s actually landed: \t" % category, N)
    print("\t prob of landing this %s count or less:" % category,
          "{0:.0f}%".format(np.sum(np.random.binomial(n, p, sim_bouts) < N)/float(sim_bouts) * 100))

    ax = fig.add_subplot(1,3,s_plot)
    ax.plot(x, binom.pmf(x, n, p), 'go', ms=5, label='binom pmf')
    plt.title(category)
    ax.vlines(x, 0, binom.pmf(x, n, p), colors='g', lw=5, alpha=0.5)
    ax.vlines(N, 0, np.max(binom.pmf(x, n, p)), lw=3, linestyles=":")
    s_plot += 1

plt.tight_layout()
plt.show()
95 percent range for Spence total: 	 341  -  401
	 Spence total actually landed: 	 345
	 prob of landing this Spence total count or less: 4%
95 percent range for Spence jabs: 	 103  -  141
	 Spence jabs actually landed: 	 108
	 prob of landing this Spence jabs count or less: 7%
95 percent range for Spence power: 	 202  -  243
	 Spence power actually landed: 	 237
	 prob of landing this Spence power count or less: 90%

One more look at thrown punches
In [7]:
def standardized_fight_night(sim_rds, poi_lambda, n_times, act):
    act_rds = len(act)
    fight_night_zscore = np.zeros(act_rds)

    for i in range(n_times):
        fight_night_zscore += zscore(np.append(np.random.poisson(poi_lambda, sim_rds), act))[-act_rds:]

    return fight_night_zscore/n_times

spence_total_zscore = standardized_fight_night(60, 64, 100, spence_total_thrown)
spence_total_zscore
Out[7]:
array([-1.42441765, -0.84977684,  0.42720275,  1.32108846,  1.12954152,
        1.70418233,  0.10795785,  2.15112519,  3.36425579,  3.61965171,
        3.17270886,  2.02342723])
In [8]:
garcia_total_zscore = standardized_fight_night(60, 53, 100, garcia_total_thrown)
garcia_total_zscore
Out[8]:
array([-3.40959768, -1.96473539, -1.69382371, -1.33260814, -0.79078479,
       -0.610177  , -2.14534318, -0.79078479, -1.60351982,  1.10559696,
       -3.138686  , -0.88108868])
In [9]:
plt.plot(spence_total_zscore, garcia_total_zscore, 'go')
Out[9]:
[<matplotlib.lines.Line2D at 0x245153e6f98>]

In [ ]: