Sanitizing Data
Often data is messy. In our case we have two problems with the data.
- values are missing
- not in a format easy to do machine learning on.
Machine Learning algorithms and in general all statistics algorithms like arrays.
In [116]:
import json
from collections import defaultdict
import re

import pandas as pd
import numpy as np
import requests

def convert_dict_to_pandas_frame(data, dict_frames):
    data_columns = defaultdict(list)
    for d in data.values():
        for key in dict_frames:
            subkey = d
            subkeys = dict_frames[key].split('.')
            for k in subkeys:
                if re.match(r'\d+', k) and subkey is not None:
                    index = int(k)
                    if index >= len(subkey):
                        subkey = None
                    else:
                        subkey = subkey[index]
                else:
                    if subkey is not None:
                        subkey = subkey.get(k)
            data_columns[key].append(subkey)
    df = pd.DataFrame.from_dict(data_columns)
    return df.set_index('material_id')
In [117]:
## data will not be available locally so we need to download it
# data = json.load(open('../data/mpdata.json'))
data = requests.get('https://gitlab.com/costrouc/mse-machinelearning-notebooks/raw/master/data/mpdata.json').json()
print('Number of materials', len(data))
Number of materials 6928
If we look at one of the materials we can see that the data is not in the best format.
In [6]:
first_key = next(iter(data))
data[first_key]
Out[6]:
{'energy': -4.0645998,
 'energy_per_atom': -4.0645998,
 'volume': 11.852765009390795,
 'formation_energy_per_atom': 0.03469247000000042,
 'nsites': 1,
 'unit_cell_formula': {'Cu': 1.0},
 'pretty_formula': 'Cu',
 'is_hubbard': False,
 'elements': ['Cu'],
 'nelements': 1,
 'e_above_hull': 0.03469247000000042,
 'hubbards': {},
 'is_compatible': True,
 'spacegroup': {'source': 'spglib',
  'symbol': 'Im-3m',
  'number': 229,
  'point_group': 'm-3m',
  'crystal_system': 'cubic',
  'hall': '-I 4 2 3'},
 'task_ids': ['mp-998890',
  'mp-998895',
  'mp-998898',
  'mp-998906',
  'mp-1056211',
  'mp-1056219',
  'mp-1056226',
  'mp-1056233'],
 'band_gap': 0.0,
 'density': 8.902615866613178,
 'icsd_id': None,
 'icsd_ids': [183263],
 'cif': "# generated using pymatgen\ndata_Cu\n_symmetry_space_group_name_H-M   'P 1'\n_cell_length_a   2.48779079\n_cell_length_b   2.48779079\n_cell_length_c   2.48779079\n_cell_angle_alpha   109.47122063\n_cell_angle_beta   109.47122063\n_cell_angle_gamma   109.47122063\n_symmetry_Int_Tables_number   1\n_chemical_formula_structural   Cu\n_chemical_formula_sum   Cu1\n_cell_volume   11.85276501\n_cell_formula_units_Z   1\nloop_\n _symmetry_equiv_pos_site_id\n _symmetry_equiv_pos_as_xyz\n  1  'x, y, z'\nloop_\n _atom_site_type_symbol\n _atom_site_label\n _atom_site_symmetry_multiplicity\n _atom_site_fract_x\n _atom_site_fract_y\n _atom_site_fract_z\n _atom_site_occupancy\n  Cu  Cu1  1  0.000000  0.000000  0.000000  1\n",
 'total_magnetization': -7e-07,
 'material_id': 'mp-998890',
 'oxide_type': 'None',
 'tags': ['Copper', 'High pressure experimental phase'],
 'elasticity': {'G_Reuss': -17.960241741427517,
  'G_VRH': 19.06895589595666,
  'G_Voigt': 56.098153533340835,
  'G_Voigt_Reuss_Hill': 19.06895589595666,
  'K_Reuss': 145.87229552135727,
  'K_VRH': 145.87229552135733,
  'K_Voigt': 145.87229552135736,
  'K_Voigt_Reuss_Hill': 145.87229552135733,
  'elastic_anisotropy': -20.617315830427692,
  'elastic_tensor': [[137.0, 150.0, 150.0, -0.0, 0.0, 0.0],
   [150.0, 137.0, 150.0, 0.0, -0.0, -0.0],
   [150.0, 150.0, 137.0, -0.0, 0.0, -0.0],
   [-0.0, 0.0, -0.0, 98.0, 0.0, 0.0],
   [0.0, -0.0, 0.0, 0.0, 98.0, 0.0],
   [0.0, -0.0, -0.0, 0.0, 0.0, 98.0]],
  'homogeneous_poisson': 0.43736737340081105,
  'poisson_ratio': 0.43736737340081105,
  'universal_anisotropy': -20.617315830427692,
  'elastic_tensor_original': [[137.23435775103798,
    150.17225544048853,
    150.20736652133866,
    0.0,
    0.00570621333333458,
    -0.0016961700000014818],
   [150.17956449887507,
    137.23059429293244,
    150.20736652133866,
    0.0011605700000007649,
    0.00553183666666768,
    -0.001712109999999591],
   [150.17956449887507,
    150.17225544048853,
    137.26733472684245,
    0.0,
    0.0056197499999995045,
    -0.0018734200000007824],
   [0.0, 0.0, 0.0, 97.81118299333336, 0.0, 0.0],
   [0.0, 0.0, 0.0, 0.0, 97.81105978333335, 0.0],
   [0.0, 0.0, 0.0, 0.0, 0.0, 97.81082478666669]],
  'nsites': 1,
  'compliance_tensor': [[-50.7, 26.5, 26.5, -0.0, -0.0, 0.0],
   [26.5, -50.7, 26.5, 0.0, -0.0, -0.0],
   [26.5, 26.5, -50.7, -0.0, 0.0, -0.0],
   [-0.0, 0.0, -0.0, 10.2, 0.0, 0.0],
   [-0.0, -0.0, 0.0, 0.0, 10.2, 0.0],
   [0.0, -0.0, -0.0, 0.0, 0.0, 10.2]]},
 'full_formula': 'Cu1'}
Always aim to convert your data to a tabular form first
In [118]:
key_map = {
    'material_id': 'material_id',
    'energy': 'energy',
    'volume': 'volume',
    'nsites': 'nsites',
    'energy_per_atom': 'energy_per_atom',
    'pretty_formula': 'pretty_formula',
    'spacegroup': 'spacegroup.number',
    'band_gap': 'band_gap',
    'density': 'density',
    'total_magnetization': 'total_magnetization',
    # Elacticity
    'poisson_ratio': 'elasticity.poisson_ratio',
    'bulk_modulus_voigt': 'elasticity.K_Voigt',
    'bulk_modulus_reuss': 'elasticity.K_Reuss',
    'bulk_modulus_vrh': 'elasticity.K_VRH',
    'shear_modulus_voigt': 'elasticity.G_Voigt',
    'shear_modulus_vrh': 'elasticity.G_VRH'
}

df = convert_dict_to_pandas_frame(data, key_map)
In [119]:
df.info()
<class 'pandas.core.frame.DataFrame'>
Index: 6928 entries, mp-998890 to mp-30883
Data columns (total 15 columns):
energy                 6928 non-null float64
volume                 6928 non-null float64
nsites                 6928 non-null int64
energy_per_atom        6928 non-null float64
pretty_formula         6928 non-null object
spacegroup             6928 non-null int64
band_gap               6928 non-null float64
density                6928 non-null float64
total_magnetization    6928 non-null float64
poisson_ratio          896 non-null float64
bulk_modulus_voigt     896 non-null float64
bulk_modulus_reuss     896 non-null float64
bulk_modulus_vrh       896 non-null float64
shear_modulus_voigt    896 non-null float64
shear_modulus_vrh      896 non-null float64
dtypes: float64(12), int64(2), object(1)
memory usage: 866.0+ KB
In [120]:
df.sample(5)
Out[120]:
| energy | volume | nsites | energy_per_atom | pretty_formula | spacegroup | band_gap | density | total_magnetization | poisson_ratio | bulk_modulus_voigt | bulk_modulus_reuss | bulk_modulus_vrh | shear_modulus_voigt | shear_modulus_vrh | |
|---|---|---|---|---|---|---|---|---|---|---|---|---|---|---|---|
| material_id | |||||||||||||||
| mvc-15868 | -102.229807 | 182.562400 | 20 | -5.111490 | ZnCoO3 | 62 | 0.0000 | 6.270250 | 4.401870 | NaN | NaN | NaN | NaN | NaN | NaN |
| mp-714908 | -278.665566 | 451.645416 | 42 | -6.634894 | Fe10O11 | 2 | 0.5045 | 5.400573 | 2.000009 | NaN | NaN | NaN | NaN | NaN | NaN |
| mp-2327 | -58.231276 | 518.171632 | 34 | -1.712685 | TiZn16 | 63 | 0.0000 | 7.014325 | 0.000033 | 0.341793 | 79.294827 | 78.599764 | 78.947295 | 29.014697 | 27.925264 |
| mvc-12563 | -183.252030 | 324.836376 | 28 | -6.544715 | Mn2ZnO4 | 59 | 0.2972 | 4.892780 | 32.000000 | NaN | NaN | NaN | NaN | NaN | NaN |
| mp-1038987 | -19.747382 | 310.753063 | 12 | -1.645615 | CaMg5 | 38 | 0.0000 | 1.727083 | -0.000737 | NaN | NaN | NaN | NaN | NaN | NaN |
In [121]:
# write the data to a csv file
df.to_csv('../data/mpdata.csv')
Lets Explore the Data
Exploring the data is important.
In [88]:
# how many materials are we looking at?
len(df)
Out[88]:
6928
In [87]:
# look at most common spacegroups
df['spacegroup'].value_counts()[:25]
Out[87]:
1      680
14     584
2      452
12     314
62     291
8      251
15     208
63     205
166    160
225    158
221    155
194    146
123    117
227    110
61     102
74      99
5       96
139     88
19      86
4       83
160     81
33      72
6       72
186     71
11      69
Name: spacegroup, dtype: int64
In [115]:
# band gaps
print('how many are metals?', len(df[df['band_gap'] == 0.0]), '/', len(df))
print('material with highest band gap', df['band_gap'].max(), df.loc[df['band_gap'].idxmax()]['pretty_formula'])

condition = (df['band_gap'] > 0.0) & (df['band_gap'] < 10)
df[condition]['band_gap'].plot.hist(bins=100)
how many are metals? 2270 / 6928
material with highest band gap 17.8914 He
Out[115]:
<matplotlib.axes._subplots.AxesSubplot at 0x7fb214ddf780>

In [100]:
# cohesive energies
df['energy'].plot.hist(bins=100)
Out[100]:
<matplotlib.axes._subplots.AxesSubplot at 0x7fb215dcb518>

In [79]:
conditions = (df['shear_modulus_vrh'] > 0) & (df['shear_modulus_vrh'] < 500) & \
             (df['bulk_modulus_vrh'] > 0) & (df['bulk_modulus_vrh'] < 500) & \
             (df['poisson_ratio'] > 0) & (df['poisson_ratio'] < 0.5)
In [142]:
# shear modulus vrh of metals vs nonmetals

is_metal = df['band_gap'] == 0.0
is_not_metal = df['band_gap'] > 0.0
bins = 10**np.linspace(0, 2.7, 25) # 10^2.7 ~ 500
ax = df[conditions & is_not_metal]['shear_modulus_vrh'].plot.hist(bins=bins, alpha=0.5, density=True)
ax = df[conditions & is_metal]['shear_modulus_vrh'].plot.hist(ax=ax, bins=bins, color='red', alpha=0.5, density=True)
ax.set_xscale('log')

In [82]:
bins = 10**np.linspace(0, 2.7, 25) # 10^2.7 ~ 500
ax = df[conditions]['shear_modulus_vrh'].plot.hist(bins=bins)
ax.set_xscale('log')

In [83]:
bins = 10**np.linspace(0, 2.7, 25)
ax = df[conditions]['bulk_modulus_vrh'].plot.hist(bins=bins)
ax.set_xscale('log')

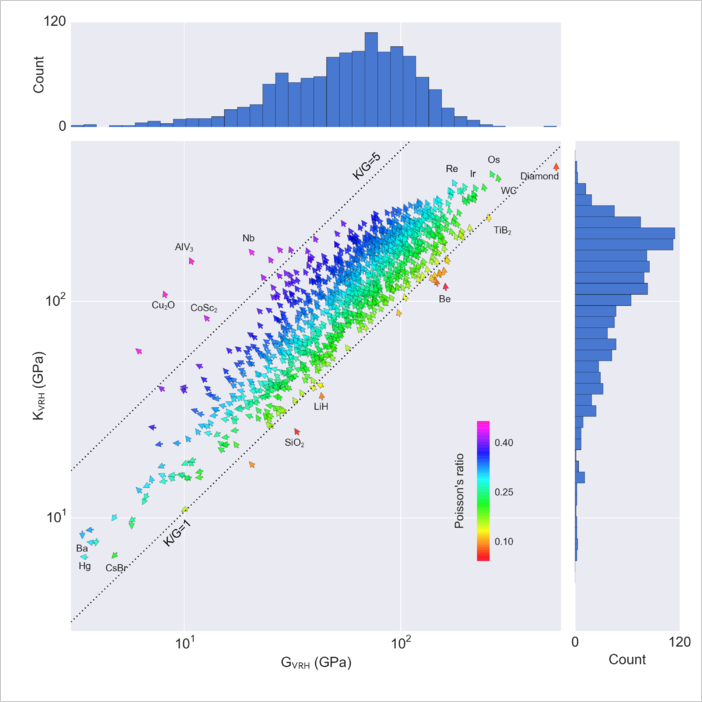
In [84]:
ax = df[conditions].plot(kind='scatter', x='shear_modulus_vrh', y='bulk_modulus_vrh', c='poisson_ratio')
ax.set_xscale('log')
ax.set_yscale('log')

Compare with publication from materials project.
In [ ]: