Conformance Checking / In the Lab
Chapter 6 - Processes In Action: Event Data
In this notebook, we will explore how we can prepare data from an information system to the format that we need for conformance checking: event logs.
First, we need to load some data. We use the publicly available event data that was made available for the Business Process Intelligence Challenge 2016 (BPIC'16).
Prerequisites
- You should be able to follow the steps along this notebook. If you need further help, take a look at the documentation of jupyter notebooks, or search for other tutorials online.
- You need Python 3 to run this notebook. There are many guides and tutorials, on how to set up Python 3 on common operating systems.
- We strongly encourage you to run this notebook locally (to have better performance and faster processing).
Running this notebook locally, you need to make sure that the requirements are installed:
- Hint: create a virtual environment for this purpose. See Creating virtual environments in Python
- Then, a
pip install -r requirements.txtshould do the trick.
Usage Tips & Hints:
- Use "Shift + Return" to execute a cell and proceed to the next.
- We will loosely follow the phases from the process model for data mining (e.g. Crisp-DM). In general, taking a step back and doing a bit of research on how to best approach a task is a good idea.

Business Understanding
Before we start digging into the data, we first should understand the business where the data is coming from. Which process produced the data? Because we'll use the data provided in the BPIC'16 challenge, we are already given a preliminary explanation on the BPIC'16 website:
UWV (Employee Insurance Agency) is an autonomous administrative authority (ZBO) and is commissioned by the Ministry of Social Affairs and Employment (SZW) to implement employee insurances and provide labour market and data services in the Netherlands. The Dutch employee insurances are provided for via laws such as the WW (Unemployment Insurance Act), the WIA (Work and Income according to Labour Capacity Act, which contains the IVA (Full Invalidity Benefit Regulations), WGA (Return to Work (Partially Disabled) Regulations), the Wajong (Disablement Assistance Act for Handicapped Young Persons), the WAO (Invalidity Insurance Act), the WAZ (Self-employed Persons Disablement Benefits Act), the Wazo (Work and Care Act) and the Sickness Benefits Act.
The data in this collection pertains to customer contacts over a period of 8 months and UWV is looking for insights into their customers' journeys. Data has been collected from several different sources, namely:
- Clickdata from the site www.werk.nl collected from visitors that were not logged in,
- Clickdata from the customer specific part of the site www.werk.nl (a link is made with the customer that logged in),
- Werkmap Message data, showing when customers contacted the UWV through a digital channel,
- Call data from the callcenter, showing when customers contacted the call center by phone, and
- Complaint data showing when customers complained.
All data is accompanied by data fields with anonymized information about the customer as well as data about the site visited or the contents of the call and/or complaint. The texts in the dataset are provided in both Dutch and English where applicable. URL's are included based on the structure of the site during the period the data has been collected. UWV is interested in insights on how their channels are being used, when customers move from one contact channel to the next and why and if there are clear customer profiles to be identified in the behavioral data. Furthermore, recommendations are sought on how to serve customers without the need to change the contact channel.
We'll use the data from the first source: 1) clickdata from visitors that were not logged in.
Also take a look at the website where the data is collected from, reading up on some results that other researchers got from the data, would be another idea to get a better business understanding.
However, let us now move on and focus on the data and how to transform it to the format that we need.
Data Understanding
- Step 1 and Step 2 are optional and can also be manually done outside of this notebook.
Step 1) Download the data
We first fetch the data from the 4TU Datacenter servers. Note that the data is 150MB compressed and ~1GB uncompressed. So make sure you have an appropriate internet connection before running the script below.
This script uses the Python 3 programming language to show the basics of manipulating data.
import pathlib
import shutil
import tempfile
import urllib.request
import os

import pandas as pd
import numpy as np
DATA_URL = 'http://data.4tu.nl/repository/uuid:01345ac4-7d1d-426e-92b8-24933a079412/DATA1?download=true'
FILENAME_ZIPPED = 'DATABPI2016_Clicks_Logged_In.csv.zip'
if os.path.exists(FILENAME_ZIPPED):
    print('Data already downloaded.')
else:
    print("Downloading about 150MB of data. This can take some while depending on your connection")

    with urllib.request.urlopen(DATA_URL) as response:
        with open(FILENAME_ZIPPED, 'wb') as f:
            shutil.copyfileobj(response, f)
    print("Done.")
Step 2) Unzip the data
You can download and install the python zip module, or you can skip this step and simply unpack the zip file in your file explorer.
UNPACKED_FOLDER = 'data'
import zipfile

with zipfile.ZipFile(FILENAME_ZIPPED, 'r') as zip_ref:
    zip_ref.extractall(UNPACKED_FOLDER)
Step 3) Loading the data and inspecting the data
Once we have the data at hand, the first thing to do is look at it and understand it. Let's open it! and display some rows. From the filename we can conclude that it is stored as "comma serarated values" in a table format. Let's see
extracted_folder = pathlib.Path(UNPACKED_FOLDER)
# List files that we unpacked before:
for filename in extracted_folder.iterdir():
    print(filename)
filename
Let's open the first 10 lines of the file:
df = pd.read_csv(str(filename), nrows=10)
df.head()
This does not look right. The data is separated by semicolon ';' not a comma ','
We need to explicitly set the separator.
df = pd.read_csv(str(filename), nrows=10, sep=';')
print('This looks better:')
df.head()
Let's see the column names
df.columns
Let's recap the essential information in this file:
We know from the description that these are customer journeys recorded on the website of the unemployment office werk.nl.
Furthermore, we can deduce from this first glance at the data the following answers:
- Who is the customer? Which data identifies the case here? The columns
CustomerIDandSessionIDare relevant. - When did the events occur? The
TIMESTAMPcolumn has the information we need. - What did the customers do? The
IPIDand thePAGE_NAMEindicate the page that was viewed.
Step 4) Data type conversion
Inspect the inferred types in the data frame. Here, you can read up on pandas data types.
df.dtypes
Storing temporal information as strings is not a good idea.
We want to be able to perform numeric calculations (durations, min, max, etc.) efficiently.
The TIMESTAMP column should be converted to the datetime type.
print('Current type of TIMESTAMP column: {}'.format(type(df['TIMESTAMP'][0])))
df['TIMESTAMP'] = df['TIMESTAMP'].astype('datetime64[ns]')
print('Type of TIMESTAMP column after conversion: {}'.format(type(df['TIMESTAMP'][0])))
Step 5) Digging deeper into the data
We got a glance at the structure, now let's get a feeling for the contents and statistics in the data.
df_10k = pd.read_csv(str(filename), nrows=10000, sep=';')
clicks_per_customer_10k = df_10k[['CustomerID','IPID']].groupby(by=['CustomerID']).count()
Let's see some statistics for the 10000 first rows
We load the plotting library matplotlib to display the histograms and similar plots in the notebook.
import matplotlib.pyplot as plt
print('Average page clicks per customer {:.2f}'.format(clicks_per_customer_10k.mean()[0]))
print('Median page clicks per customer {:.2f}'.format(clicks_per_customer_10k.median()[0]))
_ = clicks_per_customer_10k.hist(bins=40)
It seems there are some "power users" with a lot of interactions with the site, while the most customers are visiting a few pages.
Half of the customers visit less than 4 pages.
Let's load the complete dataset, to see if the first 10,000 rows represent the remaining customers.
df = pd.read_csv(str(filename), sep=';')
Oh snap! An encoding error.. ("Schei� Encoding")
it seems the data provider didn't use utf-8 to encode the data.
Fortunately, we can get rid of it with specifying the European encoding ISO-8859-1 for this dataset.
df = pd.read_csv(str(filename), sep=';', encoding='iso-8859-1')
df.shape
Alright, we've loaded about 7.2M rows into the memory.
Note: If you see some errors about mixed types here, you can just ignore them for this notebook.
Convert the timestamp column on the full dataset
df['TIMESTAMP'] = df['TIMESTAMP'].astype('datetime64[ns]')
Let's retry the aggregation of visits by customer
clicks_per_customer = df[['CustomerID','IPID']].groupby(by=['CustomerID']).count()
clicks_per_customer.describe()
hist = clicks_per_customer.hist(bins=40)
print('Factor of clicks average increase in large data set with respect to the first 10k rows: {:.3}x'.format(clicks_per_customer.mean()[0] / clicks_per_customer_10k.mean()[0]))
Note:
There is a large increase in average and median from the first 10000 rows to the complete dataset.
This indicates that the unit of analysis should be the SessionID instead.
As we see here, the process of data exploration is iterative, and we constantly move back and forth between hypothesizing and validation of these hypotheses.
Next, let's look at the sessions per customer
sessions_per_customer = df[['CustomerID','SessionID', 'IPID']].groupby(by=['CustomerID','SessionID']).count()
sessions_per_customer.describe()
That's interesting. It says that 50% of the customers have 6 sessions or less, while some customers frequented the site a significant number od times.
Let's also look at the duration and length of a customer journey inside a session
session_times = df[['CustomerID','SessionID', 'TIMESTAMP']].groupby(by=['CustomerID','SessionID'])
session_durations = session_times.max() - session_times.min()
session_df = pd.concat([session_durations.describe(), session_times.count().describe()], axis=1)
session_df.columns = ['Session_Duration', 'Clicks']
session_df
That means, the shortest session is 0 seconds, which means, there was only one interaction and the customer left the site again, while the longest is 577, which hints at a customer really spending a lot of time on the site possibly searching for a new employment.
Step 6) Convert Data to Event logs
So, we've got a first glimpse into the data, the length of sessions and how many clicks we can expect. Let's convert this into an event log.
To keep things simple, we can think of an event log as a collection of cases, which themselves are a collection of events. We need to use lists to represent the variable length of an event log.
Let's convert the data into lists. We think that it makes sense to split the user interactions by the sessions. That is, we deliberately add the assumption to the data that a (returning) customer entering a new session starts the process again from the start.
Verify/Validate, if we can simply use the SessionID as the case identifier:
We expect that if we group by the session id, we always get exactly one customerID.
customers_per_session = df[['SessionID','CustomerID']].groupby('SessionID').CustomerID.nunique()
print('All recorded sessions have exactly one customer: {}'.format(np.all(customers_per_session == 1)))
print('Max customers sharing the same SessionID: {}'.format(customers_per_session.max()))
print('Percentage of sessions with exactly one customer id: {:.2%}'.format((customers_per_session == 1).mean()))
Unfortunately, no...
This means that there is some session where the CustomerID changed meanwhile, or that the session ids are not unique and later in time the same session id can be reused for another customer.
As a consequence, using the SessionID alone can lead to wrong results, as we might mix up the cases of different customers. Additionally, we might get into trouble if we had more data over time and the session ids keep repeating.
In essence, we need to construct our own case id. Here, we simply combine the CustomerID and the SessionID with a minus -.
# Sort the data according to the customers and their sessions:
df.sort_values(by=['CustomerID', 'SessionID', 'TIMESTAMP'], inplace=True)
df.reset_index(drop=True, inplace=True)
df.head()
df['CaseID'] = df['CustomerID'].map(str) + '@' + df['SessionID'].map(str)
from collections import defaultdict
Let's convert the events to an event log.
But we limit ourselves to only 100k events here.
You can experiment with converting more. But be aware that the code below is not very efficient. You'll see that we need around half a minute on a decent laptop in the next cell. The %%time annotation measures the execution time and prints a nice summary at the end.
%%time

log = defaultdict(list)
for i, row in df[:100000].iterrows():
    event = dict(row)
    event['id'] = i
    log[row['CaseID']].append(event)
print('Converted {} traces into an event log'.format(len(log)))
Step 7) Serialize the Event Log
Now the event log is already in a structure that we expect: A collection of lists of events.
We can now serialize it to XES. Traversal of the data structure works as follows:
count = 0
for caseID in log:
    count += 1
    if count > 3:
        break

    print('\n\nCase {} has {} events. Showing only 2:\n'.format(caseID, len(log[caseID])))

    # print first two events per case
    for event in log[caseID][:2]:
        print(event)
        print(event['TIMESTAMP'].replace(tzinfo=datetime.timezone.utc).isoformat())
        pass
Reusing some XES snippets of this script from the jiraview project, the serialization is simply done by instantiating these templates with our log contents.
file_header = """
<?xml version="1.0" encoding="UTF-8" ?>
<log xes.version="1.0" xes.features="arbitrary-depth" xmlns="http://www.xes-standard.org/">
    <extension name="Lifecycle" prefix="lifecycle" uri="http://www.xes-standard.org/lifecycle.xesext"/>
    <extension name="Organizational" prefix="org" uri="http://www.xes-standard.org/org.xesext"/>
    <extension name="Time" prefix="time" uri="http://www.xes-standard.org/time.xesext"/>
    <extension name="Concept" prefix="concept" uri="http://www.xes-standard.org/concept.xesext"/>
    <extension name="Semantic" prefix="semantic" uri="http://www.xes-standard.org/semantic.xesext"/>
    <global scope="trace">
        <string key="concept:name" value="__INVALID__"/>
    </global>
    <global scope="event">
        <string key="concept:name" value="__INVALID__"/>
        <string key="lifecycle:transition" value="complete"/>
    </global>
    <classifier name="MXML Legacy Classifier" keys="concept:name lifecycle:transition"/>
    <classifier name="Event Name" keys="concept:name"/>
    <classifier name="Resource" keys="org:resource"/>
    <string key="concept:name" value="{logname}"/>
    <string key="description" value="Log file serialized from Python"/>
    <string key="lifecycle:model" value="standard"/>
""".strip()

file_footer = """</log>"""

trace_start = """
<trace>
        <string key="concept:name" value="{key}"/>
        <string key="description" value="{tracetype}"/>
""".strip()

trace_end = """</trace>"""

event_template = """
<event>
    <string key="org:resource" value="{system}"/>
    <date key="time:timestamp" value="{when}"/>
    <string key="concept:name" value="{what}"/>
    <string key="lifecycle:transition" value="complete"/>
</event>
""".strip()
def write_structure_to_file(filename, log, event_type='Clickdata'):
    print('Starting to serialize {}!'.format(filename))
    with open(filename, 'w') as f:
        f.write(file_header.format(logname = event_type+'-Log'))

        for caseID in log:
            f.write(trace_start.format(key = caseID, tracetype=event_type))
            for event in log[caseID]:
                f.write(event_template.format(system = event['VHOST'], when = event['TIMESTAMP'].replace(tzinfo=datetime.timezone.utc).isoformat(), what = event['PAGE_NAME']))
            f.write(trace_end)
        f.write(file_footer)
    print('Finished serializing {}!'.format(filename))
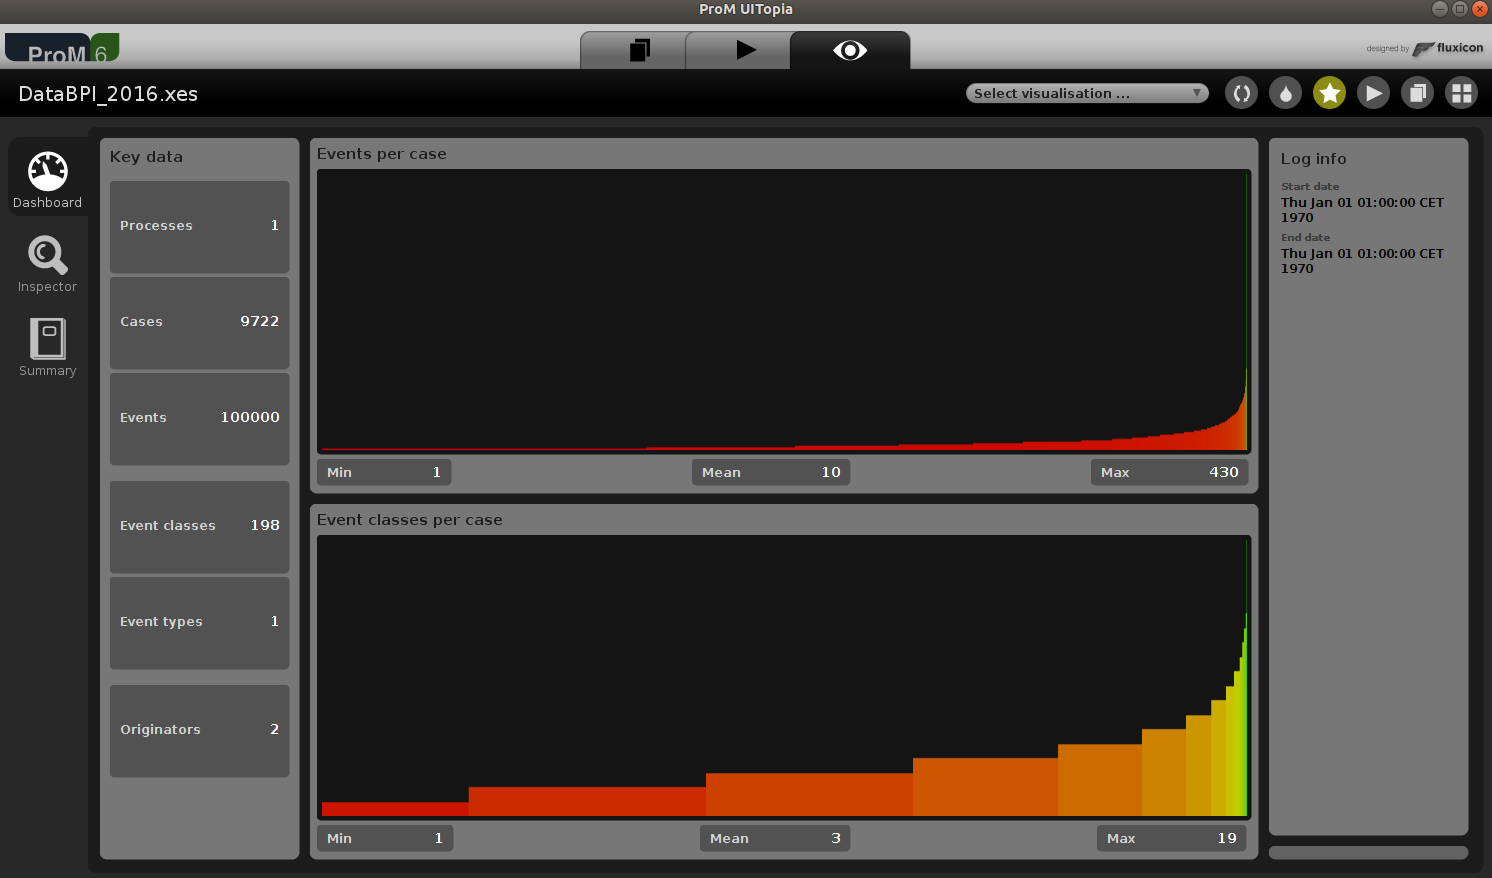
write_structure_to_file('DataBPI_2016.xes', log)
Well done!
This notebook introduced you to the basics of dealing with event data. We took some raw data, analyzed it to gain some insights, identified the case id, which was not obvious, and serialized the data in the XES format for further processing.
Now we can load the event log into ProM or other tools and use it for conformance checking!
Exercises or Where to go from here?
First, open the created log in your favorite process mining framework, or in ProM, which is freely available and open source.
Here are some exercises, that you can do to improve this notebook and get some hands on experience in converting data into event logs:
- Add the AgeCategory as an additional field for the export.
Hint: Add a<string key="..." value="..."/>XML element to every serialized<event>. - a) There is more information available on the trace level. Can you identify which fields can be added to the XES
<traces>?
b) How can you verify that the fields are indeed on the trace level? - The timezones are not correctly managed in the export script. Can you fix them?
- Improve the performance of the conversion / serialization (e.g. by using Cython - tips on embedding Cython in Jupyter or numba)
- Your own ideas, on how to improve turning data into event logs...