Recap your python skills
BMED360-2021 00-recap-python.ipynb
Learning outcome:
- Construct simple functions for editing of strings
- Build a
train_test_splitterfrom scratch
For using Colab
--> (some of) the following libraries must be pip installed (i.e. uncommet these among the following pip commands):
# These might not be necessary to pip install on colab:
#!pip install matplotlib
#!pip install gdown
#!pip install envoy
#!pip install sklearn
Download compressed file with data, assets, and solutions from Google Drive using gdown
import gdown
import shutil
import os
import sys
if os.path.isdir('./assets') == False:
    import envoy

    ## Download 'data_assets_sol_utils.tgz' for Google Drive
    # https://drive.google.com/file/d/1rCGmA2K_Q1TcgYz4VIR-SvXwdxw5zqbh/view?usp=sharing

    # https://drive.google.com/file/d/1rCGmA2K_Q1TcgYz4VIR-SvXwdxw5zqbh/view?usp=sharing


    file_id = '1rCGmA2K_Q1TcgYz4VIR-SvXwdxw5zqbh/view?usp=sharing'
    url = 'https://drive.google.com/uc?id=%s' % file_id
    output = './data_assets_sol_utils.tar.gz'
    gdown.download(url, output, quiet=False)

    ## Untar the data_assets_sol_utils.tar.gz file into `./assets` `./data` `./solutions` and `utils.py`
    shutil.unpack_archive(output, '.')
    #envoy.run("tar xzf %s -C %s" % (output, .))
    !tar zxvf data_assets_sol_utils.tar.gz .

    ## Delete the 'data_assets_sol_utils.tgz' file
    os.remove(output)
else:
    print(f'./assets  exists already!')
./assets exists already!
Ex0.1. Write a function splitter which inputs a string and breaks that string into substrings separated by \.
For instance
splitter("C:\Users\Peter")
should return the list
["C:", "Users", "Peter"]
Note: You will have to find out yourself what string method to apply. Use whatever means possible (the Tab trick, the internet...) to find a solution.
Hint: you will likely get a formatting error, because "\" has a special function in string (escape character). Use a raw string instead: r"\", or "\\".
# %load solutions/ex0_1.py
# run this to test your code
st = r"C:\Users\Peter"
splitter(st)
['C:', 'Users', 'Peter']
Ex0.2. Modify the function to be more flexible, so it can decide what kind of separator to use.
# %load solutions/ex0_2.py
st = r"GivenName_FamilyName"
splitter2(st, '_')
['GivenName', 'FamilyName']
Ex0.3. Modify the code to take not a single, but a list of strings and perform the action on each one of them.
# %load solutions/ex0_3.py
sts = [r"C:\Users\Peter",
       r"C:\Users\arvid\GitHub\computational-medicine\BMED360-2021"]

splitter3(sts)
[['C:', 'Users', 'Peter'],
 ['C:', 'Users', 'arvid', 'GitHub', 'computational-medicine', 'BMED360-2021']]
Data representation, numpy and matrices
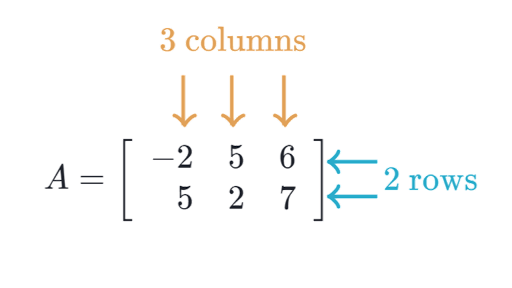
A dataset can usually be represented in a tabular format. The convenvtion is to have the rows representing an individual sample, and the columns are features. This corresponds to a matrix of shape rows x columns.
from IPython.display import Image
Image(url="https://cdn.kastatic.org/googleusercontent/_anqPXDhdx2MuQIN7S9F-nYDbxNVMFfrKL-bgihYpi1iqa-bi5Gggwy8k70xZgZ0j84IzMKQDg2VusdRgoUens4", width=500, height=500)
# numpy and pandas are two of the most ubiquitous python libraries, so get used to seeing this.
import pandas as pd #this is used for working with tables
import numpy as np #this is used for working with matrices and vectors
diabetes = 'data/diabetes.csv' # provide the path of the dataset
df = pd.read_csv(diabetes) # this loads the file into memory

print(type(df))
<class 'pandas.core.frame.DataFrame'>
df.head() # displays the 5 first rows
| pregnancies | glucose | diastolic | triceps | insulin | bmi | dpf | age | diabetes | |
|---|---|---|---|---|---|---|---|---|---|
| 0 | 6 | 148 | 72 | 35 | 0 | 33.6 | 0.627 | 50 | 1 |
| 1 | 1 | 85 | 66 | 29 | 0 | 26.6 | 0.351 | 31 | 0 |
| 2 | 8 | 183 | 64 | 0 | 0 | 23.3 | 0.672 | 32 | 1 |
| 3 | 1 | 89 | 66 | 23 | 94 | 28.1 | 0.167 | 21 | 0 |
| 4 | 0 | 137 | 40 | 35 | 168 | 43.1 | 2.288 | 33 | 1 |
Note that the rightmost column represents the diagnosis (what we consider the target or label). This is our y.
The values attribute of a dataframe (table) returns the numpy matrix of the entries.
data = df.values
print(type(data))
data
<class 'numpy.ndarray'>
array([[  6.   , 148.   ,  72.   , ...,   0.627,  50.   ,   1.   ],
       [  1.   ,  85.   ,  66.   , ...,   0.351,  31.   ,   0.   ],
       [  8.   , 183.   ,  64.   , ...,   0.672,  32.   ,   1.   ],
       ...,
       [  5.   , 121.   ,  72.   , ...,   0.245,  30.   ,   0.   ],
       [  1.   , 126.   ,  60.   , ...,   0.349,  47.   ,   1.   ],
       [  1.   ,  93.   ,  70.   , ...,   0.315,  23.   ,   0.   ]])
# shape is a fundamental attribute of a matrix. The convention is (rows x cols). This is important!
print(data.shape)

# so the size (N) of the dataset is just
print(f"Sample size = {data.shape[0]}")
(768, 9)
Sample size = 768
Indexing works as follows for matrices (or tables):
4. We are gonna build a train_test_splitter from scratch.
Ex0.4a. Make a function which inputs a number and a percentage, and reduces that number by the that percentage.
Note: the output should be rounder to the closest integer.
# %load solutions/ex0_4a.py
Ex0.4b. Make a function which splits a list of numbers from 0-N into two subsets of variable size.
In other words, we want the output to be two lists, such that they in total contain all the numbers from 0 to N. Their relative size should be adjustable by using a parameter p, as a percentage.
Hint: use np.random.choice
Ex0.4b. Provided an array of indeces, make a function data_splitter which returns the rows corresponding to those indexes.
# %load solutions/ex0_4b.py
indeces = np.array([0,2]) # select the first and third row
print(data_splitter(data, indeces))
[[  6.    148.     72.     35.      0.     33.6     0.627  50.      1.   ]
 [  8.    183.     64.      0.      0.     23.3     0.672  32.      1.   ]]
Ex0.4c. Provided an integer N, write a function get_indeces which splits the numbers (0-N) into two non-overlapping subsets (e.g. training indeces and test indeces).
You should be able to call it like get_indeces(N, p), where p is the proportion (between 0 and 1) determining the relative size of the training set.
Hint: start by creating a vector of the integers 0-N using np.arange(N).
# %load solutions/ex0_4c.py
# test your implementation
get_indeces(10, .8)
(array([0, 1, 2, 3, 4, 5, 6, 7]), array([8, 9]))
Problem: what if the data is ordered based on label? Make the selection random.
Ex0.4d. Now chain it all together into a single function tts.
It should take two inputs: the data matrix and p, and return two numpy arrays, one containing the training samples, one containing the test samples.
# %load solutions/ex0_4d.py
# test your implementation
train, test = tts(data)
print(train.shape,'\n',test.shape)
(576, 9)
 (192, 9)
Ex0.4e. Final adjustment: we want to separate X from y also. Edit the function above to return the values X_train, y_train, X_test, y_test.
Remember that the label (y) is the last column.
# %load solutions/ex0_4e.py
# Run this to test. Do the results make sense?

X_train, X_test, y_train, y_test = tts(data)
for d in [X_train, y_train, X_test, y_test]:
    print(d.shape)
(576, 8)
(576,)
(192, 8)
(192,)