
Get running the full Hyy analysis using the 13 TeV dataset in 5 minutes!
Introduction The analysis is based on the 13 TeV Open Data. The ATLAS note ATL-OREACH-PUB-2020-001 can be used as a guide on the content, properties, capabilities and limitations of the released datasets.
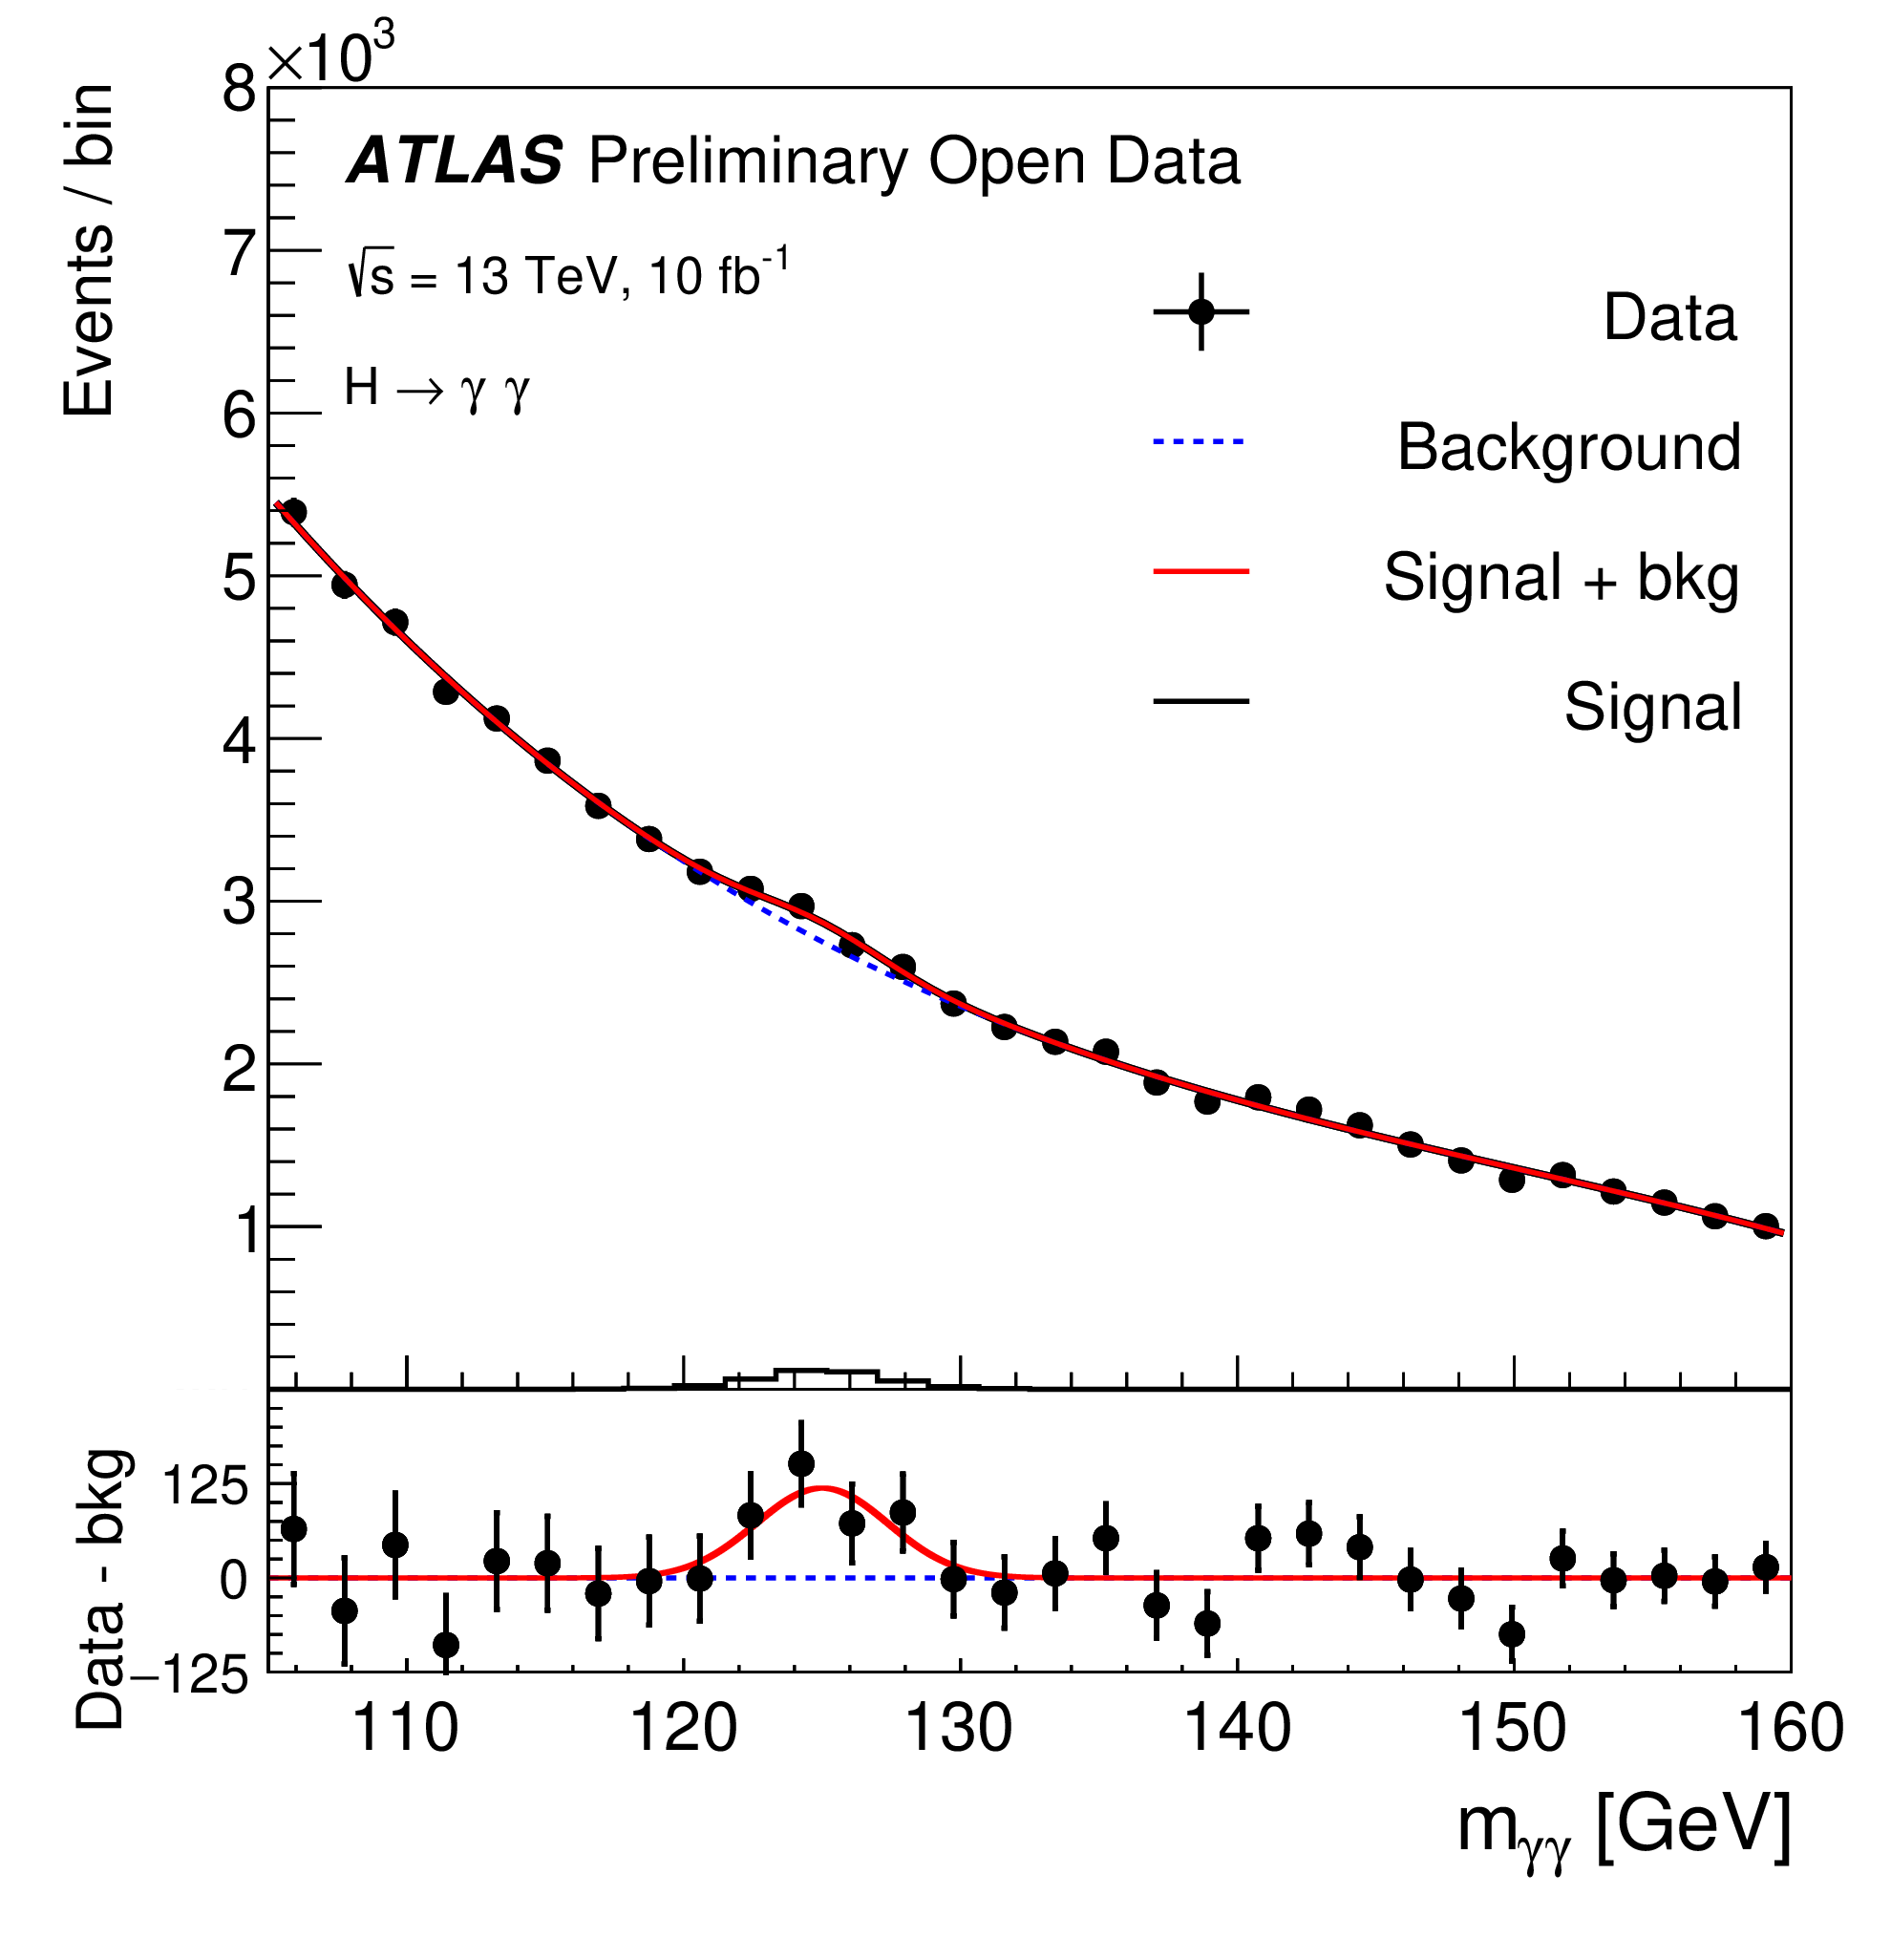
In the following, in about 5 minutes we are going to re-produce the H->yy analysis plots from the note.
import os
import ROOT
from ROOT import TMath
import time
start = time.time()
First, we will download from github the 13 TeV C++ analysis software
myCmd = os.popen('ls -lhrt').read()
print(myCmd)
in case it already exists, remove it
folder_demo = 'atlas-demo-Hyy'
command1 = 'rm -rf '+folder_demo
os.system(command1)
myCmd = os.popen('ls -lhrt').read()
print(myCmd)
folder_demo = 'atlas-demo-Hyy'
command1 = 'mkdir '+folder_demo
os.system(command1)
Show the contents in the current folder, and checck your new folder is there
myCmd = os.popen('ls -lhrt').read()
print(myCmd)
Get into the folder which we just created
os.chdir(folder_demo+"/")
Print the current path and check that you are really there
myCmd = os.popen('pwd').read()
print(myCmd)
Clone the analysis code (do this only once!)
myCmd = os.popen('git clone https://github.com/atlas-outreach-data-tools/atlas-outreach-cpp-framework-13tev.git').read()
print(myCmd)
Get into the folder which contains the analysis code
os.chdir("atlas-outreach-cpp-framework-13tev/")
myCmd = os.popen('ls -lhrt').read()
print(myCmd)
let's create the output folders do it once
command3 = "./welcome_web.sh"
os.system(command3)
os.chdir("Analysis/HyyAnalysis")
myCmd = os.popen('pwd').read()
print(myCmd)
myCmd = os.popen('ls -lhrt').read()
print(myCmd)
Check that the directory Output_HyyAnalysis is there! If not, create it
#command1 = 'mkdir Output_HyyAnalysis'
#os.system(command1)
Now, we will execute the C++ analysis code. It will take some time (less than 5mins)
First, we will run over MC samples
command4 = "./run_web.sh"
os.system(command4)
Now the analysis is done
Inside that directory Output_HyyAnalysis you will find the output root file: data.root
myCmd = os.popen('ls -lhrt Output_HyyAnalysis/*').read()
print(myCmd)
Now we will run over MC samples
command4 = "./run_web2.sh"
os.system(command4)
only if there are 5 root files, you can proceed with plotting
myCmd = os.popen('ls -lhrt Output_HyyAnalysis/*').read()
print(myCmd)
Let's run the Plotting code
os.chdir("../../Plotting/")
myCmd = os.popen('pwd').read()
print(myCmd)
myCmd = os.popen('ls -lhrt').read()
print(myCmd)
Check that the directory histograms is there! If not, create it
#command5 = 'mkdir histograms/'
#os.system(command5)
command5 = "./plotme_Hyyweb.sh"
os.system(command5)
myCmd = os.popen('ls -lhrt histograms/*png').read()
print(myCmd)
The two photons invariant mass

end = time.time()
duration = end-start
print("Finished in {} min {} s".format(int(duration//60),int(duration%60))) # Python3
Finally, you can compare it to the ATLAS plot from a published paper that uses 3 times more data!
