Jupyter notebooks
Important shortcuts:
- run and move to next cell: shift + return
- run and stay on same cell: alt + return
- insert cell below: ctrl + m, then b (or then a for "above")
Two modes:
- insert mode
- edit mode
Getting Help
- Shortcuts: press h in edit mode
- press tab inside method calls (press tab again to see more):
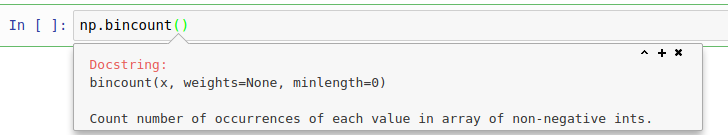
- use "?" and run cell
In [ ]:
import numpy as np
In [ ]:
np.bincount()
In [ ]:
np.bincount?
Exercise:
Use the help to find out what the options to np.unique are.
Use np.unique to convert the array ['one', 'two', 'three', 'one', 'two', 'three'] into the array [0, 2, 1, 0, 2, 1].
In [ ]:
ar = ['one', 'two', 'three', 'one', 'two', 'three']
# your solution here
Plotting with matplotlib
Need to use either
% matplotlib inline
or
% matplotlib notebook
Only one in each notebook!
using inline will just sent png images to browser, using notebook will provide
interactivity and allow updating old figures.
With notebook you need to make sure to create a new figure before plotting, otherwise the last one will be updated!
In [ ]:
%matplotlib notebook
import matplotlib.pyplot as plt

X = np.random.normal(size=(12, 2))
plt.scatter(X[:, 0], X[:, 1])
In [ ]:
plt.plot(X[:, 0])
In [ ]:
# create a new figure
plt.figure()
plt.plot(X[:, 0])
Exercise
Create a new figure and plot a sin wave. You can use np.linspace to create equally spaced numbers in a given range.
Best practices for data analysis in Jupyter
- use standard imports
- don't
import * - be mindful of the state in the notebook!
In [ ]:
x = 1
In [ ]:
x = x + 1
In [ ]:
print(x)
Avoid cells you can't run again:
In [ ]:
data = {'a': [1, 2, 3], 'b': [999, 1, 2]}
In [ ]:
column_a = data.pop('a')
In [ ]:
print(column_a)
print(data)
Not mutating variables helps
In [ ]:
x = 1
In [ ]:
x2 = x + 1
In [ ]:
print(x2)
Exercise
Rewrite the code for the data dict above so that you don't mutate data, but that the print stays the same.
In [ ]:
# solution Here