
Numpy
Unidata AMS 2021 Student Conference
Focuses
- Using this notebook we will become familiar with Numpy
- Learn basic usage of numpy arrays instead of lists
- We will use numpy to organize and manipulate data
- Plot data from a numpy array Matplotlib
Objectives
Imports
import matplotlib.pyplot as plt
import numpy as np
1. Numpy gymnastics
Below is a list of integers that is 20 elements long.
integers = [11, -47, 39, 21, -5, -27, -33, 18, -9, 12, 14, -44, 10, 25, 18, -16, -19, 22, 44, 23]
print(len(integers))
print(type(integers))
Let's say we need to add 20 to every element in this list. How can we do this? Typically, this would be done with a For loop.
integers_plus_20 = [] # This will be our new list of integers after we add 20 to each element
for i in integers: # This will loop through each element in our list
    new_integer = i + 20 # At each elememnt we add 20
    integers_plus_20.append(new_integer) # Now append this new element to our new list
print(integers_plus_20)
This took us 4 lines of code and a print statement to make sure all was going right. You can imagine that for a more complicated set of operations that this code can quickly inflate, leaving lots of room for error. A faster and easier way to do operations on a whole list at once is to use numpy.
To use numpy we can declare our list of integers as a numpy array using the np.array() function
numpy_array_of_integers = np.array(integers)
print(numpy_array_of_integers)
print(type(numpy_array_of_integers))
Now that we are working with a numpy array, let's try to perform the same operation: adding 20 to each element in our numpy array.
numpy_array_plus_20 = numpy_array_of_integers + 20
print(numpy_array_plus_20)
You can see that using numpy we only need one line of code plus a print statement to get the same result. The benefit of numpy is that we can manipulate data much more quickly and efficiently using numpy arrays compared to native lists.
2. Working with multidimensional data
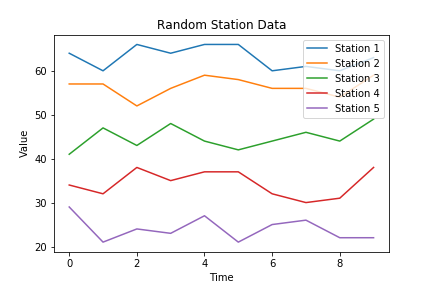
Under this objective, we will see how numpy arrays can help us handle multidimensional data. Below are random values that we will pretend are temperatures from 5 different stations. We can generate random data using numpy.
# below we have 10 random measurements of temperature at 5 stations
station_1 = np.random.randint(low=60, high=70, size=10)
station_2 = np.random.randint(low=50, high=60, size=10)
station_3 = np.random.randint(low=40, high=50, size=10)
station_4 = np.random.randint(low=30, high=40, size=10)
station_5 = np.random.randint(low=20, high=30, size=10)

# If we composite all of these stations in a list, we then have a list with 5 elements, each with 10 measurements.
station_data_list = [station_1, station_2, station_3, station_4, station_5]

# Finally, we declare our list as a numpy array
station_data_np_array = np.array(station_data_list)

# Print the shape of the station data numpy array
print(np.shape(station_data_np_array))
Perfect! The shape is (5, 10): 5 for each of the stations and 10 because we have 10 measurements for each station. Numpy also makes matrix operations very easy in python. If we wanted to swap the rows and columns we can use the np.transpose() function.
station_data_np_transpose = np.transpose(station_data_np_array)
print(np.shape(station_data_np_transpose))
plt.plot(station_data_np_transpose)
station_labels = ['Station 1', 'Station 2', 'Station 3', 'Station 4', 'Station 5']
StationPlots = plt.plot(station_data_np_transpose, label=station_labels)
plt.legend(iter(StationPlots), station_labels, loc=1)
plt.title('Random Station Data')
plt.ylabel('Value')
plt.xlabel('Time')