Data Manipulation with Pandas
The pandas package for Python offers a set of powerful tools for working with tabular data. The name pandas is originally derived from the common term "panel data." While different programmers pronounce the package name in different ways, I prefer to pronounce it like the plural of "panda [bears]". I then imagine a small army of adorable bears performing my computations for me.

The first step when working with pandas is always to import it:
import pandas as pd
CSV Data, Revisited
A few weeks ago, we discussed some tools for reading CSV data from files using the csv module. pandas is usually a better choice for reading (and working with) CSV data. To read a CSV file from data, we use the function pd.read_csv(). First, the following code block will place a copy of our data into the current working directory.
import urllib

url = "https://philchodrow.github.io/PIC16A/datasets/palmer_penguins.csv"
filedata = urllib.request.urlopen(url)
to_write = filedata.read()

with open("palmer_penguins.csv", "wb") as f:
    f.write(to_write)
Next, we can read in the the file as a DataFrame:
penguins = pd.read_csv("palmer_penguins.csv")
type(penguins)
pandas.core.frame.DataFrame
Now let's inspect our new DataFrame:
penguins
| studyName | Sample Number | Species | Region | Island | Stage | Individual ID | Clutch Completion | Date Egg | Culmen Length (mm) | Culmen Depth (mm) | Flipper Length (mm) | Body Mass (g) | Sex | Delta 15 N (o/oo) | Delta 13 C (o/oo) | Comments | |
|---|---|---|---|---|---|---|---|---|---|---|---|---|---|---|---|---|---|
| 0 | PAL0708 | 1 | Adelie Penguin (Pygoscelis adeliae) | Anvers | Torgersen | Adult, 1 Egg Stage | N1A1 | Yes | 11/11/07 | 39.1 | 18.7 | 181.0 | 3750.0 | MALE | NaN | NaN | Not enough blood for isotopes. |
| 1 | PAL0708 | 2 | Adelie Penguin (Pygoscelis adeliae) | Anvers | Torgersen | Adult, 1 Egg Stage | N1A2 | Yes | 11/11/07 | 39.5 | 17.4 | 186.0 | 3800.0 | FEMALE | 8.94956 | -24.69454 | NaN |
| 2 | PAL0708 | 3 | Adelie Penguin (Pygoscelis adeliae) | Anvers | Torgersen | Adult, 1 Egg Stage | N2A1 | Yes | 11/16/07 | 40.3 | 18.0 | 195.0 | 3250.0 | FEMALE | 8.36821 | -25.33302 | NaN |
| 3 | PAL0708 | 4 | Adelie Penguin (Pygoscelis adeliae) | Anvers | Torgersen | Adult, 1 Egg Stage | N2A2 | Yes | 11/16/07 | NaN | NaN | NaN | NaN | NaN | NaN | NaN | Adult not sampled. |
| 4 | PAL0708 | 5 | Adelie Penguin (Pygoscelis adeliae) | Anvers | Torgersen | Adult, 1 Egg Stage | N3A1 | Yes | 11/16/07 | 36.7 | 19.3 | 193.0 | 3450.0 | FEMALE | 8.76651 | -25.32426 | NaN |
| ... | ... | ... | ... | ... | ... | ... | ... | ... | ... | ... | ... | ... | ... | ... | ... | ... | ... |
| 339 | PAL0910 | 120 | Gentoo penguin (Pygoscelis papua) | Anvers | Biscoe | Adult, 1 Egg Stage | N38A2 | No | 12/1/09 | NaN | NaN | NaN | NaN | NaN | NaN | NaN | NaN |
| 340 | PAL0910 | 121 | Gentoo penguin (Pygoscelis papua) | Anvers | Biscoe | Adult, 1 Egg Stage | N39A1 | Yes | 11/22/09 | 46.8 | 14.3 | 215.0 | 4850.0 | FEMALE | 8.41151 | -26.13832 | NaN |
| 341 | PAL0910 | 122 | Gentoo penguin (Pygoscelis papua) | Anvers | Biscoe | Adult, 1 Egg Stage | N39A2 | Yes | 11/22/09 | 50.4 | 15.7 | 222.0 | 5750.0 | MALE | 8.30166 | -26.04117 | NaN |
| 342 | PAL0910 | 123 | Gentoo penguin (Pygoscelis papua) | Anvers | Biscoe | Adult, 1 Egg Stage | N43A1 | Yes | 11/22/09 | 45.2 | 14.8 | 212.0 | 5200.0 | FEMALE | 8.24246 | -26.11969 | NaN |
| 343 | PAL0910 | 124 | Gentoo penguin (Pygoscelis papua) | Anvers | Biscoe | Adult, 1 Egg Stage | N43A2 | Yes | 11/22/09 | 49.9 | 16.1 | 213.0 | 5400.0 | MALE | 8.36390 | -26.15531 | NaN |
344 rows × 17 columns
penguins.shape # (rows, columns)
(344, 17)
penguins.dtypes # data type of each column.
studyName               object
Sample Number            int64
Species                 object
Region                  object
Island                  object
Stage                   object
Individual ID           object
Clutch Completion       object
Date Egg                object
Culmen Length (mm)     float64
Culmen Depth (mm)      float64
Flipper Length (mm)    float64
Body Mass (g)          float64
Sex                     object
Delta 15 N (o/oo)      float64
Delta 13 C (o/oo)      float64
Comments                object
dtype: object
A data type of object means that pandas isn't sure what kind of data are in the corresponding columns. This is very common when the columns contain strings. It is possible to give string columns a dedicated data type, but we won't focus on that here.
A pleasant way to get a quick overview of the numerical columns in your data set is the describe method.
penguins.describe()
| Sample Number | Culmen Length (mm) | Culmen Depth (mm) | Flipper Length (mm) | Body Mass (g) | Delta 15 N (o/oo) | Delta 13 C (o/oo) | |
|---|---|---|---|---|---|---|---|
| count | 344.000000 | 342.000000 | 342.000000 | 342.000000 | 342.000000 | 330.000000 | 331.000000 |
| mean | 63.151163 | 43.921930 | 17.151170 | 200.915205 | 4201.754386 | 8.733382 | -25.686292 |
| std | 40.430199 | 5.459584 | 1.974793 | 14.061714 | 801.954536 | 0.551770 | 0.793961 |
| min | 1.000000 | 32.100000 | 13.100000 | 172.000000 | 2700.000000 | 7.632200 | -27.018540 |
| 25% | 29.000000 | 39.225000 | 15.600000 | 190.000000 | 3550.000000 | 8.299890 | -26.320305 |
| 50% | 58.000000 | 44.450000 | 17.300000 | 197.000000 | 4050.000000 | 8.652405 | -25.833520 |
| 75% | 95.250000 | 48.500000 | 18.700000 | 213.000000 | 4750.000000 | 9.172123 | -25.062050 |
| max | 152.000000 | 59.600000 | 21.500000 | 231.000000 | 6300.000000 | 10.025440 | -23.787670 |
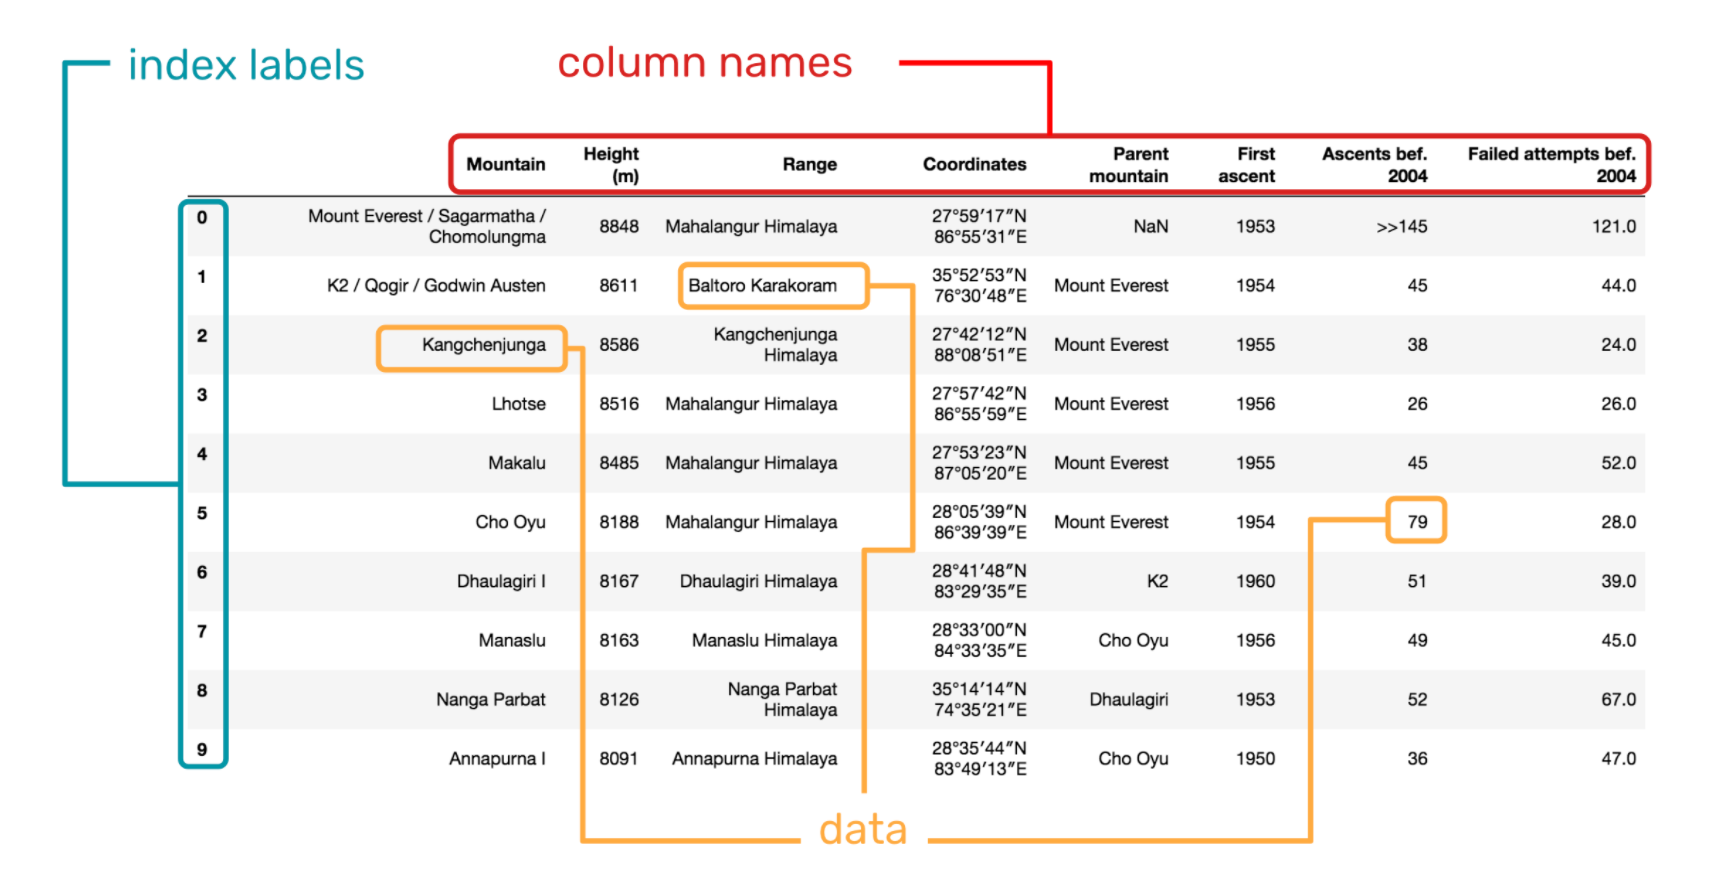
Parts of a Data Frame
When working with data frames, it's important to get comfortable with their different parts. These are:
- The index. The index is used to refer to rows. In many cases, you can think of the index as a unique numerical label for a row.
- The column names. These tell you what kinds of data appear in each row. It is important to be able to comfortably grab columns from the data frame for use in computations.
- The data itself. You can think of the data as a set of different arrays, one for each column name. Each array has the same length. Many of the methods of these arrays will be familiar from
np.arrays.
Let's now begin to look at how to obtain different parts of a data frame.
Selecting Columns
The easiest way to select a column of a data frame is to pass the name of the column to the DataFrame with [] brackets. In this way, you can think of a data frame as being similar to a dictionary whose keys are the column names.
penguins['Region']
0      Anvers
1      Anvers
2      Anvers
3      Anvers
4      Anvers
        ...
339    Anvers
340    Anvers
341    Anvers
342    Anvers
343    Anvers
Name: Region, Length: 344, dtype: object
The result is no longer a data frame, but rather a pd.Series object, which is similar to a np.array.
To select multiple columns, pass a list of column names:
penguins[['Species', 'Region', 'Island']]
| Species | Region | Island | |
|---|---|---|---|
| 0 | Adelie Penguin (Pygoscelis adeliae) | Anvers | Torgersen |
| 1 | Adelie Penguin (Pygoscelis adeliae) | Anvers | Torgersen |
| 2 | Adelie Penguin (Pygoscelis adeliae) | Anvers | Torgersen |
| 3 | Adelie Penguin (Pygoscelis adeliae) | Anvers | Torgersen |
| 4 | Adelie Penguin (Pygoscelis adeliae) | Anvers | Torgersen |
| ... | ... | ... | ... |
| 339 | Gentoo penguin (Pygoscelis papua) | Anvers | Biscoe |
| 340 | Gentoo penguin (Pygoscelis papua) | Anvers | Biscoe |
| 341 | Gentoo penguin (Pygoscelis papua) | Anvers | Biscoe |
| 342 | Gentoo penguin (Pygoscelis papua) | Anvers | Biscoe |
| 343 | Gentoo penguin (Pygoscelis papua) | Anvers | Biscoe |
344 rows × 3 columns
This time, the result is a data frame containing the specified columns.
# L1
# intro, parts of a df, select
# indexing and filter


# L2
# mutate
# group_by, summarise

# L3
# code patterns with visualization