In [ ]:
import warnings
warnings.filterwarnings("ignore")
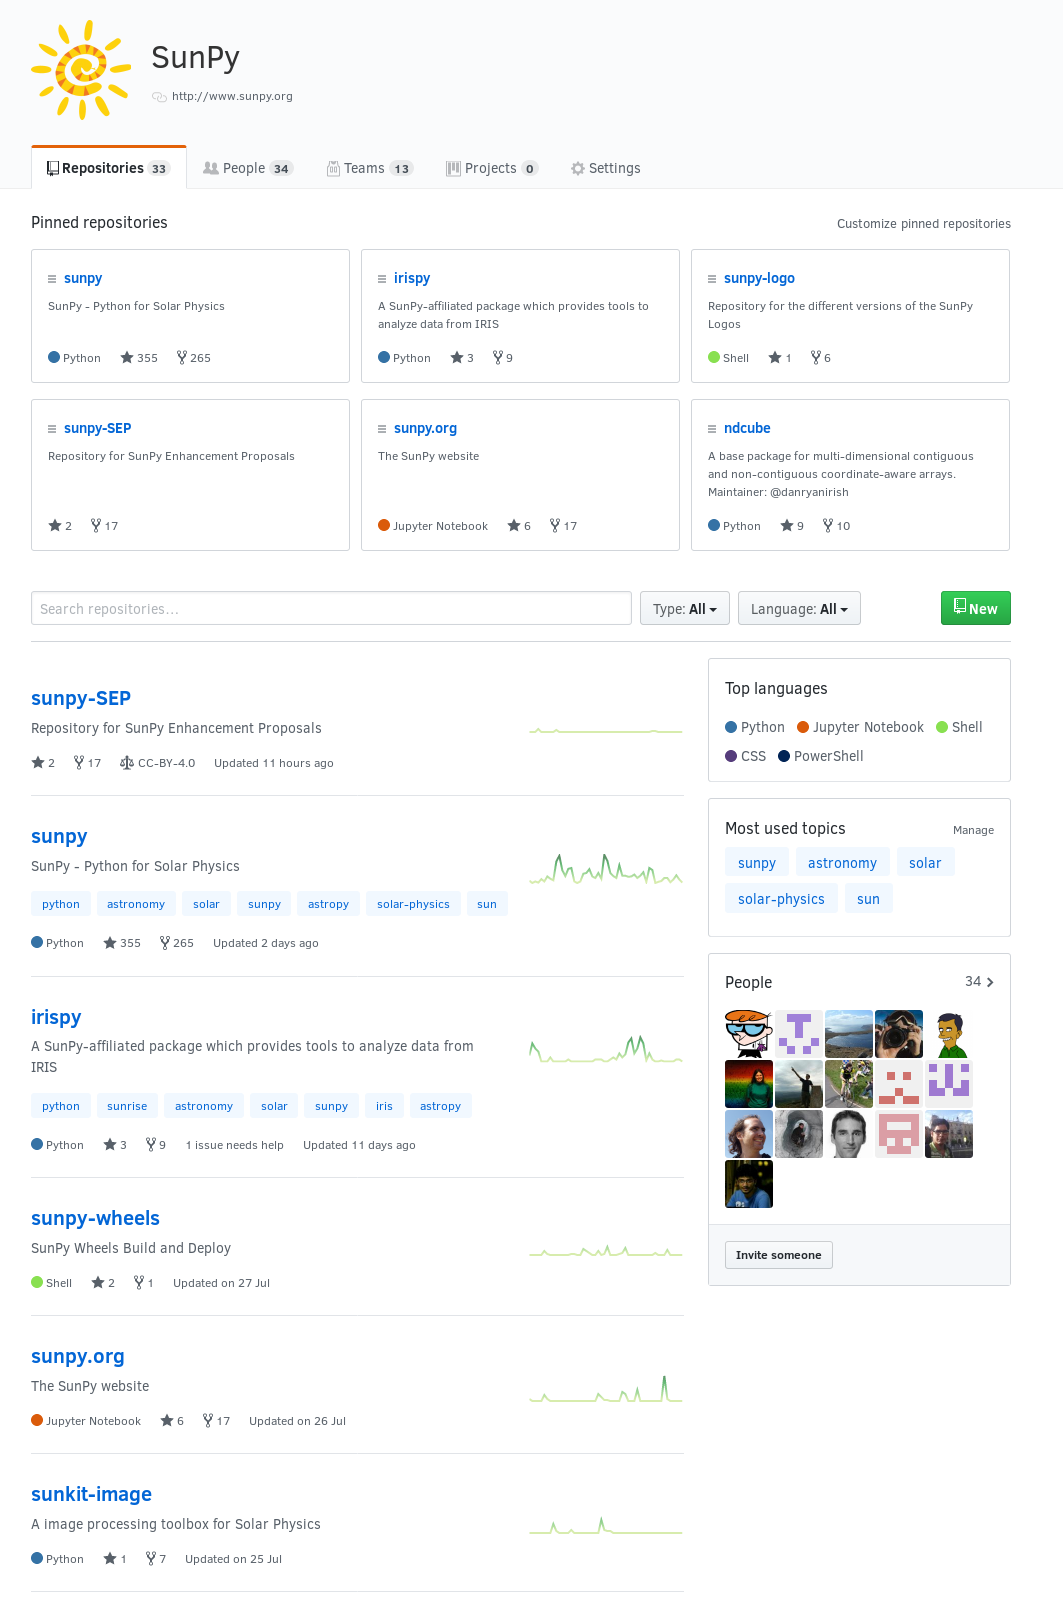
Open Source
- Publically Accessible Code
- Freedoms to run and modify the code (explicitly set by a licence)
- Free as in zero cost
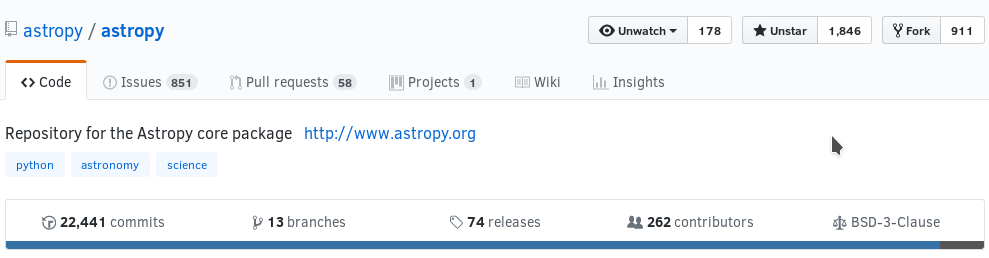
Open Development
Where the development of the code is done in the open.
Including:
- Bug reports
- Feature Requests
- Commit logs
- Code review
Enables anyone to contribute


Demos!
In [ ]:
import astropy.units as u
FITS
In [ ]:
from astropy.io import fits
In [ ]:
fits.open("/home/stuart/sunpy/data/hsi_obssumm_20121127_043.2.fits").info()
Coordinates
In [ ]:
from astropy.coordinates import SkyCoord

sc = SkyCoord.from_name("M32")
sc
In [ ]:
sc.transform_to("galactic")
Modeling
In [ ]:
%matplotlib inline
import matplotlib.pyplot as plt
import numpy as np
import matplotlib as mpl
mpl.rcParams["figure.figsize"] = [9, 6]
In [ ]:
from astropy.modeling.models import Gaussian1D
from astropy.modeling import fitting
In [ ]:
np.random.seed(42)
g1 = Gaussian1D(1, 0, 0.2)
g2 = Gaussian1D(2.5, 0.5, 0.1)
x = np.linspace(-1, 1, 200)
y = g1(x) + g2(x) + np.random.normal(0., 0.2, x.shape)
In [ ]:
plt.plot(x, y, "o")
In [ ]:
m2 = Gaussian1D(amplitude=1, mean=0, stddev=0.1) + Gaussian1D(amplitude=2, mean=0.5, stddev=0.1)
fitter = fitting.SLSQPLSQFitter()
gg = fitter(m2, x, y)
In [ ]:
plt.plot(x, y, "o")
plt.plot(x, gg(x))
SunPy
In [ ]:
from sunpy.data.sample import AIA_171_ROLL_IMAGE
import sunpy.map

m = sunpy.map.Map(AIA_171_ROLL_IMAGE)
m.peek()
plt.show()
Astropy and SunPy 😍
In [ ]:
import astropy.units as u
from astropy.coordinates import SkyCoord
In [ ]:
a_point = SkyCoord(200*u.arcsec, 300*u.arcsec, frame=m.coordinate_frame)
a_point
In [ ]:
im = m.plot()
ax = plt.gca()
ax.plot_coord(a_point, "o", markersize=12)
plt.show()
TimeSeries
In [ ]:
from sunpy.data.sample import GOES_XRS_TIMESERIES
In [ ]:
from sunpy.timeseries import TimeSeries
goes = TimeSeries(GOES_XRS_TIMESERIES)
goes.peek()