import panel as pn
from awesome_panel_extensions.widgets.perspective_viewer import PerspectiveViewer # Please note you need to import extensions before you run pn.extension("perspective")

# Expected to work for Panel >= 0.10
# C.f. https://github.com/holoviz/panel/issues/1529#event-3682125861
# pn.extension("perspective")

# Works for Panel < 0.10
PerspectiveViewer.config()
pn.extension()

from awesome_panel_extensions.awesome_panel import notebook
notebook.Header(folder="examples/reference/widgets", notebook="PerspectiveViewer.ipynb")
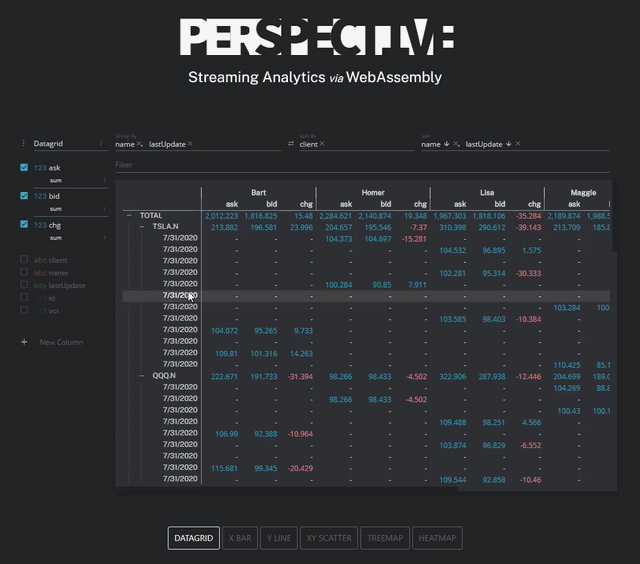
PerspectiveViewer - Reference Guide
Perspective ships with the PerspectiveViewer, which is an awesome interactive Pivot Table + Chart webcomponent. You can even use it for streaming analytics.
The PerspectiveViewer enables the use of the perspective-viewer webcomponent in Panel.
Parameters:
value(DataFrame): The data loaded to the viewer.plugin(str): Determines how to display the data. One ofhypergrid,datagrid,d3_y_bar,d3_x_bar,d3_y_line,d3_y_area,d3_y_scatter,d3_xy_scatter,d3_treemap,d3_sunburst,d3_heatmap,d3_candlestick,d3_ohlc.theme(str): Determines the style. One ofmaterial(default),material-dark,material-dense,material-dense-dark,vaporwave.columns(list): A list of source columns to show as columns. For example["x", "y"].columns_computed(list): A list of computed columns. For example ["\"x\"+\"y\""].columns_pivot(list): A list of source columns to pivot by. For example["x", "y"].rows_pivot(list): A list of source columns to group by. For example["x", "y"].aggregates(dict): How to aggregate. For example{x: "distinct count"}.sort(list): How to sort. For example[["x","desc"]].filter(list): How to filter. For example[["x", "<", 3],["y", "contains", "abc"]].
Functions
stream. Streams (appends) thestream_valueprovided to the existingvaluein an efficient manner and triggers a value changed event.patch. Patches (updates) the existing value with thepatch_valuein an efficient manner and triggers a value changed event.
The PerspectiveViewer has the same layout and styling parameters as most other widgets. For example width and sizing_mode.
Let's start by importing the dependencies
import param
import pandas as pd
import panel as pn
import time

DARK_BACKGROUND = "rgb(42, 44, 47)"
DARK_COLOR = "white"
PERSPECTIVE_LOGO = "https://perspective.finos.org/img/logo.png"
PANEL_LOGO = "https://panel.holoviz.org/_static/logo_horizontal.png"
Let's load S&P500 financials data
# Source: https://datahub.io/core/s-and-p-500-companies-financials
DATA = "https://raw.githubusercontent.com/MarcSkovMadsen/awesome-panel/master/application/pages/awesome_panel_express_tests/PerspectiveViewerData.csv"
dataframe = pd.read_csv(DATA)
Let's create a PerspectiveViewer app to display the data
dataframe.columns
Index(['Symbol', 'Name', 'Sector', 'Price', 'Price/Earnings', 'Dividend Yield',
       'Earnings/Share', '52 Week Low', '52 Week High', 'Market Cap', 'EBITDA',
       'Price/Sales', 'Price/Book', 'SEC Filings'],
      dtype='object')
COLUMNS = [
    "Name",
    "Symbol",
    "Sector",
    "Price",
    "52 Week Low",
    "52 Week High",
    "Price/Earnings",
    "Price/Sales",
    "Price/Book",
    "Dividend Yield",
    "Earnings/Share",
    "Market Cap",
    "EBITDA",
    "SEC Filings",
]
perspective_viewer = PerspectiveViewer(
    value=dataframe,
    theme="material-dark",
    columns=COLUMNS,
    sizing_mode="stretch_both",)

top_app_bar = pn.Row(
    pn.pane.PNG(PERSPECTIVE_LOGO, height=50, margin=(10, 25, 10, 10)),
    pn.layout.HSpacer(),
    margin=0,
    background=DARK_BACKGROUND,
)

settings_parameters = [
    "theme",
    "row_pivots",
    "plugin",
    "columns",
    "aggregates",
    "filters",
    "sort",
    "rows",
    "column_pivots",
]

settings_pane = pn.WidgetBox(pn.Param(
    perspective_viewer,
    parameters=settings_parameters,
    width=200,
    sizing_mode="stretch_height",
),background="#9E9E9E",)

app = pn.Column(
    pn.pane.Markdown(__doc__),
    top_app_bar,
    pn.Row(
        perspective_viewer,
        pn.layout.VSpacer(width=10),
        settings_pane,
        sizing_mode="stretch_both",
        margin=0,
        background=DARK_BACKGROUND,
    ),
    pn.layout.HSpacer(height=50),
    height=800, sizing_mode="stretch_width",
)

app
Click the three dots in the upper left corner to start the interactive exploration!
Streaming and Patching
The PerspectiveViewer supports streaming (i.e. appending) and patching (i.e. updating) data via dedicated, efficient methods
Let's try it out on a small example
SHOW_HTML = True
# pn.config.sizing_mode = "stretch_width"
data = [
    {"x": 1, "y": "a", "z": True},
    {"x": 2, "y": "b", "z": False},
    {"x": 3, "y": "c", "z": True},
    {"x": 4, "y": "d", "z": False},
]
dataframe = pd.DataFrame(data)
perspective = PerspectiveViewer(
    height=500, value=dataframe.copy(deep=True), columns=["index", "x", None, None,None], plugin="d3_xy_scatter", sizing_mode="stretch_width"
)
import random

def stream(*events):
    new_index = perspective.value.index.max()
    new_data = {"x": [random.uniform(-3, new_index)], "y": ["e"], "z": [True]}
    new_series = pd.DataFrame(data=new_data)
    perspective.stream(new_series)

stream_button = pn.widgets.Button(name="STREAM", button_type="success")
stream_button.on_click(stream)

def patch(*events):
    new_value = perspective.value.copy(deep=True)
    new_value["x"]=new_value["x"]-1
    new_value["z"]=~new_value["z"]
    perspective.patch(new_value)

patch_button = pn.widgets.Button(name="PATCH", button_type="default")
patch_button.on_click(patch)

def reset(*events):
    perspective.value = dataframe.copy(deep=True)

reset_button = pn.widgets.Button(name="RESET", button_type="default")
reset_button.on_click(reset)

pn.Column(
    top_app_bar,
    pn.Row(
        perspective,
        pn.WidgetBox(stream_button, patch_button, reset_button),
        sizing_mode="stretch_width",
    ),
    perspective.param.value,
    sizing_mode="stretch_width"
)
Known Issues
- In the Streaming Example above (and only in the notebook) the Perspective viewer does not visually update if
perspective.param.valueis removed from the app.
Roadmap
- Fix Known Issues
- Support other Dataframe types than Pandas.
- Improve implementation of streaming and patching. Currently the perspective-viewer webcomponent loads all data from scratch.
- Get this included in the Panel package.
Resources