Example of phenotypic clustering
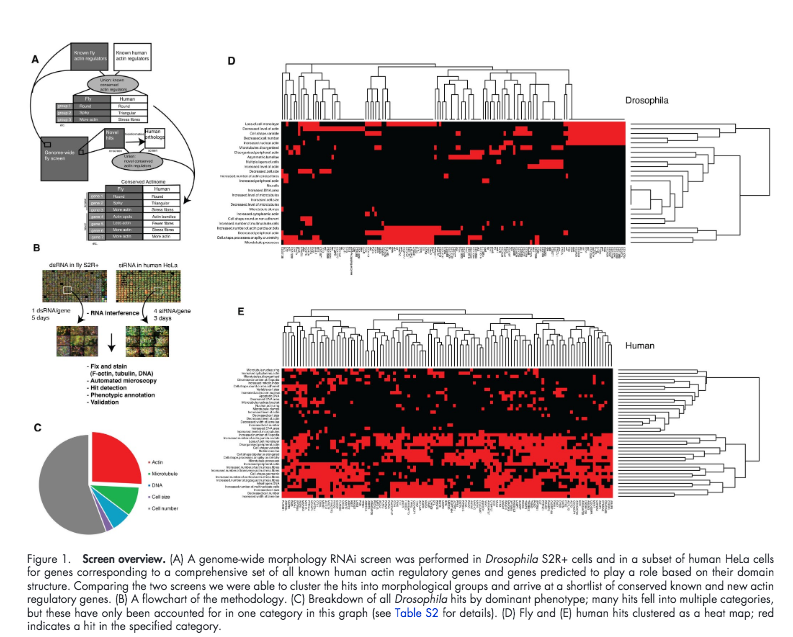
This notebook exemplifies some steps involved in working with annotations from IDR. It will build parts of Figure 1 of the paper from Rohn et al. 'Comparative RNAi screening identifies a conserved core metazoan actinome by phenotype,' see http://dx.doi.org/10.1083/jcb.201103168. Link to screen on IDR idr0008-rohn-actinome/screenB
Figure 1
Dependencies
The cell below will install dependencies if you choose to run the notebook in Google Colab.
%pip install idr-py
from IPython import get_ipython
import random
import re
import omero

import numpy as np
import matplotlib.pyplot as plt
import scipy.cluster.hierarchy as hchy

from seaborn import clustermap
from pandas import DataFrame
from idr import connection
import warnings

get_ipython().run_line_magic('matplotlib', 'inline')
plt.rcParams['image.cmap'] = 'gray'
Common variables
screenId = 206
Method definitions
def buildComposite(st, n, m, smpl=None):
    """
    nxm shots from st in a grid, as an image
    """
    nr = st.shape[0]
    nc = st.shape[1]
    if smpl is None:
        smpl = st.shape[2] // (n * m)
    res = np.zeros((nr * n, nc * m))
    for i in range(n):
        for j in range(m):
            try:
                res[i * nr: i * nr + nr,
                    j * nc: j * nc + nc] = st[:, :, (i * m + j)*smpl]
            except Exception:
                break
    return res
def getRohnTile(imid, x, y, w, h, conn, chan=0):
    """
    fetches one tile from one image
    """
    im = conn.getObject("Image", imid)
    pix = im.getPrimaryPixels()

    tile = (x, y, w, h)
    plane = pix.getTile(theZ=0, theT=0, theC=chan, tile=tile)

    return plane
def getBulkAnnotationAsDf(screenID, conn):
    ofId = None
    sc = conn.getObject('Screen', screenID)
    for ann in sc.listAnnotations():
        if isinstance(ann, omero.gateway.FileAnnotationWrapper):
            if (ann.getFile().getName() == 'bulk_annotations'):
                if (ann.getFile().getSize() > 1476250900):
                    print("that's a big file...")
                    return None
                ofId = ann.getFile().getId()
                break

    if ofId is None:
        return None

    original_file = omero.model.OriginalFileI(ofId, False)

    table = conn.c.sf.sharedResources().openTable(original_file)
    count = 0
    try:
        rowCount = table.getNumberOfRows()

        column_names = []
        pattern = re.compile(r"Phenotype \d+$")
        for col in table.getHeaders():
            column_names.append(col.name)
            if pattern.match(col.name) is not None:
                count = count + 1

        black_list = []
        column_indices = []
        for column_name in column_names:
            if column_name in black_list:
                continue
            column_indices.append(column_names.index(column_name))

        table_data = table.slice(column_indices, None)
    finally:
        table.close()

    data = []
    for index in range(rowCount):
        row_values = [column.values[index] for column in table_data.columns]
        data.append(row_values)

    dfAnn = DataFrame(data)
    dfAnn.columns = column_names
    return dfAnn, count
Connect to IDR
conn = connection('idr.openmicroscopy.org')
Connected to IDR ...
Download the annotation file for the whole screen
dfRhonAnn, phenotype_count = getBulkAnnotationAsDf(screenId, conn)
Phenotype clustering
A. Transforming phenotypes into one-hot booleans
BoolCols = []
PhenLab = []
total = phenotype_count + 1
for iphen in range(1, total):
    col = 'Phenotype ' + str(iphen)
    dfRhonAnn['Bool' + col] = ~ (dfRhonAnn[col] == '')
    BoolCols.append('Bool' + col)
    PhenLab.append(dfRhonAnn[col].unique()[1])
B. Performing the hierarchical linkage on the gene with a phenotype
# count a gene as having a phenotype
# if at least one well annotated with
# it has a phenotype
value = dfRhonAnn['Has Phenotype'] == 'yes'
phenMap = dfRhonAnn[value].groupby('Gene Symbol')[BoolCols].sum() > 0
phenMap = phenMap[phenMap.sum(axis=1) > 0]
phenMap.columns = PhenLab
phenMap.replace([False, True], [0, 1], inplace=True)
Z = hchy.linkage(phenMap, 'ward')
Zt = hchy.linkage(phenMap.transpose(), 'ward')
warnings.filterwarnings('ignore')

cg = clustermap(phenMap, row_linkage=Z, col_linkage=Zt, figsize=(10, 10))
for item in cg.ax_heatmap.get_xticklabels():
    item.set_rotation(90)
for item in cg.ax_heatmap.get_yticklabels():
    item.set_rotation(0)

Building a gallery of images for visualization
A. Gallery of tiles for several phenotypes
# hard coded, but corresponds to tile size used for CHARM features computation
X = [0, 580, 116, 348, 232, 464]
Y = [0, 348,  87, 174, 261]
ni = 15
w = 116
h = 86

# some phenotype
phs = range(20, phenotype_count - 10)

tiles = np.zeros((h, w, len(phs) * ni))
for kk, ph in enumerate(phs):
    ws = dfRhonAnn[dfRhonAnn['Phenotype ' + str(ph)] != ''].Well
    for ii in range(ni):
        we = random.choice(ws.values)
        we = conn.getObject('Well', we)
        i = we.getImage()
        x = random.choice(X)
        y = random.choice(Y)
        tiles[:, :, ii+kk*ni] = getRohnTile(i.getId(), x, y, w, h, conn,
                                            chan=1)

plt.figure(figsize=(15, 15))
imc = buildComposite(tiles, len(phs), ni)
plt.grid(False)
plt.imshow(imc)
Disconnect when done loading data
conn.close()
License (BSD 2-Clause)¶¶
Copyright (C) 2016-2021 University of Dundee. All Rights Reserved.
Redistribution and use in source and binary forms, with or without modification, are permitted provided that the following conditions are met:
Redistributions of source code must retain the above copyright notice, this list of conditions and the following disclaimer. Redistributions in binary form must reproduce the above copyright notice, this list of conditions and the following disclaimer in the documentation and/or other materials provided with the distribution. THIS SOFTWARE IS PROVIDED BY THE COPYRIGHT HOLDERS AND CONTRIBUTORS "AS IS" AND ANY EXPRESS OR IMPLIED WARRANTIES, INCLUDING, BUT NOT LIMITED TO, THE IMPLIED WARRANTIES OF MERCHANTABILITY AND FITNESS FOR A PARTICULAR PURPOSE ARE DISCLAIMED. IN NO EVENT SHALL THE COPYRIGHT OWNER OR CONTRIBUTORS BE LIABLE FOR ANY DIRECT, INDIRECT, INCIDENTAL, SPECIAL, EXEMPLARY, OR CONSEQUENTIAL DAMAGES (INCLUDING, BUT NOT LIMITED TO, PROCUREMENT OF SUBSTITUTE GOODS OR SERVICES; LOSS OF USE, DATA, OR PROFITS; OR BUSINESS INTERRUPTION) HOWEVER CAUSED AND ON ANY THEORY OF LIABILITY, WHETHER IN CONTRACT, STRICT LIABILITY, OR TORT (INCLUDING NEGLIGENCE OR OTHERWISE) ARISING IN ANY WAY OUT OF THE USE OF THIS SOFTWARE, EVEN IF ADVISED OF THE POSSIBILITY OF SUCH DAMAGE.