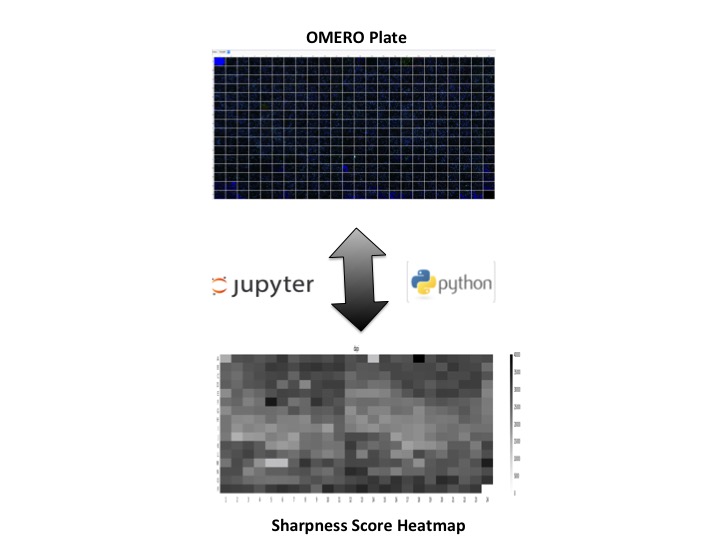
QC script to calculate sharpness metric for images in a plate
The following script will access the IDR images in a facility manager's context. The QC script does the following:
- Extracts Images from IDR (read-only)
- Calculates sharpness based on the algorithm defined
in the following publication
- Creates a numpy array of the sharpness scores for every well,
- separately for every field and every channel
- the numpy array is then reshaped to the same dimensions of the plate
e.g. 96 well plates will create an array with 8 rows and 12 columns. 4. Plots a heatmap for every field and every channel, and arranges all plots within a subplot.
Workflow summary
*Import Packages*
import string
import pandas as pd
import numpy as np
import matplotlib.pyplot as plt
from skimage import feature
from scipy import ndimage
from scipy.ndimage import convolve
from scipy import misc
from IPython.display import HTML
from idr import connection
Read data from IDR (Public Database : Read-only!)
Create connection and plate identifier
conn = connection('idr.openmicroscopy.org')
plateId = 408
Connected to IDR ...
Fetch plate object and print details
plate = conn.getObject("Plate", plateId)
print("\nNumber of fields:", plate.getNumberOfFields())
print("\nGrid size:", plate.getGridSize())
print("\nWells in Plate:", plate.getName())

plate_rows = plate.getRows()
plate_columns = plate.getColumns()
plate_format = plate_rows * plate_columns

print("\nPlate Format:", plate_format)
Number of fields: (0L, 0L)

Grid size: {'rows': 16L, 'columns': 24L}

Wells in Plate: 0001-03--2005-08-01

Plate Format: 384
*Algorithm List*
class AlgorithmList:
    def fourierBasedSharpnessMetric(self):
        fftimage = np.fft.fft2(plane)
        fftshift = np.fft.fftshift(fftimage)
        fftshift = np.absolute(fftshift)
        M = np.amax(fftshift)
        Th = (fftshift > M // float(1000)).sum()
        if 'image' in locals():
            size = float(image.getSizeX() * image.getSizeY())
            sharpness = Th // size
            return sharpness * 10000
        else:
            return Th

    def gradientBasedSharpnessMetric(self):
        gy, gx = np.gradient(plane)
        gnorm = np.sqrt(gx**2 + gy**2)
        sharpness = np.average(gnorm)
        return sharpness

    def edgeBasedSharpnessMetric(self):
        edges1 = feature.canny(plane, sigma=3)
        kernel = np.ones((3, 3))
        kernel[1, 1] = 0
        sharpness = convolve(edges1, kernel, mode="constant")
        sharpness = sharpness[edges1 != 0].sum()
        return sharpness


print("loaded:", dir(AlgorithmList))
loaded: ['__doc__', '__module__', 'edgeBasedSharpnessMetric', 'fourierBasedSharpnessMetric', 'gradientBasedSharpnessMetric']
Test your algorithm on example data
resultArray = np.zeros((5, 2), dtype=float)
plt.figure(figsize=(20, 15))
cntr = 1
for sigValue in range(0, 20, 4):
    face = misc.face(gray=True)
    plane = ndimage.gaussian_filter(face, sigma=sigValue)
    plt.subplot(1, 5, cntr)
    plt.imshow(plane, cmap=plt.cm.gray)
    plt.axis('off')
    sharpness = AlgorithmList().fourierBasedSharpnessMetric()
    resultArray[cntr - 1, 1] = sharpness
    resultArray[cntr - 1, 0] = sigValue
    cntr = cntr + 1

plt.show()
plt.figure(figsize=(10, 8))
plt.plot(resultArray[:, 0], resultArray[:, 1], 'ro')
plt.xlabel('Levels of gaussian blur')
plt.ylabel('sharpness score')
plt.show()

plt.gcf().clear()
print(resultArray)


[[0.000e+00 9.941e+03]
 [4.000e+00 3.495e+03]
 [8.000e+00 1.805e+03]
 [1.200e+01 1.179e+03]
 [1.600e+01 9.010e+02]]
<Figure size 432x288 with 0 Axes>
Test your algorithm on plate data
imageId = 171499
image = conn.getObject("Image", imageId)
print(image.getName(), image.getDescription())

pixels = image.getPrimaryPixels()
image_plane = pixels.getPlane(0, 0, 0)

resultArray = np.zeros((5, 2), dtype=float)
plt.figure(figsize=(20, 15))
cntr = 1
for sigValue in range(0, 20, 4):
    face = misc.face(gray=True)
    plane = ndimage.gaussian_filter(image_plane, sigma=sigValue)
    plt.subplot(1, 5, cntr)
    plt.imshow(plane, cmap=plt.cm.gray)
    plt.axis('off')
    sharpness = AlgorithmList().fourierBasedSharpnessMetric()
    resultArray[cntr - 1, 1] = sharpness
    resultArray[cntr - 1, 0] = sigValue
    cntr = cntr + 1
plt.show()
plt.figure(figsize=(10, 8))
plt.plot(resultArray[:, 0], resultArray[:, 1], 'ro')
plt.xlabel('Levels of gaussian blur')
plt.ylabel('sharpness score')
plt.show()
plt.gcf().clear()
print(resultArray)
0001-03--2005-08-01 [Well 125, Field 1 (Spot 125)]


[[0.0000e+00 3.5775e+04]
 [4.0000e+00 1.3319e+04]
 [8.0000e+00 6.5890e+03]
 [1.2000e+01 3.8610e+03]
 [1.6000e+01 2.5030e+03]]
<Figure size 432x288 with 0 Axes>
Iterative calculations for the whole plate
stride_r = 4 and stride_c = 4 so that this notebook
can be run quickly as an example.
To check all 384 wells change them both to 1.
stride_r = 4
stride_c = 4
chnames = None
cntr = 0
fields = 0
size_z = fields
print("Iterating through wells...")
rc = dict(((well.row, well.column), well) for well in plate.listChildren())
for wrc in sorted(rc.keys()):
    if wrc[0] % stride_r > 0 or wrc[1] % stride_c > 0:
        continue
    well = rc[wrc]
    print('Row:%d Column:%d' % (well.row, well.column))
    index = well.countWellSample()
    image = well.getImage(fields)
    if chnames is None:
        chnames = [ch.getLabel() for ch in image.getChannels(True)]
    pixels = image.getPrimaryPixels()
    size_c = image.getSizeC()
    if cntr == 0:
        result_array = np.full((plate_format, size_c), np.nan)
    for ch in range(0, size_c):
        plane = pixels.getPlane(0, ch, 0)
        sharpness = AlgorithmList().fourierBasedSharpnessMetric()
        wellid = well.row * plate_columns + well.column
        result_array[wellid, ch] = sharpness
        tempvalue = result_array[wellid, ch]
        fieldid = (fields + ch * size_c)
        cntr = cntr + 1
Iterating through wells...
Row:0 Column:0
Row:0 Column:4
Row:0 Column:8
Row:0 Column:12
Row:0 Column:16
Row:0 Column:20
Row:4 Column:0
Row:4 Column:4
Row:4 Column:8
Row:4 Column:12
Row:4 Column:16
Row:4 Column:20
Row:8 Column:0
Row:8 Column:4
Row:8 Column:8
Row:8 Column:12
Row:8 Column:16
Row:8 Column:20
Row:12 Column:0
Row:12 Column:4
Row:12 Column:8
Row:12 Column:12
Row:12 Column:16
Row:12 Column:20
Reshape numpy array and plot heatmaps
alphabets = list(string.ascii_uppercase)
plate_name = plate.getName()
colval = 0
planes = []
cntr = 0
size_c = 3
fig = plt.figure(figsize=(30, 15))
for rowval in range(0, size_c):
    data = result_array[:, rowval].reshape(plate_rows, plate_columns)
    ax = plt.subplot(size_c, 1, cntr + 1)
    plt.pcolor(data)
    plt.colorbar()
    ax.title.set_text(chnames[rowval])
    plt.xticks(np.arange(0.5, plate_columns, 1.0))
    plt.yticks(np.arange(0.5, plate_rows, 1.0))
    xlabels = range(1, plate_columns+1)
    ax.set_xticklabels(xlabels)
    ylabels = range(1, plate_rows+1)
    ax.set_yticklabels([alphabets[i - 1] for i in ylabels])
    plt.gca().invert_yaxis()
    plt.clim(0, 40000)

    data = np.repeat(data, 20, axis=1)
    data = np.repeat(data, 20, axis=0)
    planes.append(np.uint16(data))
    cntr = cntr + 1

plt.show()
fig.savefig(plate_name + 'SharpnessHeatMaps.png')

*Thumbnails of top2 and bottom 2 percentile images*
mapAnnotationNameSpace = "openmicroscopy.org/mapr/gene"
bulkAnnotationNameSpace = "openmicroscopy.org/omero/bulk_annotations"


def id_to_image_html(id):
    return '<img src="http://idr.openmicroscopy.org/webclient/render_thumbnail/%d/"/>' % id


def getGeneInformation(image):
    id = image.getId()
    image1 = conn.getObject('Image', id)
    cc = image1.getAnnotation(mapAnnotationNameSpace)
    rows = cc.getValue()
    html = []
    for r in rows:
        if r[1].startswith("http"):
            tempvar = "<a href='" + r[1] + "'>" + r[1] + "</a>"
        else:
            tempvar = r[1]
        html.append("<tr><td>" + tempvar + "</td></tr>")
    return ("<table>" + "".join(html) + "</table>")


def getQualityControl(image):
    id = image.getId()
    image1 = conn.getObject('Image', id)
    cc = image1.getAnnotation(bulkAnnotationNameSpace)
    rows = cc.getValue()
    html = []
    for r in rows:
        if r[0].startswith('Control') or r[0].startswith('Quality'):
            html.append("<tr><td>" + r[1] + "</td></tr>")
    return ("<table>" + "".join(html) + "</table>")


fields = 0
ch = 2

result_array_ch = result_array[:, ch]
threshold = np.percentile(result_array_ch[~np.isnan(result_array_ch)], 2)
imageList = []
for wrc in sorted(rc.keys()):
    if wrc[0] % stride_r > 0 or wrc[1] % stride_c > 0:
        continue
    well = rc[wrc]
    row = well.row
    column = well.column
    sharpness = result_array[((row)*plate_columns) + column, ch]
    if (sharpness <= threshold):
        image = well.getImage(fields)
        imageList.append(image)

images = [(x.id, x.id, x.getName(), x, x) for x in (imageList)]
pd.set_option('display.max_colwidth', -1)
df = pd.DataFrame(images, columns=['Id', 'Image', 'Name',
                                   'GeneInformation',
                                   'QualityControl'])
HTML(df.to_html(escape=False,
                formatters=dict(Image=id_to_image_html,
                                GeneInformation=getGeneInformation,
                                QualityControl=getQualityControl)))
| Id | Image | Name | GeneInformation | QualityControl | ||||
|---|---|---|---|---|---|---|---|---|
| 0 | 171247 | 0001-03--2005-08-01 [Well 1, Field 1 (Spot 1)] |
|
mapAnnotationNameSpace = "openmicroscopy.org/mapr/gene"
bulkAnnotationNameSpace = "openmicroscopy.org/omero/bulk_annotations"


def id_to_image_html(id):
    return '<img src="http://idr.openmicroscopy.org/webclient/render_thumbnail/%d/"/>' % id


def getGeneInformation(image):
    id = image.getId()
    image1 = conn.getObject('Image', id)
    cc = image1.getAnnotation(mapAnnotationNameSpace)
    rows = cc.getValue()
    html = []
    for r in rows:
        if r[1].startswith("http"):
            tempvar = "<a href='" + r[1] + "'>" + r[1] + "</a>"
        else:
            tempvar = r[1]
        html.append("<tr><td>" + tempvar + "</td></tr>")
    return ("<table>" + "".join(html) + "</table>")


def getQualityControl(image):
    id = image.getId()
    image1 = conn.getObject('Image', id)
    cc = image1.getAnnotation(bulkAnnotationNameSpace)
    rows = cc.getValue()
    html = []
    for r in rows:
        if r[0].startswith('Control') or r[0].startswith('Quality'):
            html.append("<tr><td>" + r[1] + "</td></tr>")
    return ("<table>" + "".join(html) + "</table>")


fields = 0
ch = 2
result_array_ch = result_array[:, ch]
threshold = np.percentile(result_array_ch[~np.isnan(result_array_ch)], 98)
imageList = []
for well in plate.listChildren():
    row = well.row
    column = well.column
    sharpness = result_array[((row)*plate_columns) + column, ch]
    if (sharpness >= threshold):
        image = well.getImage(fields)
        imageList.append(image)

images = [(x.id, x.id, x.getName(), x, x) for x in (imageList)]
pd.set_option('display.max_colwidth', -1)
df = pd.DataFrame(images, columns=['Id', 'Image',
                                   'Name', 'GeneInformation',
                                   'QualityControl'])
HTML(df.to_html(escape=False,
                formatters=dict(Image=id_to_image_html,
                                GeneInformation=getGeneInformation,
                                QualityControl=getQualityControl)))
| Id | Image | Name | GeneInformation | QualityControl | |||||
|---|---|---|---|---|---|---|---|---|---|
| 0 | 171512 | 0001-03--2005-08-01 [Well 17, Field 1 (Spot 17)] |
|
|
Close Connection to IDR
conn.close()
License (BSD 2-Clause)¶¶
Copyright (C) 2016-2021 University of Dundee. All Rights Reserved.
Redistribution and use in source and binary forms, with or without modification, are permitted provided that the following conditions are met:
Redistributions of source code must retain the above copyright notice, this list of conditions and the following disclaimer. Redistributions in binary form must reproduce the above copyright notice, this list of conditions and the following disclaimer in the documentation and/or other materials provided with the distribution. THIS SOFTWARE IS PROVIDED BY THE COPYRIGHT HOLDERS AND CONTRIBUTORS "AS IS" AND ANY EXPRESS OR IMPLIED WARRANTIES, INCLUDING, BUT NOT LIMITED TO, THE IMPLIED WARRANTIES OF MERCHANTABILITY AND FITNESS FOR A PARTICULAR PURPOSE ARE DISCLAIMED. IN NO EVENT SHALL THE COPYRIGHT OWNER OR CONTRIBUTORS BE LIABLE FOR ANY DIRECT, INDIRECT, INCIDENTAL, SPECIAL, EXEMPLARY, OR CONSEQUENTIAL DAMAGES (INCLUDING, BUT NOT LIMITED TO, PROCUREMENT OF SUBSTITUTE GOODS OR SERVICES; LOSS OF USE, DATA, OR PROFITS; OR BUSINESS INTERRUPTION) HOWEVER CAUSED AND ON ANY THEORY OF LIABILITY, WHETHER IN CONTRACT, STRICT LIABILITY, OR TORT (INCLUDING NEGLIGENCE OR OTHERWISE) ARISING IN ANY WAY OUT OF THE USE OF THIS SOFTWARE, EVEN IF ADVISED OF THE POSSIBILITY OF SUCH DAMAGE.