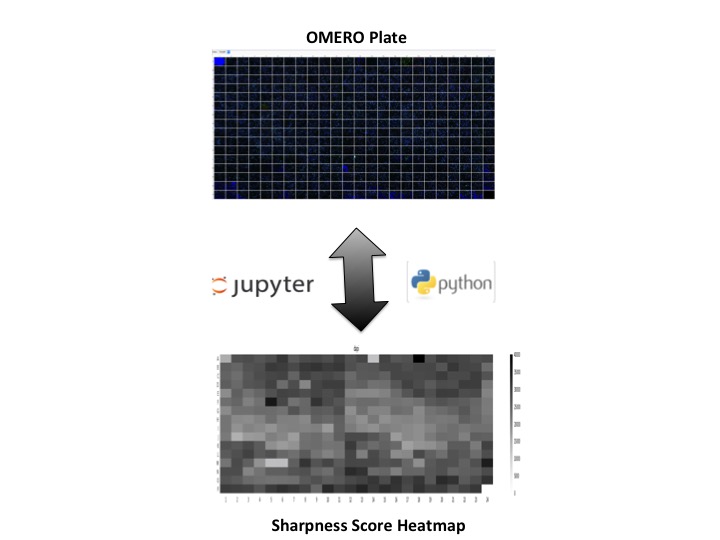
QC script to calculate sharpness metric for images in a plate
The following script will access the IDR images in a facility manager's context,
The QC script does the following,
- Extracts Images from IDR (read-only)
- Calculates sharpness based on the algorithm defined in the following publication,
- Creates a numpy array of the sharpness scores for every well,
- seperately for every field and every channel
- the numpy array is then reshaped to the same dimensions of the plate, e.g. 96 well plates will have a numpy array with 8 rows and 12 columns.
- Plots a heatmap for every field and every channel, and arranges all plots within a subplot.
Workflow summary
*Import Packages*
from PIL import Image
import string
import pandas as pd
import numpy as np
import matplotlib
import matplotlib.pyplot as plt
from numpy import array, int8
from skimage import feature
from scipy import ndimage
from scipy.ndimage import convolve
from scipy import misc
Read data from IDR (Public Database : Read-only!)
*Create connection and plate identifier*
from idr import connection
conn = connection()
plateId = 408
Connected to IDR ...
*Fetch plate object and print details*
plate = conn.getObject("Plate", plateId)
print "\nNumber of fields:", plate.getNumberOfFields()
print "\nGrid size:", plate.getGridSize()
print "\nWells in Plate:", plate.getName()

plate_rows = plate.getRows()
plate_columns = plate.getColumns()
plate_format = plate_rows * plate_columns

print "\nPlate Format:", plate_format
Number of fields: (0L, 0L)

Grid size: {'rows': 16L, 'columns': 24L}

Wells in Plate: 0001-03--2005-08-01

Plate Format: 384
*Algorithm List*
class AlgorithmList:
    def fourierBasedSharpnessMetric(self):
        fftimage = np.fft.fft2(plane)
        fftshift = np.fft.fftshift(fftimage)
        fftshift = np.absolute(fftshift)
        M = np.amax(fftshift)
        Th = (fftshift > (M/float(1000))).sum()
        if 'image' in locals():
            sharpness = Th/(float(image.getSizeX())*float(image.getSizeY()))
            return sharpness*10000
        else:
            return Th
    def gradientBasedSharpnessMetric(self):
        gy, gx = np.gradient(plane)
        gnorm = np.sqrt(gx**2 + gy**2)
        sharpness = np.average(gnorm)
        return sharpness
    def edgeBasedSharpnessMetric(self):
        edges1 = feature.canny(plane, sigma=3)
        kernel = np.ones((3, 3))
        kernel[1, 1] = 0
        sharpness = convolve(edges1, kernel, mode="constant")
        sharpness = sharpness[edges1 != 0].sum()
        return sharpness
print "loaded:", dir(AlgorithmList)
loaded: ['__doc__', '__module__', 'edgeBasedSharpnessMetric', 'fourierBasedSharpnessMetric', 'gradientBasedSharpnessMetric']
*Test your algorithm on example data*
resultArray = np.zeros((5, 2), dtype=float)
plt.figure(figsize=(20, 15))
cntr = 1
for sigValue in xrange(0,20,4):
    face = misc.face(gray=True)
    plane = ndimage.gaussian_filter(face, sigma=sigValue)
    plt.subplot(1,5,cntr)
    plt.imshow(plane, cmap=plt.cm.gray)
    plt.axis('off')
    sharpness = AlgorithmList().fourierBasedSharpnessMetric()
    resultArray[cntr-1,1] = sharpness
    resultArray[cntr-1,0] = sigValue
    cntr= cntr + 1

plt.show()
plt.figure(figsize=(10, 8))
plt.plot(resultArray[:,0], resultArray[:,1], 'ro')
plt.xlabel('Levels of gaussian blur')
plt.ylabel('sharpness score')
plt.show()

plt.gcf().clear()
print(resultArray)


[[0.000e+00 9.941e+03]
 [4.000e+00 3.495e+03]
 [8.000e+00 1.805e+03]
 [1.200e+01 1.179e+03]
 [1.600e+01 9.010e+02]]
<Figure size 432x288 with 0 Axes>
*Test your algorithm on plate data*
imageId = 171499
image = conn.getObject("Image", imageId)
print image.getName(), image.getDescription()

pixels = image.getPrimaryPixels()
image_plane = pixels.getPlane(0, 0, 0)

resultArray = np.zeros((5, 2), dtype=float)
plt.figure(figsize=(20, 15))
cntr = 1
for sigValue in xrange(0,20,4):
    face = misc.face(gray=True)
    plane = ndimage.gaussian_filter(image_plane, sigma=sigValue)
    plt.subplot(1,5,cntr)
    plt.imshow(plane, cmap=plt.cm.gray)
    plt.axis('off')
    sharpness = AlgorithmList().fourierBasedSharpnessMetric()
    resultArray[cntr-1,1] = sharpness
    resultArray[cntr-1,0] = sigValue
    cntr = cntr + 1
plt.show()
plt.figure(figsize=(10, 8))
plt.plot(resultArray[:,0], resultArray[:,1], 'ro')
plt.xlabel('Levels of gaussian blur')
plt.ylabel('sharpness score')
plt.show()
plt.gcf().clear()
print(resultArray)
0001-03--2005-08-01 [Well 125, Field 1 (Spot 125)]


[[0.0000e+00 3.5775e+04]
 [4.0000e+00 1.3319e+04]
 [8.0000e+00 6.5890e+03]
 [1.2000e+01 3.8610e+03]
 [1.6000e+01 2.5030e+03]]
<Figure size 432x288 with 0 Axes>
*Iterative calculations for the whole plate*
stride_r = 4 and stride_c = 4 so that this notebook can be run quickly as an example.
To check all 384 wells change them both to 1.
stride_r = 4
stride_c = 4
chnames = None
cntr = 0
fields = 0
size_z = fields
print "Iterating through wells..."
rc = dict(((well.row, well.column), well) for well in plate.listChildren())
for wrc in sorted(rc.keys()):
    if wrc[0] % stride_r > 0 or wrc[1] % stride_c > 0:
        continue
    well = rc[wrc]
    print('Row:%d Column:%d' %(well.row, well.column))
    index = well.countWellSample()
    image = well.getImage(fields)
    if chnames is None:
        chnames = [ch.getLabel() for ch in image.getChannels(True)]
    pixels = image.getPrimaryPixels()
    size_c = image.getSizeC()
    if cntr == 0:
        result_array = np.full((plate_format, size_c), np.nan)
    for ch in xrange(0, size_c):
        plane = pixels.getPlane(0, ch, 0)
        sharpness = AlgorithmList().fourierBasedSharpnessMetric()
        result_array[((well.row) * plate_columns) + well.column, ch] = sharpness
        tempvalue = result_array[((well.row) * plate_columns) + well.column, ch]
        wellid = ((well.row) * plate_columns) + well.column
        fieldid = (fields + ch * size_c)
        cntr = cntr + 1
Iterating through wells...
Row:0 Column:0
Row:0 Column:4
Row:0 Column:8
Row:0 Column:12
Row:0 Column:16
Row:0 Column:20
Row:4 Column:0
Row:4 Column:4
Row:4 Column:8
Row:4 Column:12
Row:4 Column:16
Row:4 Column:20
Row:8 Column:0
Row:8 Column:4
Row:8 Column:8
Row:8 Column:12
Row:8 Column:16
Row:8 Column:20
Row:12 Column:0
Row:12 Column:4
Row:12 Column:8
Row:12 Column:12
Row:12 Column:16
Row:12 Column:20
*Reshape numpy array and plot heatmaps*
alphabets = list(string.ascii_uppercase)
plate_name = plate.getName()
colval = 0
planes = []
cntr = 0
size_c = 3
fig = plt.figure(figsize=(30, 15))
for rowval in range (0, size_c):
    data = result_array[:, rowval].reshape(plate_rows, plate_columns)
    ax = plt.subplot(size_c,1,cntr+1)
    plt.pcolor(data)
    plt.colorbar()
    ax.title.set_text(chnames[rowval])
    plt.xticks(np.arange(0.5, plate_columns, 1.0))
    plt.yticks(np.arange(0.5, plate_rows, 1.0))
    xlabels = range(1, plate_columns+1)
    ax.set_xticklabels(xlabels)
    ylabels = range(1, plate_rows+1)
    ax.set_yticklabels([alphabets[i-1] for i in ylabels])
    plt.gca().invert_yaxis()
    plt.clim(0,40000)

    data = np.repeat(data, 20, axis=1)
    data = np.repeat(data, 20, axis=0)
    planes.append(np.uint16(data))
    cntr = cntr + 1

plt.show()
fig.savefig(plate_name + 'SharpnessHeatMaps.png')

*Thumbnails of top2 and bottom 2 percentile images*
mapAnnotationNameSpace = "openmicroscopy.org/mapr/gene"
bulkAnnotationNameSpace = "openmicroscopy.org/omero/bulk_annotations"
def id_to_image_html(id):
    return '<img src="http://idr.openmicroscopy.org/webclient/render_thumbnail/%d/"/>' % id

def getGeneInformation(image):
    id = image.getId()
    image1 = conn.getObject('Image', id)
    cc = image1.getAnnotation(mapAnnotationNameSpace)
    rows = cc.getValue()
    html = []
    for r in rows:
        if r[1].startswith("http"):
            tempvar = "<a href='"+ r[1] + "'>" + r[1] + "</a>"
        else:
            tempvar = r[1]
        html.append("<tr><td>" + tempvar + "</td></tr>")
    return ("<table>" + "".join(html) + "</table>")

def getQualityControl(image):
    id = image.getId()
    image1 = conn.getObject('Image', id)
    cc = image1.getAnnotation(bulkAnnotationNameSpace)
    rows = cc.getValue()
    html = []
    for r in rows:
        if r[0].startswith('Control') or r[0].startswith('Quality'):
            html.append("<tr><td>" + r[1] + "</td></tr>")
    return ("<table>" + "".join(html) + "</table>")

from StringIO import StringIO
from IPython.display import Image, HTML, display

fields = 0
ch = 2

result_array_ch = result_array[:, ch]
threshold = np.percentile(result_array_ch[~np.isnan(result_array_ch)], 2)
imageList = []
for wrc in sorted(rc.keys()):
    if wrc[0] % stride_r > 0 or wrc[1] % stride_c > 0:
        continue
    well = rc[wrc]

    row = well.row
    column = well.column
    sharpness = result_array[((row)*plate_columns) + column, ch]

    if (sharpness <= threshold):
        image = well.getImage(fields)
        imageList.append(image)

images = [(x.id, x.id, x.getName(), x, x) for x in (imageList)]
pd.set_option('display.max_colwidth', -1)
df = pd.DataFrame(images, columns = ['Id', 'Image', 'Name', 'GeneInformation', 'QualityControl'])
HTML(df.to_html(escape=False, formatters=dict(Image=id_to_image_html, GeneInformation=getGeneInformation, QualityControl=getQualityControl)))
| Id | Image | Name | GeneInformation | QualityControl | ||||
|---|---|---|---|---|---|---|---|---|
| 0 | 171247 | 0001-03--2005-08-01 [Well 1, Field 1 (Spot 1)] |
|
mapAnnotationNameSpace = "openmicroscopy.org/mapr/gene"
bulkAnnotationNameSpace = "openmicroscopy.org/omero/bulk_annotations"
def id_to_image_html(id):
    return '<img src="http://idr.openmicroscopy.org/webclient/render_thumbnail/%d/"/>' % id

def getGeneInformation(image):
    id = image.getId()
    image1 = conn.getObject('Image', id)
    cc = image1.getAnnotation(mapAnnotationNameSpace)
    rows = cc.getValue()
    html = []
    for r in rows:
        if r[1].startswith("http"):
            tempvar = "<a href='"+ r[1] + "'>" + r[1] + "</a>"
        else:
            tempvar = r[1]
        html.append("<tr><td>" + tempvar + "</td></tr>")
    return ("<table>" + "".join(html) + "</table>")

def getQualityControl(image):
    id = image.getId()
    image1 = conn.getObject('Image', id)
    cc = image1.getAnnotation(bulkAnnotationNameSpace)
    rows = cc.getValue()
    html = []
    for r in rows:
        if r[0].startswith('Control') or r[0].startswith('Quality'):
            html.append("<tr><td>" + r[1] + "</td></tr>")
    return ("<table>" + "".join(html) + "</table>")

from StringIO import StringIO
from IPython.display import Image, HTML, display

fields = 0
ch = 2
result_array_ch = result_array[:, ch]
threshold = np.percentile(result_array_ch[~np.isnan(result_array_ch)], 98)
imageList = []
for well in plate.listChildren():

    row = well.row
    column = well.column
    sharpness = result_array[((row)*plate_columns) + column, ch]

    if (sharpness >= threshold):
        image = well.getImage(fields)
        imageList.append(image)

images = [(x.id, x.id, x.getName(), x, x) for x in (imageList)]
pd.set_option('display.max_colwidth', -1)
df = pd.DataFrame(images, columns = ['Id', 'Image', 'Name', 'GeneInformation', 'QualityControl'])
HTML(df.to_html(escape=False, formatters=dict(Image=id_to_image_html, GeneInformation=getGeneInformation, QualityControl=getQualityControl)))
| Id | Image | Name | GeneInformation | QualityControl | |||||
|---|---|---|---|---|---|---|---|---|---|
| 0 | 171512 | 0001-03--2005-08-01 [Well 17, Field 1 (Spot 17)] |
|
|
*Close Connection to IDR*
conn.close()
License
Copyright (C) 2016-2018 University of Dundee. All Rights Reserved.
This program is free software; you can redistribute it and/or modify it under the terms of the GNU General Public License as published by the Free Software Foundation; either version 2 of the License, or (at your option) any later version.
This program is distributed in the hope that it will be useful, but WITHOUT ANY WARRANTY; without even the implied warranty of MERCHANTABILITY or FITNESS FOR A PARTICULAR PURPOSE. See the GNU General Public License for more details. You should have received a copy of the GNU General Public License along with this program; if not, write to the Free Software Foundation, Inc., 51 Franklin Street, Fifth Floor, Boston, MA 02110-1301 USA.