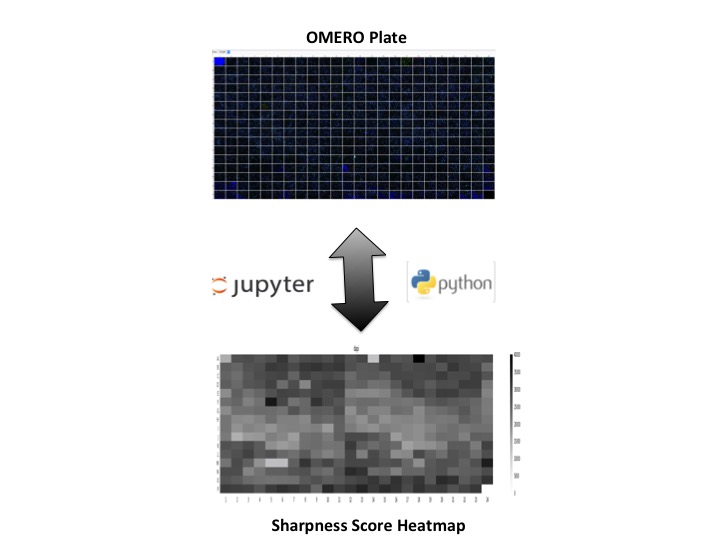
QC script to calculate sharpness metric for images in a plate
The following script will access the IDR images in a facility manager's context,
The QC script does the following,
- Extracts Images from IDR (read-only)
- Calculates sharpness based on the algorithm defined in the following publication,
- Creates a numpy array of the sharpness scores for every well,
- seperately for every field and every channel
- the numpy array is then reshaped to the same dimensions of the plate, e.g. 96 well plates will have a numpy array with 8 rows and 12 columns.
- Plots a heatmap for every field and every channel, and arranges all plots within a subplot.
- Exports the heatmap back to OMERO in the following ways,
- Saves the ["plate_name" + "heatmap.png"] and attaches it to the appropriate plate as a file attachment.
- Saves the numpy array as an image back to OMERO and a secondary script "createOMEROFigures" can be used to create figures in OMERO.figure in the same layout as seen in the ["plate_name" + "heatmap.png"]
Workflow summary
*Import Packages*
In [14]:
from PIL import Image
import string
import pandas as pd
import numpy as np
import matplotlib
import matplotlib.pyplot as plt
from numpy import array, int8
from skimage import feature
from scipy import ndimage
from scipy.ndimage import convolve
from scipy import misc
Read data from IDR (Public Database : Read-only!)
*Create connection and plate identifier*
In [15]:
from idr import connection;
conn = connection()
plateId = 408
print conn
Connected to IDR...
<omero.gateway._BlitzGateway object at 0x7f04bff00810>
*Fetch plate object and print details*
In [16]:
plate = conn.getObject("Plate", plateId)
print "\nNumber of fields:", plate.getNumberOfFields()
print "\nGrid size:", plate.getGridSize()
print "\nWells in Plate:", plate.getName()

plate_rows = plate.getRows()
plate_columns = plate.getColumns()
plate_format = plate_rows * plate_columns

print "\nPlate Format:", plate_format
Number of fields: (0L, 0L)

Grid size: {'rows': 16L, 'columns': 24L}

Wells in Plate: 0001-03--2005-08-01

Plate Format: 384
*Algorithm List*
In [17]:
class AlgorithmList:
    def fourierBasedSharpnessMetric(self):
        fftimage = np.fft.fft2(plane)
        fftshift = np.fft.fftshift(fftimage)
        fftshift = np.absolute(fftshift)
        M = np.amax(fftshift)
        Th = (fftshift > (M/float(1000))).sum()
        if 'image' in locals():
            sharpness = Th/(float(image.getSizeX())*float(image.getSizeY()))
            return sharpness*10000
        else:
            return Th
    def gradientBasedSharpnessMetric(self):
        gy, gx = np.gradient(plane)
        gnorm = np.sqrt(gx**2 + gy**2)
        sharpness = np.average(gnorm)
        return sharpness
    def edgeBasedSharpnessMetric(self):
        edges1 = feature.canny(plane, sigma=3)
        kernel = np.ones((3, 3))
        kernel[1, 1] = 0
        sharpness = convolve(edges1, kernel, mode="constant")
        sharpness = sharpness[edges1 != 0].sum()
        return sharpness
print "loaded:", dir(AlgorithmList)
loaded: ['__doc__', '__module__', 'edgeBasedSharpnessMetric', 'fourierBasedSharpnessMetric', 'gradientBasedSharpnessMetric']
*Test your algorithm on example data*
In [18]:
resultArray = np.zeros((5, 2), dtype=float);
plt.figure(figsize=(20, 15))
cntr = 1
for sigValue in xrange(0,20,4):
    face = misc.face(gray=True)
    plane = ndimage.gaussian_filter(face, sigma=sigValue)
    plt.subplot(1,5,cntr)
    plt.imshow(plane, cmap=plt.cm.gray)
    plt.axis('off')
    sharpness = AlgorithmList().fourierBasedSharpnessMetric();
    resultArray[cntr-1,1] = sharpness
    resultArray[cntr-1,0] = sigValue
    cntr= cntr + 1

plt.show()
plt.figure(figsize=(10, 8))
plt.plot(resultArray[:,0], resultArray[:,1], 'ro')
plt.xlabel('Levels of gaussian blur')
plt.ylabel('sharpness score')
plt.show()

plt.gcf().clear()


<matplotlib.figure.Figure at 0x7f04bfd24ed0>
*Test your algorithm on plate data*
In [19]:
imageId = 171499
image = conn.getObject("Image", imageId)
print image.getName(), image.getDescription()

pixels = image.getPrimaryPixels()
image_plane = pixels.getPlane(0, 0, 0)

resultArray = np.zeros((5, 2), dtype=float);
plt.figure(figsize=(20, 15))
cntr = 1
for sigValue in xrange(0,20,4):
    face = misc.face(gray=True)
    plane = ndimage.gaussian_filter(image_plane, sigma=sigValue)
    plt.subplot(1,5,cntr)
    plt.imshow(plane, cmap=plt.cm.gray)
    plt.axis('off')
    sharpness = AlgorithmList().fourierBasedSharpnessMetric();
    resultArray[cntr-1,1] = sharpness
    resultArray[cntr-1,0] = sigValue
    cntr = cntr + 1
plt.show()
plt.figure(figsize=(10, 8))
plt.plot(resultArray[:,0], resultArray[:,1], 'ro')
plt.xlabel('Levels of gaussian blur')
plt.ylabel('sharpness score')
plt.show()
plt.gcf().clear()
0001-03--2005-08-01 [Well 125, Field 1 (Spot 125)]


<matplotlib.figure.Figure at 0x7f04bfaeda10>
*Iterative calculations for the whole plate*
In [20]:
chnames = None
cntr = 0
fields = 0
size_z = fields
print "Iterating through wells..."
for well in plate.listChildren():
    index = well.countWellSample()
    image = well.getImage(fields)
    if chnames is None:
        chnames = [ch.getLabel() for ch in image.getChannels(True)]
    pixels = image.getPrimaryPixels()
    size_c = image.getSizeC()
    if cntr == 0:
        result_array = np.zeros((plate_format, size_c), dtype=float)
    for ch in xrange(0, size_c):
        plane = pixels.getPlane(0, ch, 0)
        sharpness = AlgorithmList().fourierBasedSharpnessMetric()
        result_array[((well.row) * plate_columns) + well.column, ch] = sharpness
        tempvalue = result_array[((well.row) * plate_columns) + well.column, ch]
        wellid = ((well.row) * plate_columns) + well.column
        fieldid = (fields + ch * size_c)
        cntr = cntr + 1
[============================================================] 100.0% ...Iterating through wells
*Reshape numpy array and plot heatmaps*
In [9]:
alphabets = list(string.ascii_uppercase)
plate_name = plate.getName()
colval = 0
planes = []
cntr = 0
size_c = 3
fig = plt.figure(figsize=(30, 15))
for rowval in range (0, size_c):
    data = result_array[:, rowval].reshape(plate_rows, plate_columns);
    ax = plt.subplot(size_c,1,cntr+1)
    plt.pcolor(data)
    plt.colorbar()
    ax.title.set_text(chnames[rowval])
    plt.xticks(np.arange(0.5, plate_columns, 1.0))
    plt.yticks(np.arange(0.5, plate_rows, 1.0))
    xlabels = range(1, plate_columns+1)
    ax.set_xticklabels(xlabels)
    ylabels = range(1, plate_rows+1)
    ax.set_yticklabels([alphabets[i-1] for i in ylabels])
    plt.gca().invert_yaxis()
    plt.clim(0,40000)

    data = np.repeat(data, 20, axis=1)
    data = np.repeat(data, 20, axis=0)
    planes.append(np.uint16(data))
    cntr = cntr + 1

plt.show()
fig.savefig(plate_name + 'SharpnessHeatMaps.png')

*Thumbnails of top2 and bottom 2 percentile images*
In [10]:
mapAnnotationNameSpace = "openmicroscopy.org/mapr/gene"
bulkAnnotationNameSpace = "openmicroscopy.org/omero/bulk_annotations"
def id_to_image_html(id):
    return '<img src="http://idr.openmicroscopy.org/webclient/render_thumbnail/%d/"/>' % id

def getGeneInformation(image):
    id = image.getId()
    image1 = conn.getObject('Image', id)
    cc = image1.getAnnotation(mapAnnotationNameSpace)
    rows = cc.getValue()
    html = []
    for r in rows:
        if r[1].startswith("http"):
            tempvar = "<a href='"+ r[1] + "'>" + r[1] + "</a>"
        else:
            tempvar = r[1]
        html.append("<tr><td>" + tempvar + "</td></tr>")
    return ("<table>" + "".join(html) + "</table>")

def getQualityControl(image):
    id = image.getId()
    image1 = conn.getObject('Image', id)
    cc = image1.getAnnotation(bulkAnnotationNameSpace)
    rows = cc.getValue()
    html = []
    for r in rows:
        if r[0].startswith('Control') or r[0].startswith('Quality'):
            html.append("<tr><td>" + r[1] + "</td></tr>")
    return ("<table>" + "".join(html) + "</table>")

from StringIO import StringIO
from IPython.display import Image, HTML, display

fields = 0
ch = 2
threshold = np.percentile(result_array[:, ch], 2)
imageList = []
for well in plate.listChildren():

    row = well.row
    column = well.column
    sharpness = result_array[((row)*plate_columns) + column, ch]

    if (sharpness <= threshold):
        image = well.getImage(fields)
        imageList.append(image)

images = [(x.id, x.id, x.getName(), x, x) for x in (imageList)]
pd.set_option('display.max_colwidth', -1)
df = pd.DataFrame(images, columns = ['Id', 'Image', 'Name', 'GeneInformation', 'QualityControl'])
HTML(df.to_html(escape=False, formatters=dict(Image=id_to_image_html, GeneInformation=getGeneInformation, QualityControl=getQualityControl)))
Out[10]:
| Id | Image | Name | GeneInformation | QualityControl | |||||
|---|---|---|---|---|---|---|---|---|---|
| 0 | 171280 | 0001-03--2005-08-01 [Well 306, Field 1 (Spot 306)] |
|
|
|||||
| 1 | 171337 | 0001-03--2005-08-01 [Well 376, Field 1 (Spot 376)] |
|
|
|||||
| 2 | 171247 | 0001-03--2005-08-01 [Well 1, Field 1 (Spot 1)] |
|
||||||
| 3 | 171504 | 0001-03--2005-08-01 [Well 293, Field 1 (Spot 293)] |
|
|
|||||
| 4 | 171440 | 0001-03--2005-08-01 [Well 14, Field 1 (Spot 14)] |
|
|
|||||
| 5 | 171282 | 0001-03--2005-08-01 [Well 208, Field 1 (Spot 208)] |
|
|
|||||
| 6 | 171496 | 0001-03--2005-08-01 [Well 384, Field 1 (Spot 384)] |
|
|
|||||
| 7 | 171386 | 0001-03--2005-08-01 [Well 294, Field 1 (Spot 294)] |
|
|
In [11]:
mapAnnotationNameSpace = "openmicroscopy.org/mapr/gene"
bulkAnnotationNameSpace = "openmicroscopy.org/omero/bulk_annotations"
def id_to_image_html(id):
    return '<img src="http://idr.openmicroscopy.org/webclient/render_thumbnail/%d/"/>' % id

def getGeneInformation(image):
    id = image.getId()
    image1 = conn.getObject('Image', id)
    cc = image1.getAnnotation(mapAnnotationNameSpace)
    rows = cc.getValue()
    html = []
    for r in rows:
        if r[1].startswith("http"):
            tempvar = "<a href='"+ r[1] + "'>" + r[1] + "</a>"
        else:
            tempvar = r[1]
        html.append("<tr><td>" + tempvar + "</td></tr>")
    return ("<table>" + "".join(html) + "</table>")

def getQualityControl(image):
    id = image.getId()
    image1 = conn.getObject('Image', id)
    cc = image1.getAnnotation(bulkAnnotationNameSpace)
    rows = cc.getValue()
    html = []
    for r in rows:
        if r[0].startswith('Control') or r[0].startswith('Quality'):
            html.append("<tr><td>" + r[1] + "</td></tr>")
    return ("<table>" + "".join(html) + "</table>")

from StringIO import StringIO
from IPython.display import Image, HTML, display

fields = 0
ch = 2
threshold = np.percentile(result_array[:, ch], 98)
imageList = []
for well in plate.listChildren():

    row = well.row
    column = well.column
    sharpness = result_array[((row)*plate_columns) + column, ch]

    if (sharpness >= threshold):
        image = well.getImage(fields)
        imageList.append(image)

images = [(x.id, x.id, x.getName(), x, x) for x in (imageList)]
pd.set_option('display.max_colwidth', -1)
df = pd.DataFrame(images, columns = ['Id', 'Image', 'Name', 'GeneInformation', 'QualityControl'])
HTML(df.to_html(escape=False, formatters=dict(Image=id_to_image_html, GeneInformation=getGeneInformation, QualityControl=getQualityControl)))
Out[11]:
| Id | Image | Name | GeneInformation | QualityControl | |||||
|---|---|---|---|---|---|---|---|---|---|
| 0 | 171420 | 0001-03--2005-08-01 [Well 326, Field 1 (Spot 326)] |
|
|
|||||
| 1 | 171629 | 0001-03--2005-08-01 [Well 284, Field 1 (Spot 284)] |
|
|
|||||
| 2 | 171530 | 0001-03--2005-08-01 [Well 381, Field 1 (Spot 381)] |
|
|
|||||
| 3 | 171490 | 0001-03--2005-08-01 [Well 370, Field 1 (Spot 370)] |
|
|
|||||
| 4 | 171464 | 0001-03--2005-08-01 [Well 322, Field 1 (Spot 322)] |
|
|
|||||
| 5 | 171432 | 0001-03--2005-08-01 [Well 3, Field 1 (Spot 3)] |
|
|
|||||
| 6 | 171512 | 0001-03--2005-08-01 [Well 17, Field 1 (Spot 17)] |
|
|
|||||
| 7 | 171268 | 0001-03--2005-08-01 [Well 272, Field 1 (Spot 272)] |
|
|
*Close Connection to IDR*
In [12]:
conn.close()
Write results back to your own OMERO server (A read-annotate/read-write server to save results)
*Import BlitzGateway*
In [10]:
from omero.gateway import BlitzGateway
In [21]:
from getpass import getpass
readAnnotateConn = BlitzGateway(
    raw_input("Username: "), getpass("OMERO Password: "),
    host=raw_input("Hostname: "))
readAnnotateConn.connect()
Username: user-1
OMERO Password: ········
Out[21]:
True
*Create OMERO Image from numpy sequence, feeder for createOMEROFigures script**
In [22]:
if readAnnotateConn.isConnected():

    size_z = 1
    size_t = 1
    def planeGen():
        """generator will yield planes"""
        for p in planes:
            yield p

    desc = "Image created from a hard-coded arrays"
    i = readAnnotateConn.createImageFromNumpySeq(planeGen(), plate_name + "numpy image", size_z, size_c, size_t, description=desc,dataset=None)
    print 'Created new Image:%s Name:"%s"' % (i.getId(), i.getName())
    imageId = i.getId()
Created new Image:3318 Name:"0001-03--2005-08-01numpy image"
*Save Results Back to OMERO as File Attachments*
In [24]:
if readAnnotateConn.isConnected():

    plate = readAnnotateConn.getObject("image", imageId)
    file_to_upload = plate_name + 'SharpnessHeatMaps.png'   # This file should already exist
    # create the original file and file annotation (uploads the file etc.)
    namespace = "dundee.users.meeting.demo"
    print "\nCreating an OriginalFile and FileAnnotation"
    file_ann = conn.createFileAnnfromLocalFile(
        file_to_upload, mimetype="text/plain", ns=namespace, desc=None)
    print "Attaching FileAnnotation to Plate: ", "File ID:", file_ann.getId(), \
        ",", file_ann.getFile().getName(), "Size:", file_ann.getFile().getSize()
    plate.linkAnnotation(file_ann)
    readAnnotateConn.close()
Creating an OriginalFile and FileAnnotation
Attaching FileAnnotation to Plate:  File ID: 657 , 0001-03--2005-08-01SharpnessHeatMaps.png Size: 59569
Out[24]:
<FileAnnotationWrapper id=657>