#!/usr/bin/env python
# coding: utf-8
#  #
# # CMS Open Data Example #3: Di-Muon Resonances
#
#
# # CMS Open Data Example #3: Di-Muon Resonances
# 
# ## Import Modules and Turn on Javascript
# In[1]:
from ROOT import TTree, TFile, TCanvas, TH1F, TLorentzVector
get_ipython().run_line_magic('jsroot', 'on')
# ## Read in Data from Input File
# In[2]:
file = TFile("data/Dimuons.root","READ");
# # Compute Di-Muon Invariant Mass
# Let's calculate again the invariant mass $M$ of two muons and focus on various parts of the dimuon mass spectrum
# ## Setup a Canvas
# In[3]:
Canvas = TCanvas()
# ## Declare Histograms
# For dimuon mass regions of interest 2.5-3.5 GeV and 80-100 GeV
# In[20]:
other = TH1F("other", "#mu#mu mass;#mu#mu mass [GeV];Events", 100, 0.0, 2.0)
J_psi = TH1F("J_psi", "#mu#mu mass;#mu#mu mass [GeV];Events", 100, 2.5, 3.5)
upsi = TH1F("upsi", "#mu#mu mass;#mu#mu mass [GeV];Events", 100, 9.0, 11.0)
Z_boson = TH1F("Z_Boson","#mu#mu mass;#mu#mu mass [GeV];Events", 200, 80, 100)
Higgs = TH1F("Higgs", "#mu#mu mass;#mu#mu mass [GeV];Evemts", 50, 120, 130)
# ## Loop Over the Events in the Data File
# ### Compute Di-Muon Invariant Mass and Fill Histograms for Various Resonances
# In[21]:
for dimu in file.Dimuons:
if dimu.Muon1_Global and dimu.Muon2_Global:
muon1 = TLorentzVector(dimu.Muon1_Px, dimu.Muon1_Py, dimu.Muon1_Pz, dimu.Muon1_Energy)
muon2 = TLorentzVector(dimu.Muon2_Px, dimu.Muon2_Py, dimu.Muon2_Pz, dimu.Muon2_Energy)
InvariantMass = (muon1 + muon2).M()
if InvariantMass < 2.0:
other.Fill(InvariantMass)
if InvariantMass > 2.0 and InvariantMass < 3.5:
J_psi.Fill(InvariantMass)
if InvariantMass > 9.0 and InvariantMass < 11.0:
upsi.Fill(InvariantMass)
if InvariantMass > 60.0 and InvariantMass < 120.0:
Z_boson.Fill(InvariantMass)
if InvariantMass > 120.0 and InvariantMass < 130.0:
Higgs.Fill(InvariantMass)
# ## Plot the J/$\psi$ Peak (Nobel Prize-Winning Discovery in 1974)
#  # In[6]:
J_psi.Draw()
Canvas.Draw()
# ## Plot the Z Boson Peak (Nobel Prize-Winning Discovery in 1983)
# In[7]:
Canvas.Clear()
Z_boson.Draw()
Canvas.Draw()
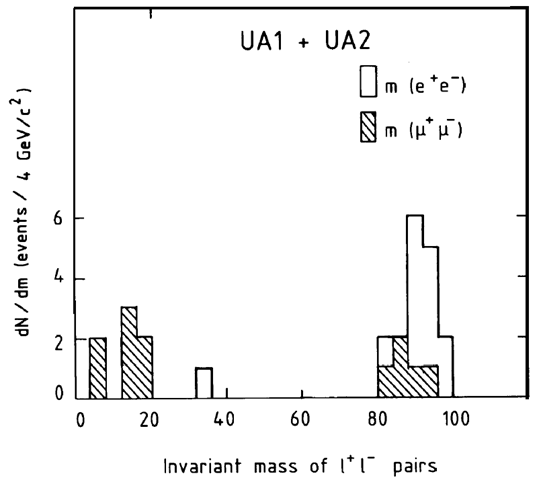
# ### Compare with the Z boson discovery plot
#
# In[6]:
J_psi.Draw()
Canvas.Draw()
# ## Plot the Z Boson Peak (Nobel Prize-Winning Discovery in 1983)
# In[7]:
Canvas.Clear()
Z_boson.Draw()
Canvas.Draw()
# ### Compare with the Z boson discovery plot
#  # ## Exercise: Can You Spot Other Di-Muon Resonances in the Dimuon Spectrum?
# ### Make a Separate Histogram For Each One and Plot It
# In[12]:
Canvas.Clear()
upsi.Draw()
Canvas.Draw()
# In[15]:
Canvas.Clear()
other.Draw()
Canvas.Draw()
# In[22]:
Canvas.Clear()
Higgs.Draw()
Canvas.Draw()
# In[ ]:
# ## Exercise: Can You Spot Other Di-Muon Resonances in the Dimuon Spectrum?
# ### Make a Separate Histogram For Each One and Plot It
# In[12]:
Canvas.Clear()
upsi.Draw()
Canvas.Draw()
# In[15]:
Canvas.Clear()
other.Draw()
Canvas.Draw()
# In[22]:
Canvas.Clear()
Higgs.Draw()
Canvas.Draw()
# In[ ]: