#!/usr/bin/env python
# coding: utf-8
# # 🎯 Uplift modeling `metrics`
#
#
#
#
#  #
#
#
#
# SCIKIT-UPLIFT REPO |
# SCIKIT-UPLIFT DOCS |
# USER GUIDE
#
#
# In[1]:
import sys
# install uplift library scikit-uplift and other libraries
get_ipython().system('{sys.executable} -m pip install scikit-uplift dill catboost')
# # 📝 Load data
#
# We are going to use a `Lenta dataset` from the BigTarget Hackathon hosted in summer 2020 by Lenta and Microsoft.
#
# Lenta is a russian food retailer.
#
# ### Data description
#
# ✏️ Dataset can be loaded from `sklift.datasets` module using `fetch_lenta` function.
#
# Read more about dataset in the api docs.
#
# This is an uplift modeling dataset containing data about Lenta's customers grociery shopping, marketing campaigns communications as `treatment` and store visits as `target`.
#
# #### ✏️ Major columns:
#
# - `group` - treatment / control flag
# - `response_att` - binary target
# - `CardHolder` - customer id
# - `gender` - customer gender
# - `age` - customer age
# In[2]:
from sklift.datasets import fetch_lenta
# returns sklearn Bunch object
# with data, target, treatment keys
# data features (pd.DataFrame), target (pd.Series), treatment (pd.Series) values
dataset = fetch_lenta()
# In[3]:
print(f"Dataset type: {type(dataset)}\n")
print(f"Dataset features shape: {dataset.data.shape}")
print(f"Dataset target shape: {dataset.target.shape}")
print(f"Dataset treatment shape: {dataset.treatment.shape}")
# # 📝 EDA
# In[4]:
dataset.data.head().append(dataset.data.tail())
# ### 🤔 target share for `treatment / control`
# In[5]:
import pandas as pd
pd.crosstab(dataset.treatment, dataset.target, normalize='index')
# In[6]:
# make treatment binary
treat_dict = {
'test': 1,
'control': 0
}
dataset.treatment = dataset.treatment.map(treat_dict)
# In[7]:
# fill NaNs in the categorical feature `gender`
# for CatBoostClassifier
dataset.data['gender'] = dataset.data['gender'].fillna(value='Не определен')
print(dataset.data['gender'].value_counts(dropna=False))
# ### ✂️ train test split
#
# - stratify by two columns: treatment and target.
#
# `Intuition:` In a binary classification problem definition we stratify train set by splitting target `0/1` column. In uplift modeling we have two columns instead of one.
# In[8]:
from sklearn.model_selection import train_test_split
stratify_cols = pd.concat([dataset.treatment, dataset.target], axis=1)
X_train, X_val, trmnt_train, trmnt_val, y_train, y_val = train_test_split(
dataset.data,
dataset.treatment,
dataset.target,
stratify=stratify_cols,
test_size=0.3,
random_state=42
)
print(f"Train shape: {X_train.shape}")
print(f"Validation shape: {X_val.shape}")
# # 👾 Class Transformation uplift model
#
# `Class transformation` method is described here
#
# Class transormation method `may` be used in case of treatment unbalanced data. In this case one will get not an uplift score but some *ranking* score still useful for ranking objects.
# In[9]:
from sklift.models import ClassTransformation
from catboost import CatBoostClassifier
estimator = CatBoostClassifier(verbose=100,
cat_features=['gender'],
random_state=42,
thread_count=1)
ct_model = ClassTransformation(estimator=estimator)
# In[10]:
ct_model.fit(
X=X_train,
y=y_train,
treatment=trmnt_train
)
# ### Save model
# In[11]:
import dill
with open("model.dill", 'wb') as f:
dill.dump(ct_model, f)
# ### Uplift prediction
# In[12]:
uplift_ct = ct_model.predict(X_val)
# # 🚀🚀🚀 Uplift metrics
# ## 🚀 `uplift@k`
#
# - uplift at first k%
# - usually falls between [0; 1] depending on k, model quality and data
#
#
# ### `uplift@k` = `target mean at k% in the treatment group` - `target mean at k% in the control group`
#
# ___
#
# How to count `uplift@k`:
#
# 1. sort by predicted uplift
# 2. select first k%
# 3. count target mean in the treatment group
# 4. count target mean in the control group
# 5. substract the mean in the control group from the mean in the treatment group
#
# ---
#
# Code parameter options:
#
# - `strategy='overall'` - sort by uplift treatment and control together
# - `strategy='by_group'` - sort by uplift treatment and control separately
# In[14]:
from sklift.metrics import uplift_at_k
# k = 10%
k = 0.1
# strategy='overall' sort by uplift treatment and control together
uplift_overall = uplift_at_k(y_val, uplift_ct, trmnt_val, strategy='overall', k=k)
# strategy='by_group' sort by uplift treatment and control separately
uplift_bygroup = uplift_at_k(y_val, uplift_ct, trmnt_val, strategy='by_group', k=k)
print(f"uplift@{k * 100:.0f}%: {uplift_overall:.4f} (sort groups by uplift together)")
print(f"uplift@{k * 100:.0f}%: {uplift_bygroup:.4f} (sort groups by uplift separately)")
# ## 🚀 `uplift_by_percentile` table
#
# Count metrics for each percentile in data in descending order by uplift prediction (by rows):
#
# - `n_treatment` - treatment group size in the one percentile
# - `n_control` - control group size in the one percentile
# - `response_rate_treatment` - target mean in the treatment group in the one percentile
# - `response_rate_control` - target mean in the control group in the one percentile
# - `uplift = response_rate_treatment - response_rate_control` in the one percentile
#
# ___
#
# Code parameter options are:
#
# - `strategy='overall'` - sort by uplift treatment and control groups together
# - `strategy='by_group'` - sort by uplift treatment and control groups separately
# - `total=True` - show total metric on full data
# - `std=True` - show metrics std by row
# In[15]:
from sklift.metrics import uplift_by_percentile
uplift_by_percentile(y_val, uplift_ct, trmnt_val,
strategy='overall',
total=True, std=True, bins=10)
# ## 🚀 `weighted average uplift `
#
# - counts uplift on full data
# - uses results from `uplift_by_percentile` table
# - result depends on number of bins
#
# ### `weighted average uplift` = `sum of uplift by percentile weighted on the treatment group size`
#
# In[16]:
from sklift.metrics import weighted_average_uplift
uplift_full_data = weighted_average_uplift(y_val, uplift_ct, trmnt_val, bins=10)
print(f"average uplift on full data: {uplift_full_data:.4f}")
# ## 🚀 `uplift_by_percentile` plot
#
# - visualize results of `uplift_by_percentile` table
#
# Two ways to plot:
#
# - line plot `kind='line'`
# - bar plot `kind='bar'`
#
# In[17]:
from sklift.viz import plot_uplift_by_percentile
# line plot
plot_uplift_by_percentile(y_val, uplift_ct, trmnt_val, strategy='overall', kind='line');
# In[18]:
# bar plot
plot_uplift_by_percentile(y_val, uplift_ct, trmnt_val, strategy='overall', kind='bar');
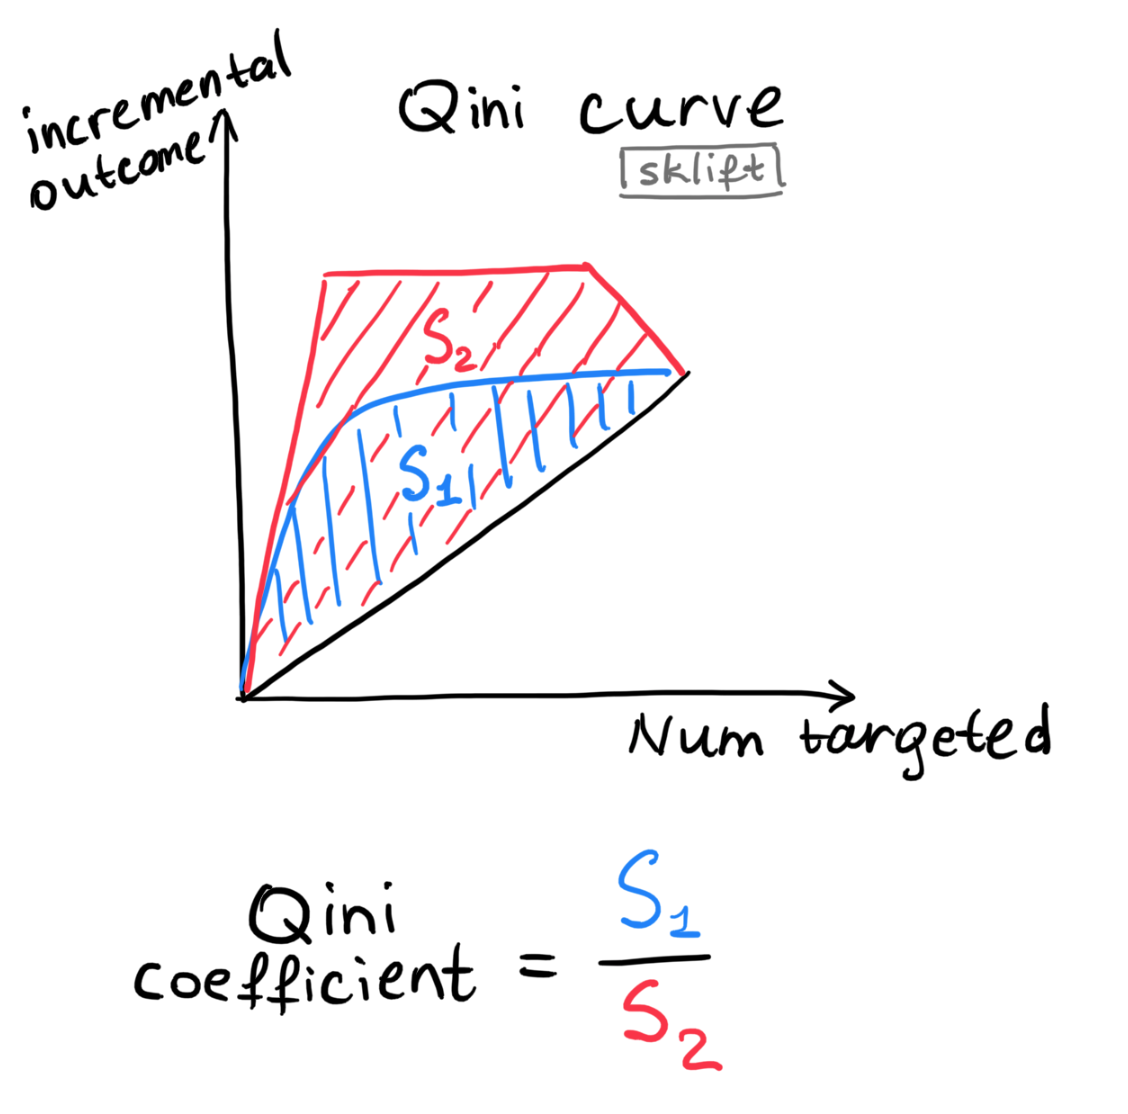
# ## 🚀 `Qini curve`
#
# The curve plots the absolute incremental outcome of the treated group compared to group with no treatment.
#
#
# plot Qini curve:
# - `blue line` is a `real Qini curve` based on data.
# - `red line` is an `ideal Qini curve` based on data. Code: `perfect=True`
# - `grey line` is a `random Qini curve` based on data
#
#
# ## 🚀 `AUQC` (`area under Qini curve` or `Qini coefficient`)
#
# `Qini coefficient` = `light blue area between the real Qini curve and the random Qini curve normalized on area between the random and the ideal line`
#
#  #
#
# - metric is printed at the title of the Qini curve plot
# - can be called as a separate function
# In[19]:
from sklift.viz import plot_qini_curve
# with ideal Qini curve (red line)
# perfect=True
plot_qini_curve(y_val, uplift_ct, trmnt_val, perfect=True);
# In[20]:
# no ideal Qini curve
# only real Qini curve
# perfect=False
plot_qini_curve(y_val, uplift_ct, trmnt_val, perfect=False);
# In[21]:
from sklift.metrics import qini_auc_score
# AUQC = area under Qini curve = Qini coefficient
auqc = qini_auc_score(y_val, uplift_ct, trmnt_val)
print(f"Qini coefficient on full data: {auqc:.4f}")
# ## 🚀 `Uplift curve`
#
# The Uplift curve plots incremental uplift.
#
#
# - `blue line` is a `real Uplift curve` based on data.
# - `red line` is an `ideal Uplift curve` based on data. Code: `perfect=True`
# - `grey line` is a `random Uplift curve` based on data.
#
#
# ## 🚀 `AUUQ` (`area under uplift curve`)
#
# - `Area under uplift curve` = blue area between the real Uplift curve and the random Uplift curve
# - appears at the title of the Uplift curve plot
# - can be called as a separate function
#
# In[22]:
from sklift.viz import plot_uplift_curve
# with ideal curve
# perfect=True
plot_uplift_curve(y_val, uplift_ct, trmnt_val, perfect=True);
# In[23]:
# only real
# perfect=False
plot_uplift_curve(y_val, uplift_ct, trmnt_val, perfect=False);
# In[24]:
from sklift.metrics import uplift_auc_score
# AUUQ = area under uplift curve
auuc = uplift_auc_score(y_val, uplift_ct, trmnt_val)
print(f"Uplift auc score on full data: {auuc:.4f}")
# In[ ]:
#
#
# - metric is printed at the title of the Qini curve plot
# - can be called as a separate function
# In[19]:
from sklift.viz import plot_qini_curve
# with ideal Qini curve (red line)
# perfect=True
plot_qini_curve(y_val, uplift_ct, trmnt_val, perfect=True);
# In[20]:
# no ideal Qini curve
# only real Qini curve
# perfect=False
plot_qini_curve(y_val, uplift_ct, trmnt_val, perfect=False);
# In[21]:
from sklift.metrics import qini_auc_score
# AUQC = area under Qini curve = Qini coefficient
auqc = qini_auc_score(y_val, uplift_ct, trmnt_val)
print(f"Qini coefficient on full data: {auqc:.4f}")
# ## 🚀 `Uplift curve`
#
# The Uplift curve plots incremental uplift.
#
#
# - `blue line` is a `real Uplift curve` based on data.
# - `red line` is an `ideal Uplift curve` based on data. Code: `perfect=True`
# - `grey line` is a `random Uplift curve` based on data.
#
#
# ## 🚀 `AUUQ` (`area under uplift curve`)
#
# - `Area under uplift curve` = blue area between the real Uplift curve and the random Uplift curve
# - appears at the title of the Uplift curve plot
# - can be called as a separate function
#
# In[22]:
from sklift.viz import plot_uplift_curve
# with ideal curve
# perfect=True
plot_uplift_curve(y_val, uplift_ct, trmnt_val, perfect=True);
# In[23]:
# only real
# perfect=False
plot_uplift_curve(y_val, uplift_ct, trmnt_val, perfect=False);
# In[24]:
from sklift.metrics import uplift_auc_score
# AUUQ = area under uplift curve
auuc = uplift_auc_score(y_val, uplift_ct, trmnt_val)
print(f"Uplift auc score on full data: {auuc:.4f}")
# In[ ]: