#!/usr/bin/env python
# coding: utf-8
# # Foundations of Computational Economics #16
#
# by Fedor Iskhakov, ANU
#
#  # ## Visualization of data and solutions
#
#
# ## Visualization of data and solutions
#
#  #
#  #
# [https://youtu.be/dJdWVkSNNpc](https://youtu.be/dJdWVkSNNpc)
#
# Description: Principles and functions of graphics. Examples of visualization of economic models.
# ### Why visualize?
#
# 1. **Convey ideas to others**
# Ability to efficiently explain your idea/work to other busy people is crucial element of success in many fields
# 1. **Check your own work**
# Creating of new knowledge using computational tools requires absolute certainty in the code
# 1. **Aggregate large amounts of information**
# Makes it possible to get the big picture and the message behind it
#
#
# [https://youtu.be/dJdWVkSNNpc](https://youtu.be/dJdWVkSNNpc)
#
# Description: Principles and functions of graphics. Examples of visualization of economic models.
# ### Why visualize?
#
# 1. **Convey ideas to others**
# Ability to efficiently explain your idea/work to other busy people is crucial element of success in many fields
# 1. **Check your own work**
# Creating of new knowledge using computational tools requires absolute certainty in the code
# 1. **Aggregate large amounts of information**
# Makes it possible to get the big picture and the message behind it
#  #
# [https://www.strava.com/heatmap#5.13/120.47297/37.61174/hot/all](https://www.strava.com/heatmap#5.13/120.47297/37.61174/hot/all)
# ### Matplotlib and other libraries
#
# - `matplotlib` - Python library that abstracts from the graphical backbone
# of each system and ensures *code mobility*
#
#
# **Matplotlib thumbnail gallery** [https://matplotlib.org/gallery.html](https://matplotlib.org/gallery.html)
#
# - `seaborn` - pretty plots geared towards statistical applications
# [https://seaborn.pydata.org/examples/index.html](https://seaborn.pydata.org/examples/index.html)
# - `bokeh` is a library for creating interactive plots
# [http://bokeh.pydata.org/en/latest/docs/gallery.html](http://bokeh.pydata.org/en/latest/docs/gallery.html)
# #### Plan
#
# 1. Visualization examples from my own research projects
# 1. Links to compulsory online learning resources
# #### Graphical objects
#
# Extensive collection of objects to modify all aspects of the graphics
#
# - figure - axes - subplots
# - lines - polygons (patches)
# - fill color and edge color
# - annotations and other text
# #### Types of plots
#
# - **bar** - categorical data, histograms
# - **scatter** - individual data points
# - **line** - continuous measure
# - **area** - dynamics of composition
# - **pie** - static composition
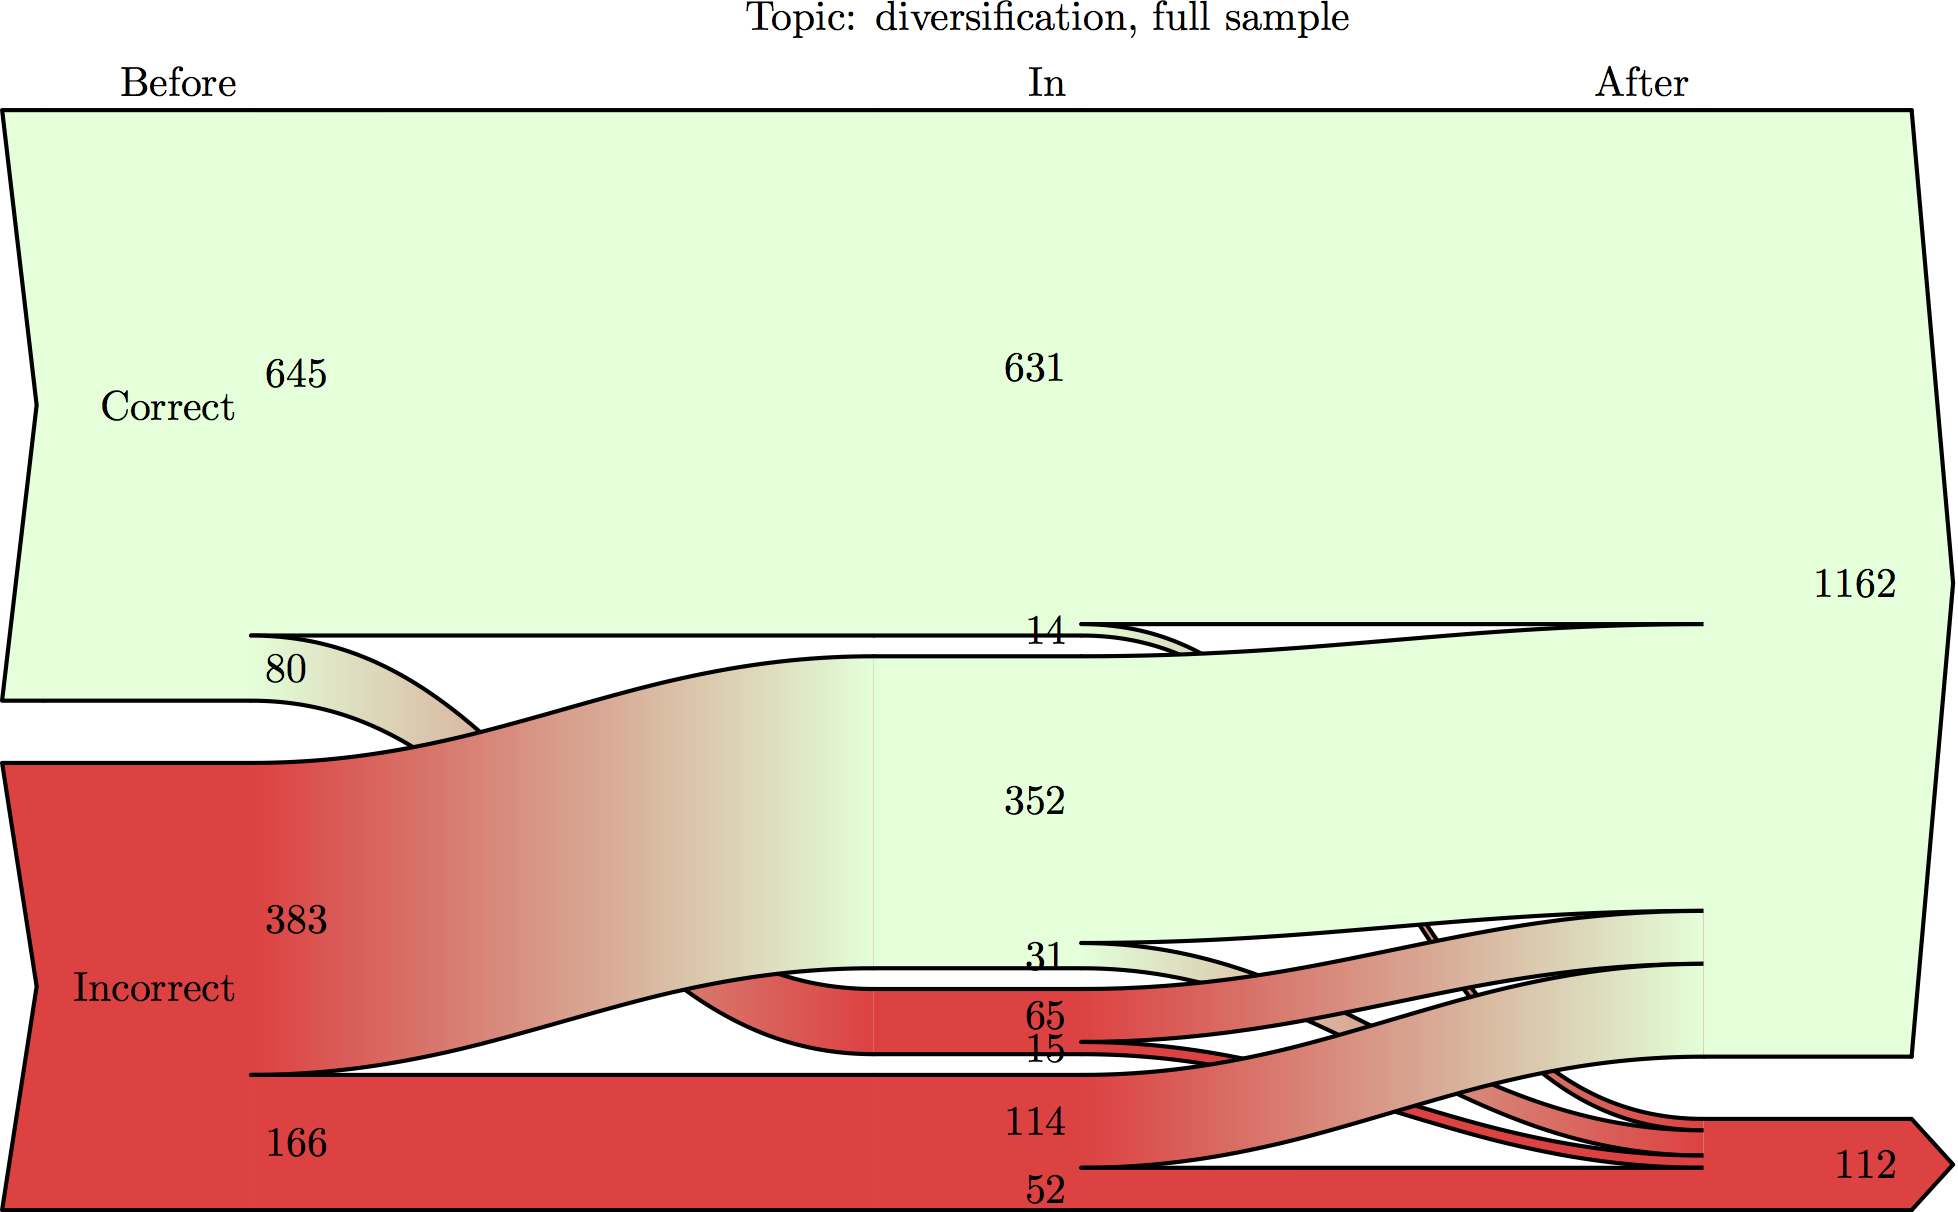
# - **Sankey** - flow diagram
# #### How to choose the plot type
#
# 1. Number of variables to be represented
# 1. Type of variables
# - continuous
# - categorical
# - ordered
# 1. What is the message of the graphics?
# ### General tips
#
# 1. **Less visual clutter!**
# Every dot, line, shape and label has to convey useful information
# 1. **Read the the manual and change the options**
# Defaults are good for quick and dirty preliminary runs only
# 1. **Careful with 3D**
# Much harder to make clear
# 1. **“Animations”**
# May be useful in cases when there are one too many dimensions in the data to visualize
# #### Less visual clutter
#
#
#
# [https://www.strava.com/heatmap#5.13/120.47297/37.61174/hot/all](https://www.strava.com/heatmap#5.13/120.47297/37.61174/hot/all)
# ### Matplotlib and other libraries
#
# - `matplotlib` - Python library that abstracts from the graphical backbone
# of each system and ensures *code mobility*
#
#
# **Matplotlib thumbnail gallery** [https://matplotlib.org/gallery.html](https://matplotlib.org/gallery.html)
#
# - `seaborn` - pretty plots geared towards statistical applications
# [https://seaborn.pydata.org/examples/index.html](https://seaborn.pydata.org/examples/index.html)
# - `bokeh` is a library for creating interactive plots
# [http://bokeh.pydata.org/en/latest/docs/gallery.html](http://bokeh.pydata.org/en/latest/docs/gallery.html)
# #### Plan
#
# 1. Visualization examples from my own research projects
# 1. Links to compulsory online learning resources
# #### Graphical objects
#
# Extensive collection of objects to modify all aspects of the graphics
#
# - figure - axes - subplots
# - lines - polygons (patches)
# - fill color and edge color
# - annotations and other text
# #### Types of plots
#
# - **bar** - categorical data, histograms
# - **scatter** - individual data points
# - **line** - continuous measure
# - **area** - dynamics of composition
# - **pie** - static composition
# - **Sankey** - flow diagram
# #### How to choose the plot type
#
# 1. Number of variables to be represented
# 1. Type of variables
# - continuous
# - categorical
# - ordered
# 1. What is the message of the graphics?
# ### General tips
#
# 1. **Less visual clutter!**
# Every dot, line, shape and label has to convey useful information
# 1. **Read the the manual and change the options**
# Defaults are good for quick and dirty preliminary runs only
# 1. **Careful with 3D**
# Much harder to make clear
# 1. **“Animations”**
# May be useful in cases when there are one too many dimensions in the data to visualize
# #### Less visual clutter
#
#  # #### Choice of appropriate plot type
#
# #### Choice of appropriate plot type
#  #
#  #
#  #
#  #
#  #
#  #
#  #
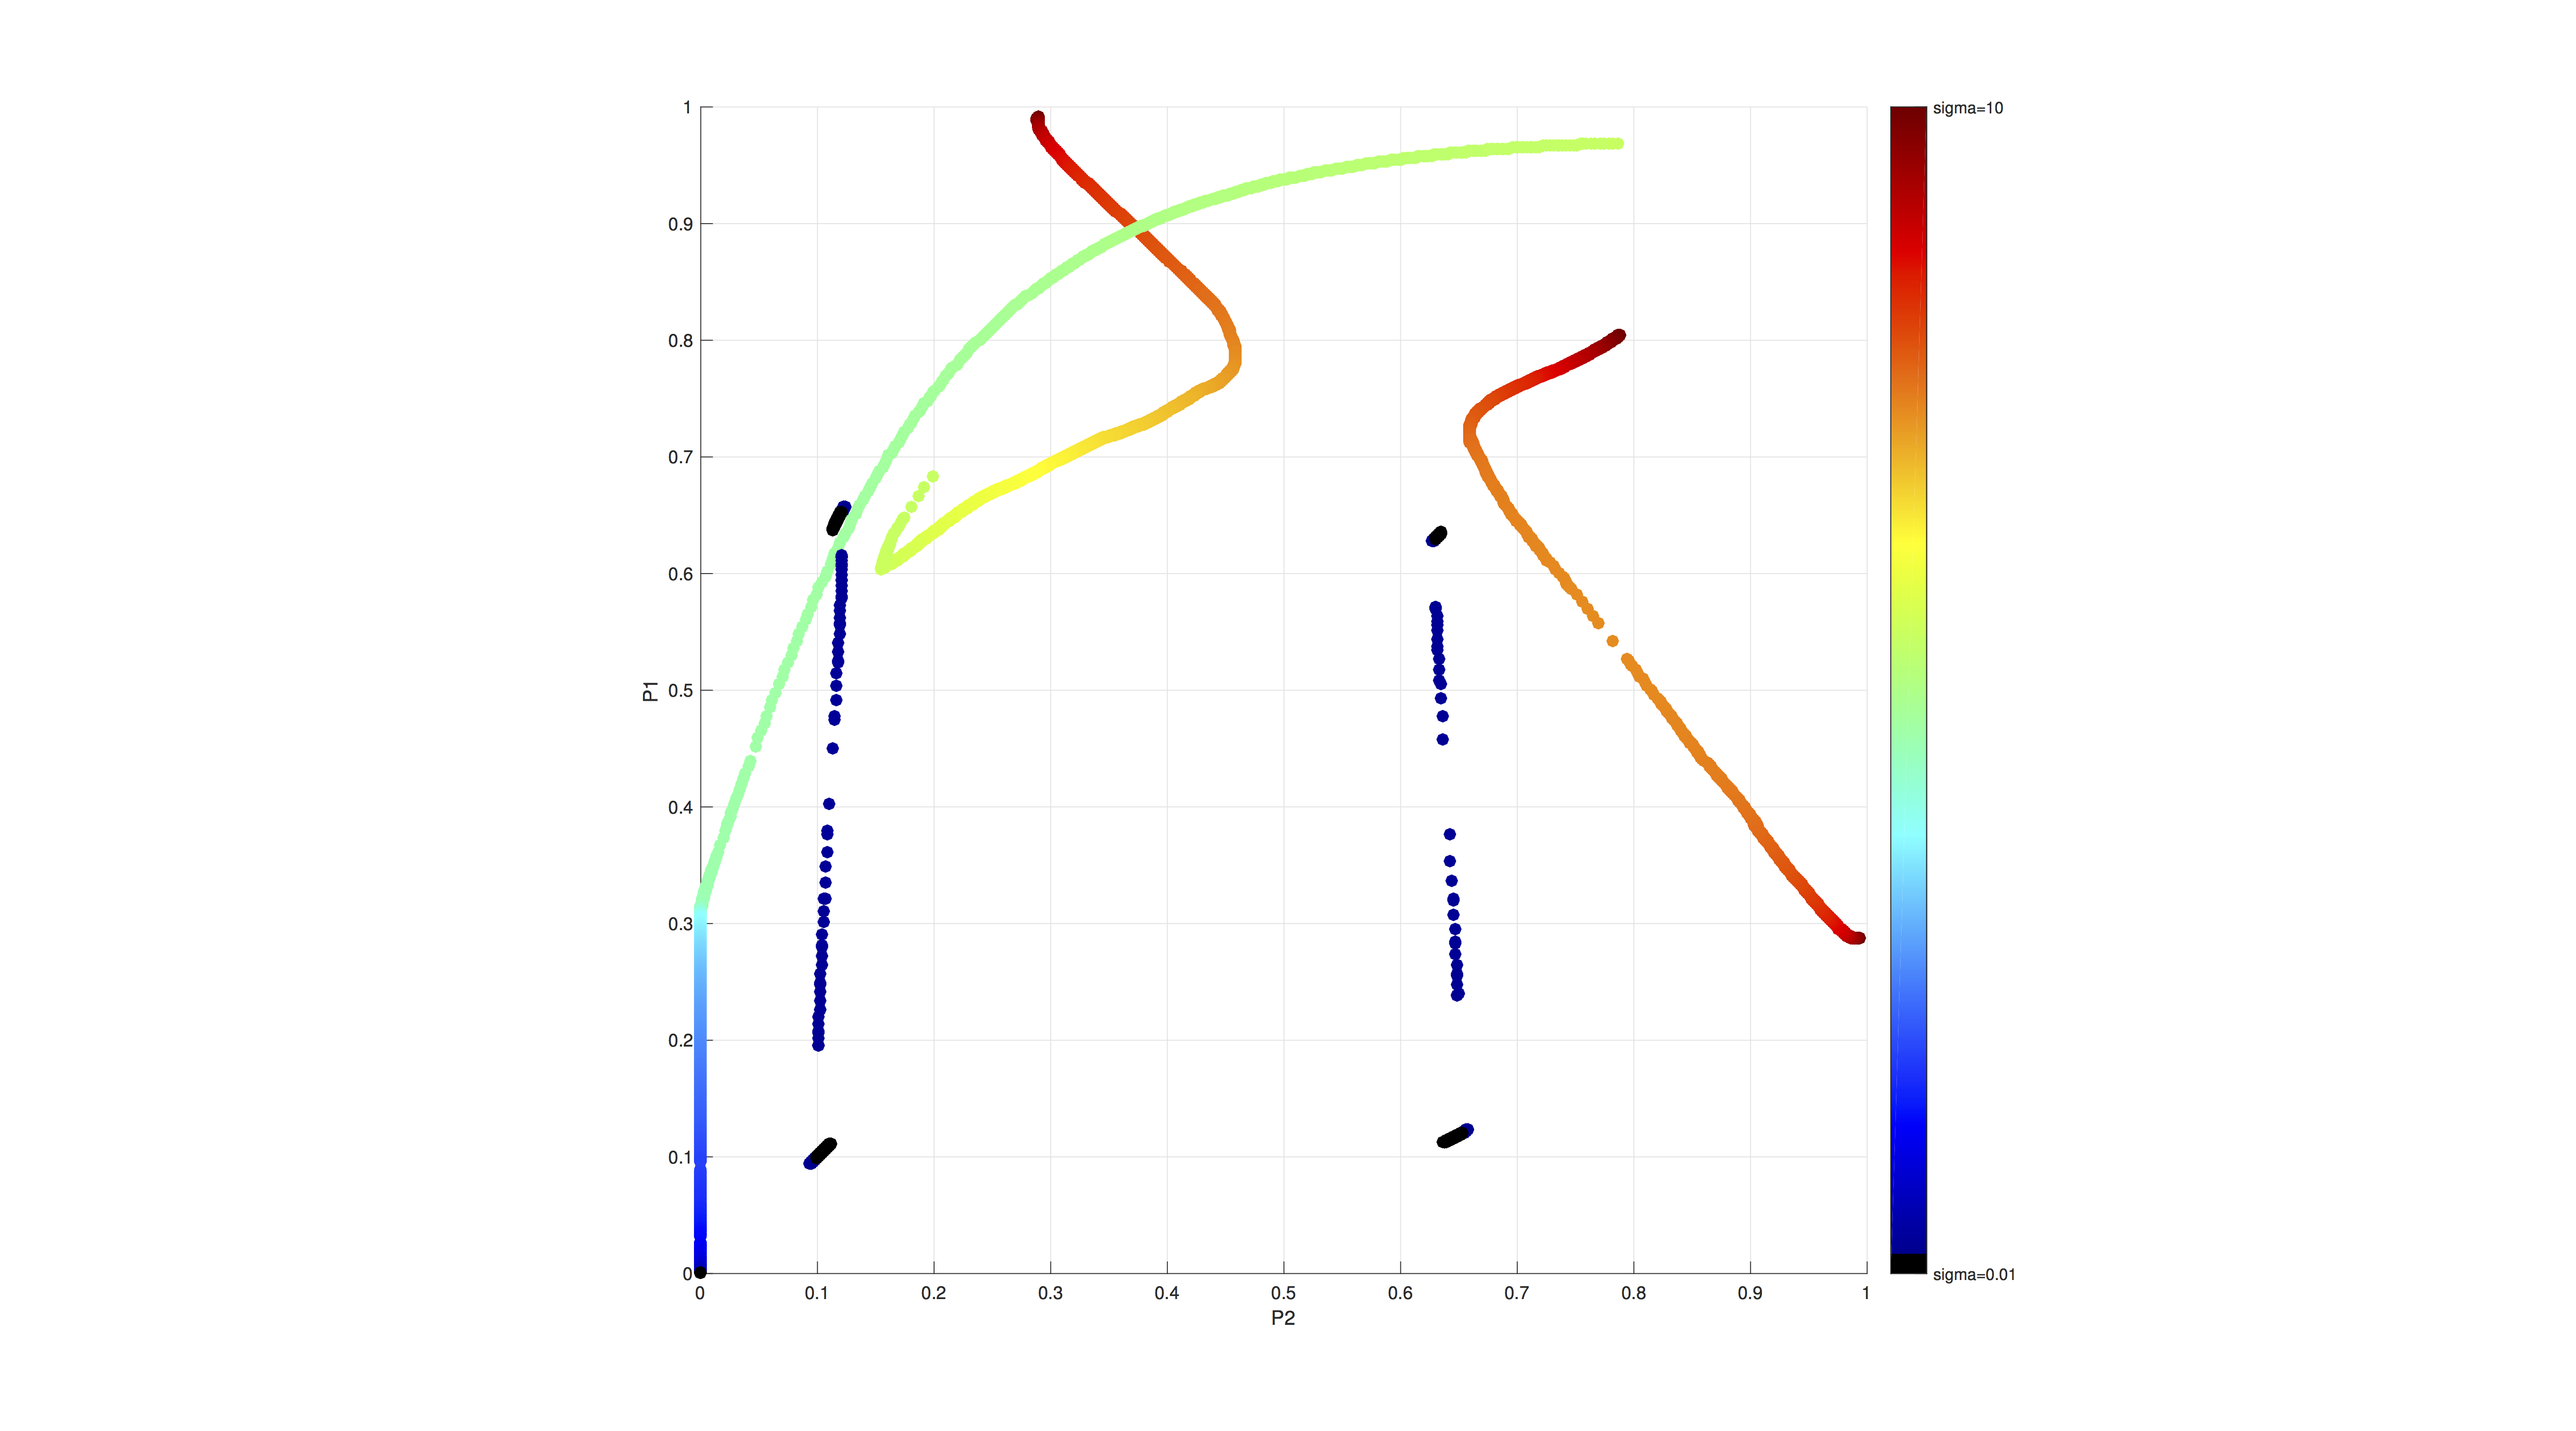
#  # #### Using many dimensions in one plot
#
# - location (x,y,z)
# - color
# - line or marker style
# - size
# - animation
# - multiple plots in a figure
#
# #### Using many dimensions in one plot
#
# - location (x,y,z)
# - color
# - line or marker style
# - size
# - animation
# - multiple plots in a figure
#  # #### Visual debugging and dashboards
#
# Using visual representation to verify the code
# - *Seeing* a bug in a plot is easier than in the code!
#
# Dashboards are ideal for aggregation of large amounts of information
#
# 1. Calibration/estimation an moment matching
# 1. Monitoring computing resources
#
# #### Visual debugging and dashboards
#
# Using visual representation to verify the code
# - *Seeing* a bug in a plot is easier than in the code!
#
# Dashboards are ideal for aggregation of large amounts of information
#
# 1. Calibration/estimation an moment matching
# 1. Monitoring computing resources
#  #
#  #
#  #
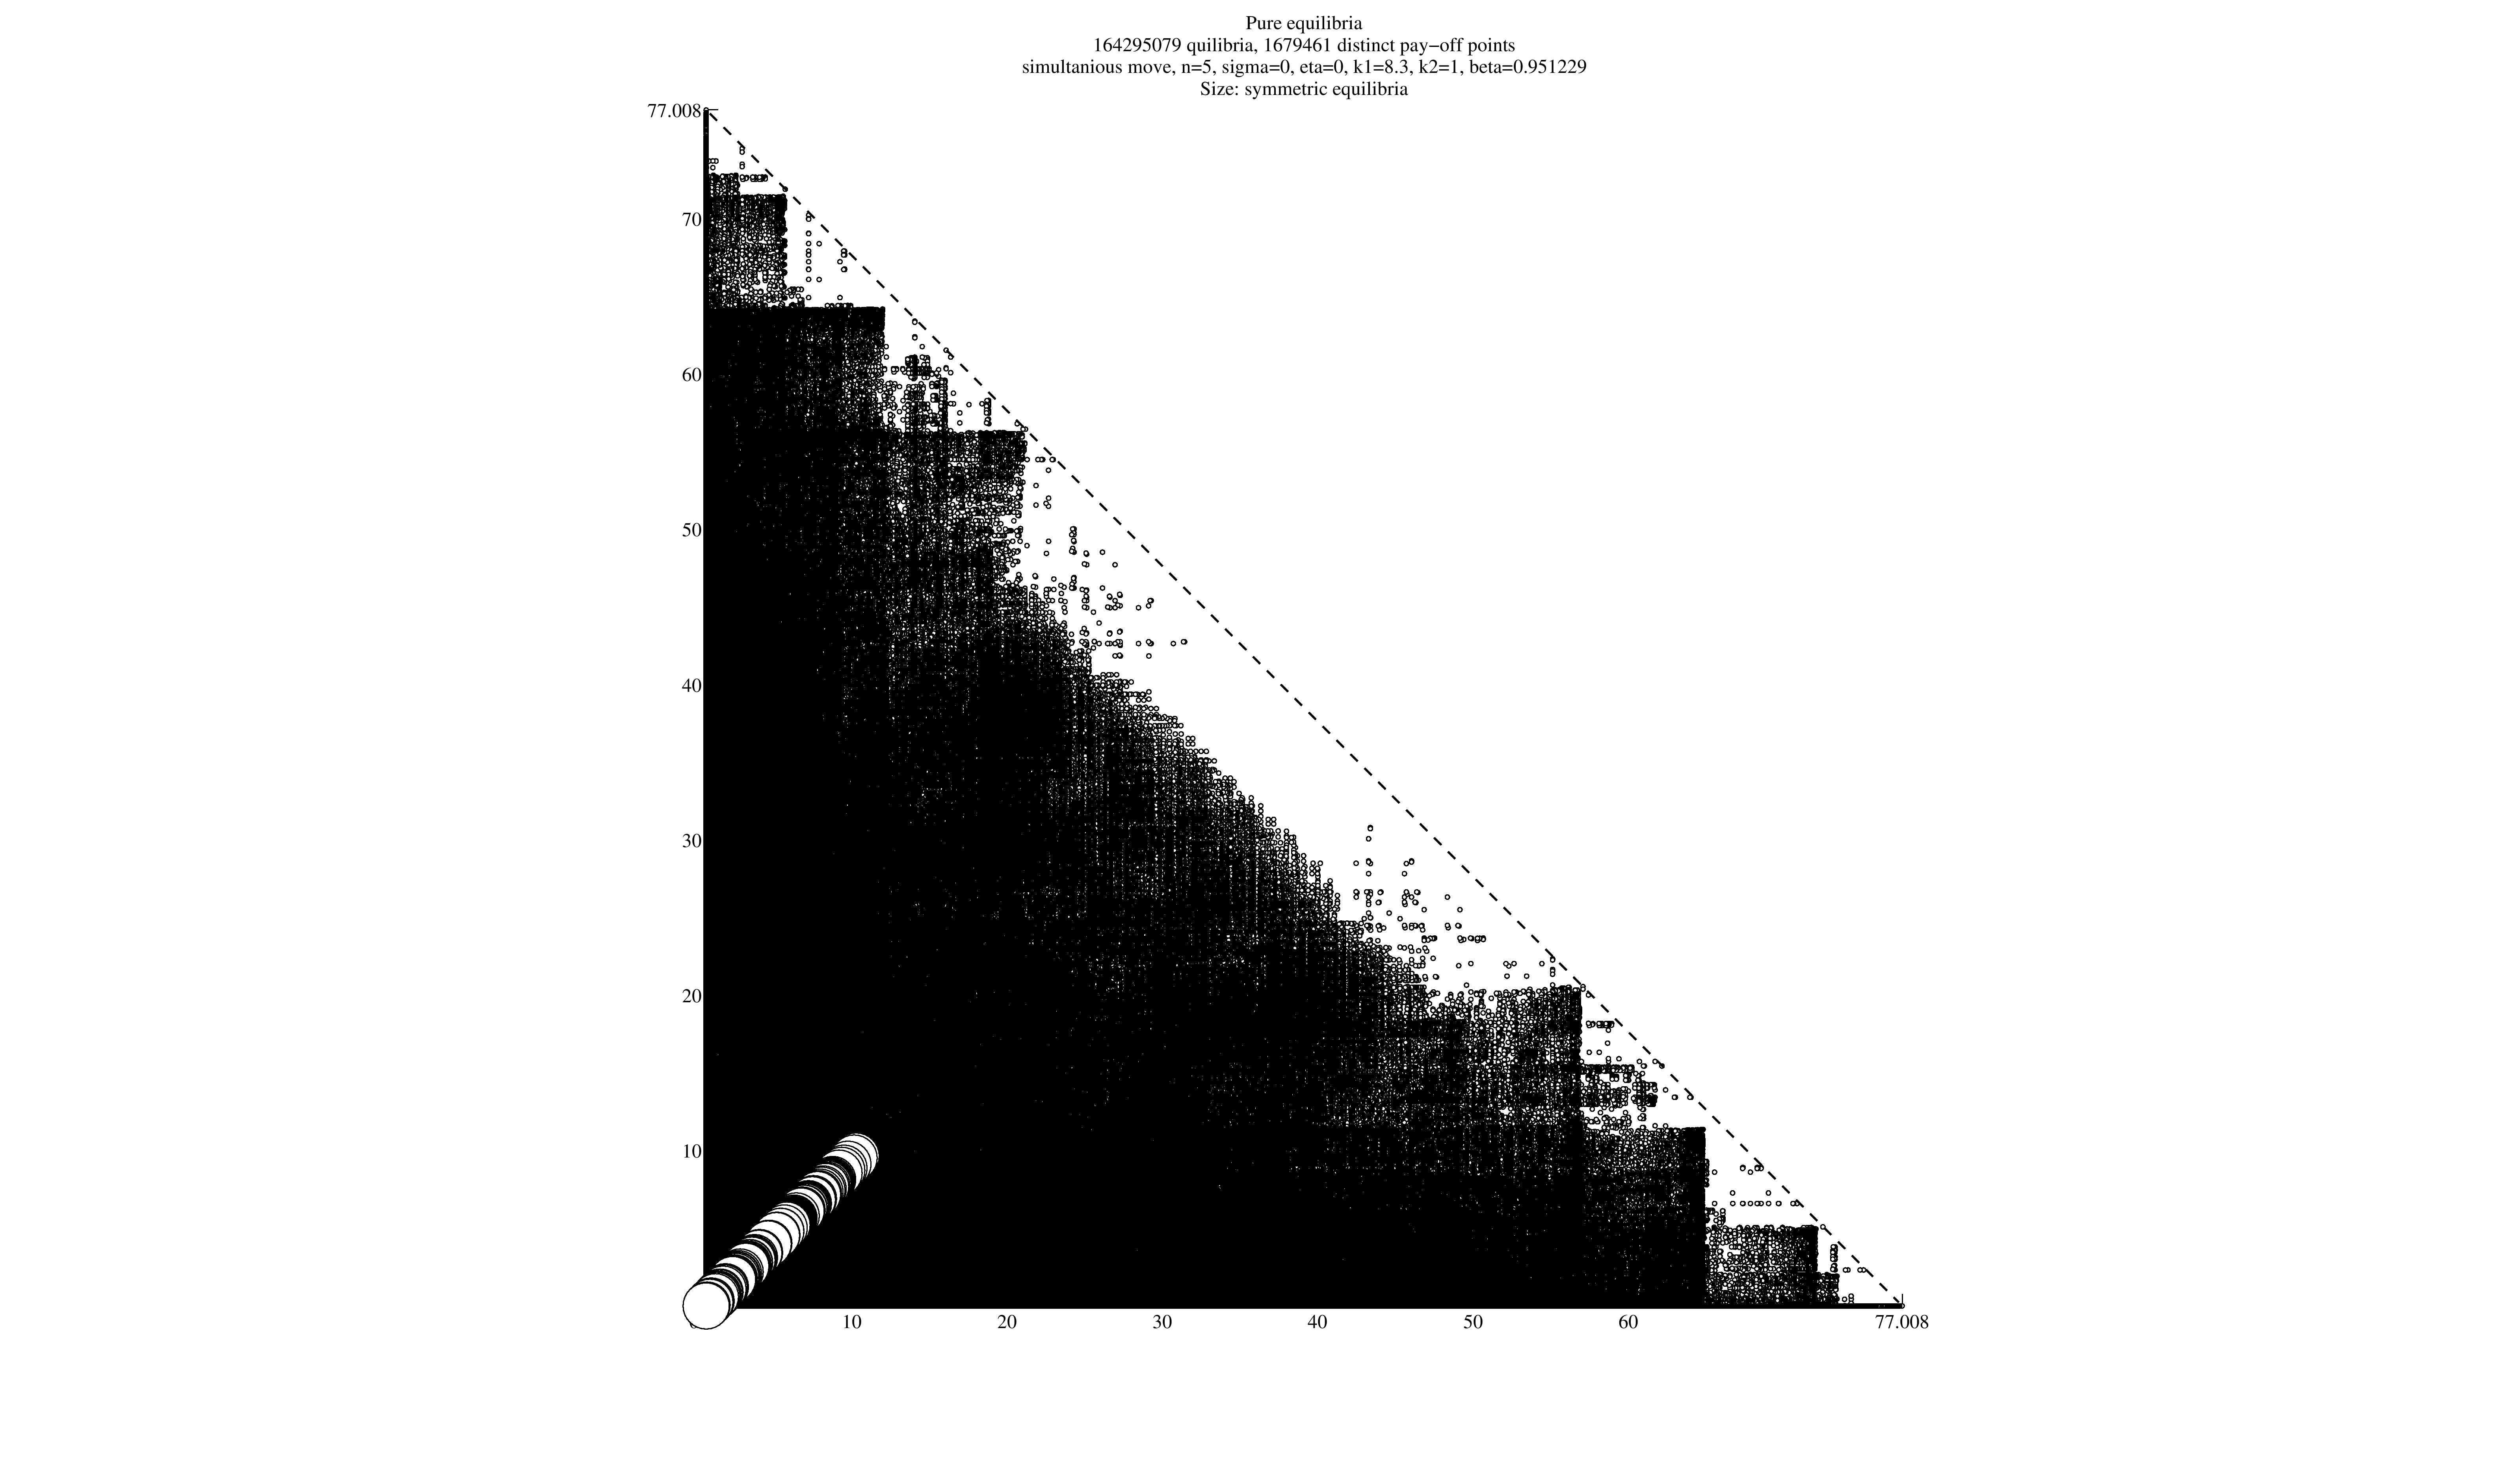
#  # #### Visualizing economic model for new insights
#
# #### Visualizing economic model for new insights
#  #
#  #
#  #
#  # ### Tutorials for compulsory self-study
#
# - Excellent tutorial on Matplotlib on QuantEcon DataScience
# [https://datascience.quantecon.org/applications/visualization_rules.html](https://datascience.quantecon.org/applications/visualization_rules.html)
# - Presentation by Hans Rosling (1948-2017, Swedish physician, academic, statistician, and public speaker)
# [https://youtu.be/hVimVzgtD6w?t=159](https://youtu.be/hVimVzgtD6w?t=159)
# ### Further learning resources
#
# - Excellent beginner tutorial for Matplotlib by the authors (3h)
# [https://www.youtube.com/watch?v=6gdNUDs6QPc&t=2843s](https://www.youtube.com/watch?v=6gdNUDs6QPc&t=2843s)
# - Playlist of lectures and tutorials
# [https://www.youtube.com/user/EnthoughtMedia/search?query=matplotlib](https://www.youtube.com/user/EnthoughtMedia/search?query=matplotlib)
# - Visualization of sorting algorithms
# [https://www.youtube.com/watch?v=kPRA0W1kECg](https://www.youtube.com/watch?v=kPRA0W1kECg)
# ### Tutorials for compulsory self-study
#
# - Excellent tutorial on Matplotlib on QuantEcon DataScience
# [https://datascience.quantecon.org/applications/visualization_rules.html](https://datascience.quantecon.org/applications/visualization_rules.html)
# - Presentation by Hans Rosling (1948-2017, Swedish physician, academic, statistician, and public speaker)
# [https://youtu.be/hVimVzgtD6w?t=159](https://youtu.be/hVimVzgtD6w?t=159)
# ### Further learning resources
#
# - Excellent beginner tutorial for Matplotlib by the authors (3h)
# [https://www.youtube.com/watch?v=6gdNUDs6QPc&t=2843s](https://www.youtube.com/watch?v=6gdNUDs6QPc&t=2843s)
# - Playlist of lectures and tutorials
# [https://www.youtube.com/user/EnthoughtMedia/search?query=matplotlib](https://www.youtube.com/user/EnthoughtMedia/search?query=matplotlib)
# - Visualization of sorting algorithms
# [https://www.youtube.com/watch?v=kPRA0W1kECg](https://www.youtube.com/watch?v=kPRA0W1kECg)