 MgAl2O4 MgAl2O4 |
#  Doping removes two Mgs+ and inserts one Li+ and one Al3+ Doping removes two Mgs+ and inserts one Li+ and one Al3+ |
#  Doped structure (x=0.25)(LixMg1−2xAl2+xO4) Doped structure (x=0.25)(LixMg1−2xAl2+xO4) |
#
 #
# Nodes can be considered connected or disconnected based on some user determined inter-nodal distance and occupying species criteria.
#
# Selecting only
#
# Nodes can be considered connected or disconnected based on some user determined inter-nodal distance and occupying species criteria.
#
# Selecting only  #
# we obtain a graph comprised of connected clusters that extends across the periodic crystal boundary:
#
#
#
# we obtain a graph comprised of connected clusters that extends across the periodic crystal boundary:
#
# 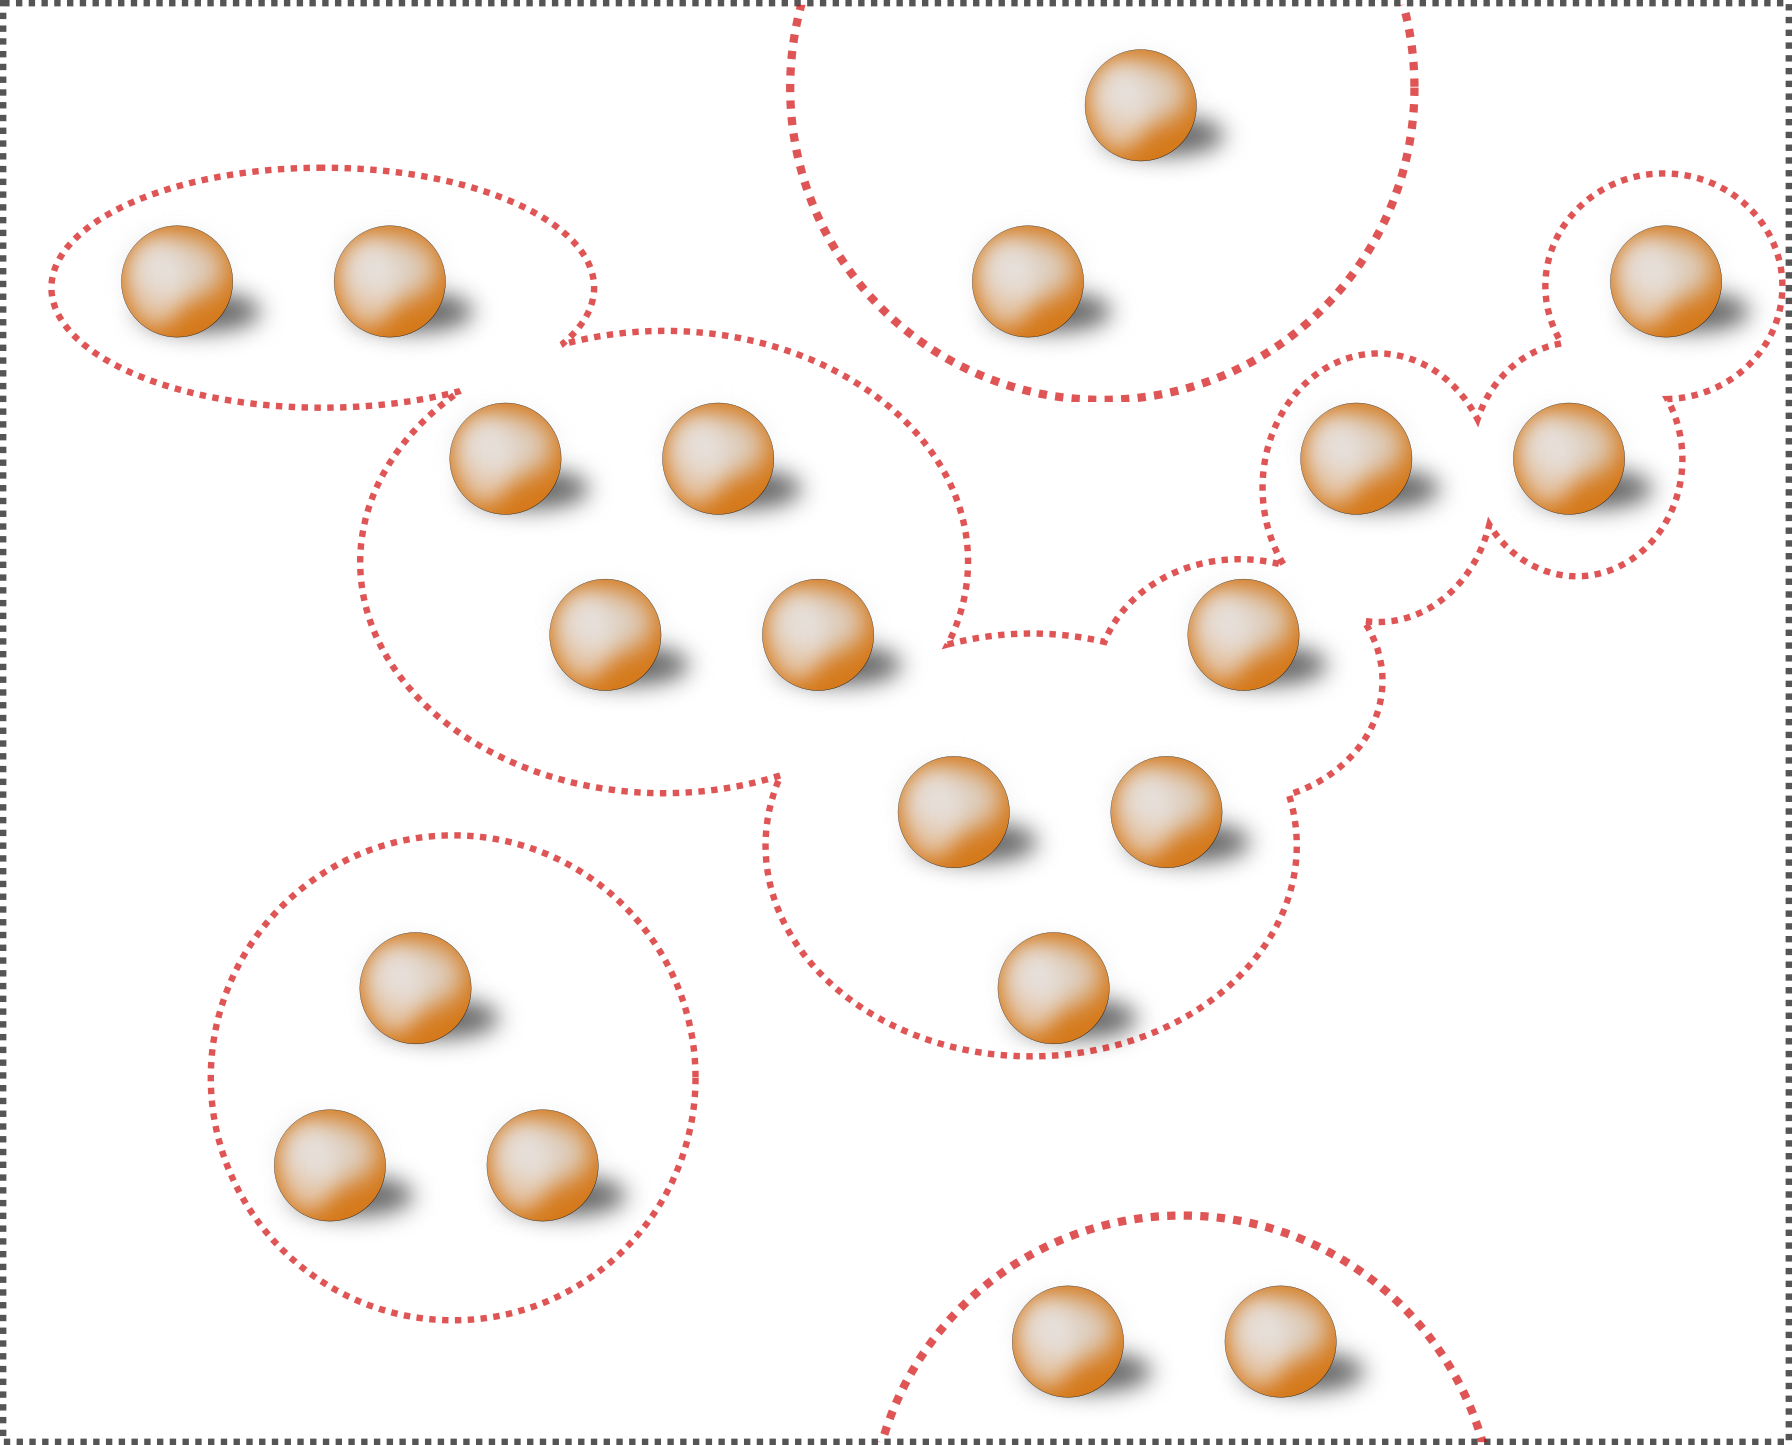 #
# Selecting only the periodic clusters:
#
#
#
# Selecting only the periodic clusters:
#
#  #
# We can select one node and calculate the minimum number of internodal steps to traverse the full crystal and return to a periodic nodal site:
#
#
#
# We can select one node and calculate the minimum number of internodal steps to traverse the full crystal and return to a periodic nodal site:
#
#  #
# This is what we define as the site tortuosity, τ. The relative site tortuosity therefore is the ratio of this value to the minimum pathway if all nodes were available to form the pathway.
#
# ### **Setting up a graph and torturing it**
#
# Using pymatgen we can set up a graph structure directly from a pymatgen compatible filetype (in this instance a POSCAR file). We have stipulated an internodal distance of 4.0 Å and selected only sites occupied by Li atoms as nodes:
# In[1]:
import sys
import time
sys.path.append('../crystal_torture')
from crystal_torture.pymatgen_interface import graph_from_file
graph = graph_from_file("POSCAR.vasp",4.0,["Li"])
# In[2]:
print(len(graph.clusters))
# We can list the indices of nodes within each cluster:
# In[3]:
for cluster in graph.clusters:
print("Cluster: (len) (indices in cluster))")
print( cluster.return_uc_indices())
# We can also list the periodicity of the clusters within the graph (i.e. whether the cluster traverses the entire unit cell in 1,2 or 3 dimensions):
# In[4]:
print([cluster.periodic for cluster in graph.clusters])
# We can print the fraction of nodes in the graph that are in a percolating (i.e. periodic) cluster:
# In[5]:
print('{} {}\n'.format("Frac Perc:",graph.return_frac_percolating()))
# We can torture the periodic clusters in the graph, meaning for each node in a cluster we can calculate the tortuosity of the minimum pathway from the node to any of its periodic images (i.e. the number of internodal steps to reach a periodic image). The ratio of this tortuosity to the minimum pathway is the relative site tortuosity.
#
# The algorithm performed is a breadth first search. Depending on system size, this algorithm can be computationally expensive and there are two ways of running it. There is a pure python version, which can be used for small systems:
#
# In[6]:
start_time = time.time()
graph.torture_py()
end_time = time.time()
print("Time:", end_time - start_time)
# Or a version that performs the search using Fortran90, coupled with OpenMP. The algorithm in this case is
# parallelised across nodes in the graph, calculating the tortuosity for each node in parallel, and therefore will perform the search much more quickly for large systems.
# In[7]:
graph = graph_from_file("POSCAR.vasp",4.0,["Li"])
time1=time.time()
start_time = time.time()
graph.torture()
end_time = time.time()
print("Time:", end_time - start_time)
# Following the tortuosity analysis we can see the average tortuosity for the nodes in a cluster:
# In[8]:
for no,cluster in enumerate(graph.minimal_clusters):
print('{}{}{}\n'.format("****** Cluster: ",no, " ********"))
print('{} {}\n'.format("Size:",cluster.size))
print('{} {}\n'.format("Tortuosity:",cluster.tortuosity))
print('{} {}\n'.format("Periodicity:",cluster.periodic))
# Or indeed exmaine the tortuosity of every node in a cluster:
# In[9]:
print(graph.tortuosity)
# It is also possible to output the clusters found to a filetype which can be viewed in a crystal structure viewer such as VMD or VESTA
# In[10]:
graph.output_clusters(fmt='poscar',periodic=False)
# ### **Worked example: Doping and torturing Spinel MgAl2O4**
#
# Taking the spinel structure, there are 56 ions in the conventional unit cell with stoichiometry (A2+)[B3+]O4+. In normal magnesium spinel (Mg)[Al2]O4, the Mg2+ reside on the (A) sites, Al3+ reside on the [B]-sites.
#
# Taking this spinel structured magnesium spinel we can co-dope with {Li-Al}, upon which pairs of Mg2+ cations are substituted in equal proportions by Li+ and Al3+, giving
# a composition of (AlxMg1-2xLix)[Al2]O4
#
#
#
# This is what we define as the site tortuosity, τ. The relative site tortuosity therefore is the ratio of this value to the minimum pathway if all nodes were available to form the pathway.
#
# ### **Setting up a graph and torturing it**
#
# Using pymatgen we can set up a graph structure directly from a pymatgen compatible filetype (in this instance a POSCAR file). We have stipulated an internodal distance of 4.0 Å and selected only sites occupied by Li atoms as nodes:
# In[1]:
import sys
import time
sys.path.append('../crystal_torture')
from crystal_torture.pymatgen_interface import graph_from_file
graph = graph_from_file("POSCAR.vasp",4.0,["Li"])
# In[2]:
print(len(graph.clusters))
# We can list the indices of nodes within each cluster:
# In[3]:
for cluster in graph.clusters:
print("Cluster: (len) (indices in cluster))")
print( cluster.return_uc_indices())
# We can also list the periodicity of the clusters within the graph (i.e. whether the cluster traverses the entire unit cell in 1,2 or 3 dimensions):
# In[4]:
print([cluster.periodic for cluster in graph.clusters])
# We can print the fraction of nodes in the graph that are in a percolating (i.e. periodic) cluster:
# In[5]:
print('{} {}\n'.format("Frac Perc:",graph.return_frac_percolating()))
# We can torture the periodic clusters in the graph, meaning for each node in a cluster we can calculate the tortuosity of the minimum pathway from the node to any of its periodic images (i.e. the number of internodal steps to reach a periodic image). The ratio of this tortuosity to the minimum pathway is the relative site tortuosity.
#
# The algorithm performed is a breadth first search. Depending on system size, this algorithm can be computationally expensive and there are two ways of running it. There is a pure python version, which can be used for small systems:
#
# In[6]:
start_time = time.time()
graph.torture_py()
end_time = time.time()
print("Time:", end_time - start_time)
# Or a version that performs the search using Fortran90, coupled with OpenMP. The algorithm in this case is
# parallelised across nodes in the graph, calculating the tortuosity for each node in parallel, and therefore will perform the search much more quickly for large systems.
# In[7]:
graph = graph_from_file("POSCAR.vasp",4.0,["Li"])
time1=time.time()
start_time = time.time()
graph.torture()
end_time = time.time()
print("Time:", end_time - start_time)
# Following the tortuosity analysis we can see the average tortuosity for the nodes in a cluster:
# In[8]:
for no,cluster in enumerate(graph.minimal_clusters):
print('{}{}{}\n'.format("****** Cluster: ",no, " ********"))
print('{} {}\n'.format("Size:",cluster.size))
print('{} {}\n'.format("Tortuosity:",cluster.tortuosity))
print('{} {}\n'.format("Periodicity:",cluster.periodic))
# Or indeed exmaine the tortuosity of every node in a cluster:
# In[9]:
print(graph.tortuosity)
# It is also possible to output the clusters found to a filetype which can be viewed in a crystal structure viewer such as VMD or VESTA
# In[10]:
graph.output_clusters(fmt='poscar',periodic=False)
# ### **Worked example: Doping and torturing Spinel MgAl2O4**
#
# Taking the spinel structure, there are 56 ions in the conventional unit cell with stoichiometry (A2+)[B3+]O4+. In normal magnesium spinel (Mg)[Al2]O4, the Mg2+ reside on the (A) sites, Al3+ reside on the [B]-sites.
#
# Taking this spinel structured magnesium spinel we can co-dope with {Li-Al}, upon which pairs of Mg2+ cations are substituted in equal proportions by Li+ and Al3+, giving
# a composition of (AlxMg1-2xLix)[Al2]O4
#
# | MgAl2O4 |
# Doping removes two Mgs+ and inserts one Li+ and one Al3+ |
# Doped structure (x=0.25)(LixMg1−2xAl2+xO4) |
#