Context:
According to NPR.org, "After 1980, only the top 1% saw their incomes rise." Flowing Data quoted this figure:

Another figure:
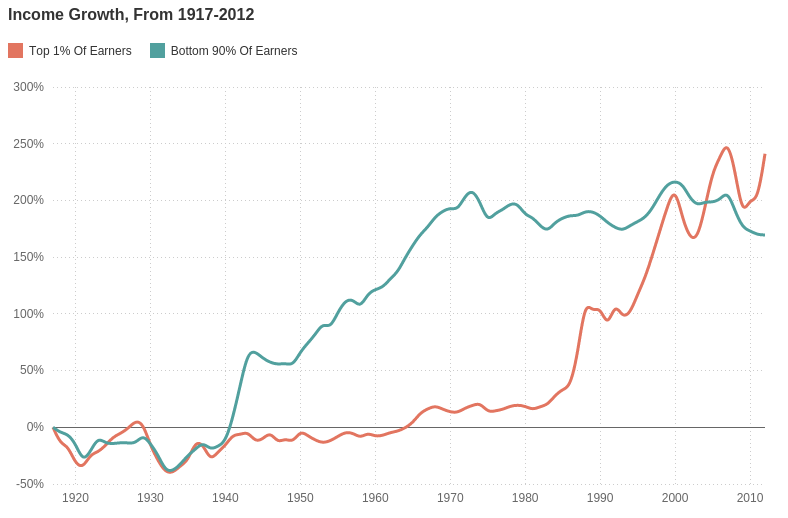
Their source came from World Top Incomes Database.
I decided to double-check it using a dataset from census.gov
In [43]:
%matplotlib inline
import pandas as pd
import seaborn as sns
sns.set(context="poster", style="dark")
import mpld3
import pylab as pl
In [57]:
# csv location = https://github.com/aflyax/Python/blob/master/income/income_2013_dollars.csv
income_df = pd.read_csv("income_2013_dollars.csv", sep='\t', thousands=',')
income_df.columns = ["year", "lowest fifth", "second fifth", "third fifth", "fourth fifth", "top fifth", "top 5%"]
income_df.sort(columns="year", inplace=True)
income_df.head()
Out[57]:
| year | lowest fifth | second fifth | third fifth | fourth fifth | top fifth | top 5% | |
|---|---|---|---|---|---|---|---|
| 47 | 1966 | 14747 | 32739 | 46844 | 62710 | 107026 | 164340 |
| 46 | 1967 | 14977 | 33490 | 48138 | 64560 | 113997 | 180362 |
| 45 | 1968 | 16143 | 35208 | 50300 | 67270 | 114947 | 177194 |
| 44 | 1969 | 16656 | 36783 | 52635 | 70510 | 120757 | 185476 |
| 43 | 1970 | 16404 | 36271 | 52445 | 70744 | 121652 | 185243 |
In [50]:
income_df.tail()
Out[50]:
| year | lowest fifth | second fifth | third fifth | fourth fifth | top fifth | top 5% | |
|---|---|---|---|---|---|---|---|
| 4 | 2009 | 16604 | 40232 | 65061 | 98788 | 205788 | 352985 |
| 3 | 2010 | 15944 | 39436 | 64276 | 98064 | 199918 | 334275 |
| 2 | 2011 | 15828 | 38898 | 63212 | 96563 | 205003 | 356839 |
| 1 | 2012 | 15760 | 38739 | 63372 | 96861 | 205503 | 357458 |
| 0 | 2013 | 16109 | 39514 | 63916 | 97207 | 206687 | 358722 |
In [60]:
ax = income_df.plot(x="year")
ax.set_ylabel("income")
ax.set_xlabel("year")
print("feel free to interact with the graph:")
fig = pl.gcf()
mpld3.display()
feel free to interact with the graph:
Out[60]:
In [62]:
mpld3.save_html(fig, "fig.html")
In [84]:
income_df[income_df.year.isin([1970, 2000, 2013])]
Out[84]:
| year | lowest fifth | second fifth | third fifth | fourth fifth | top fifth | top 5% | |
|---|---|---|---|---|---|---|---|
| 43 | 1970 | 16404 | 36271 | 52445 | 70744 | 121652 | 185243 |
| 13 | 2000 | 19103 | 43678 | 68646 | 101170 | 212266 | 376138 |
| 0 | 2013 | 16109 | 39514 | 63916 | 97207 | 206687 | 358722 |
Slightly different story from "after 1980, only the top 1% saw their incomes rise".
This is all beside the point that neither NPR's nor the above graph show mobility. I.e., the same person in 1970 and today is unlikely to belong to the same "income class".