Exercise 4
Plotting IMDB
We will make one last visit to the IMDB data. This time, you will get to explore the data by plotting graphs. Pandas will do the parsing for you!
The questions to answer are:
- Are movies getting better or worse? That is, how do the movies' rating relate to the the year they were produced?
- What rating does most movies have - how many good movies are there?
We will use two types of plots: scatter and histogram.
Getting started - reading the data
As you might have thought when parsing the IMDB data yourself, getting it right is not that easy. Pandas agree, it's much more complicated than reading the Orange tree data. But let's just start by making a try:
import pandas
movies = pandas.read_table('../../downloads/250.imdb', index_col=0)
movies.head()  # use .head() to print only the first part of the table
Run the commands above and take a look at the result. Try to figure out what went wrong!
First of all, the lines are not split at the |, like they should be. To fix it, use the keyword argument sep:
movies = pandas.read_table('../../downloads/250.imdb', sep='|', index_col=0)
movies.head()
Better! But what about the index column..? It looks like the #Votes is what identifies a movie. What would be a better identifier for a movie?
I would go for Title; each movie has a title, and two movies are not supposed to have the same title.
movies = pandas.read_table('../../downloads/250.imdb', sep='|', index_col=6)
movies.head()
You could also tell Pandas to create its own indexing for the movies. For instance, if you suspect that there are one movie with the same title. To do this, just leave out the index_col:
movies = pandas.read_table('../../downloads/250.imdb', sep='|')
movies.head()
Now it looks like we're getting somewhere! But the columns does not look quite right. Take a look yourself.
movies.columns
There are too many whitespaces! Having whitespaces in the columnames will make it much harder for you to work with the data, since it's very easy to miss them or to forget about them. That might give you annoying errors, like:
movies.Rating # no whitespaces
movies[' Rating'] # forgetting the last whitespace
Pandas did not manage to get this right for us, so here's one way of fixing this issue:
movies.columns = movies.columns.str.strip(' #')  # Remove '#' and whitespaces
# ... and try it:
movies.columns
Here's the complete code for parsing the data:
import pandas
movies = pandas.read_table('../../downloads/250.imdb', sep='|', index_col=6)
movies.columns = movies.columns.str.strip(' #')
movies.head()
Plotting
First, a note on plotting. If your plots don't show up, try the following:
- if using a notebook, run:
%pylab inline
- if using the Python interpretor, use this:
import matplotlib.pyplot as plt

# ... code to generate the plots ...

plt.show()
1. Are movies getting better or worse?
To solve this, we will use a scatter plot. Our dataframe is called movies.
To create one, just change kind to scatter:
movies.plot(x=..., y=..., kind='scatter',fontsize=14, figsize=(12,10))
What to put on the x and y axis? Take a moment and see if you can figure it out.
We want the x axis to represent the time, so we set x to 'Year'.
The y axis should represent how good a movie is, so let's use the rating:
movies.plot(x='Year', y='Rating', kind='scatter',fontsize=14, figsize=(12,10))
You've got a graph! Have a look at it and decide for yourself whether movies seem to be getting better or not.
2. What rating does most movies have? How many good movies are there?
Now we're interested in the rating, and specifically the frequency of each rating. Let's use a historgram for this. A histogram looks like this, with the frequency of a given column shown on the y axis:
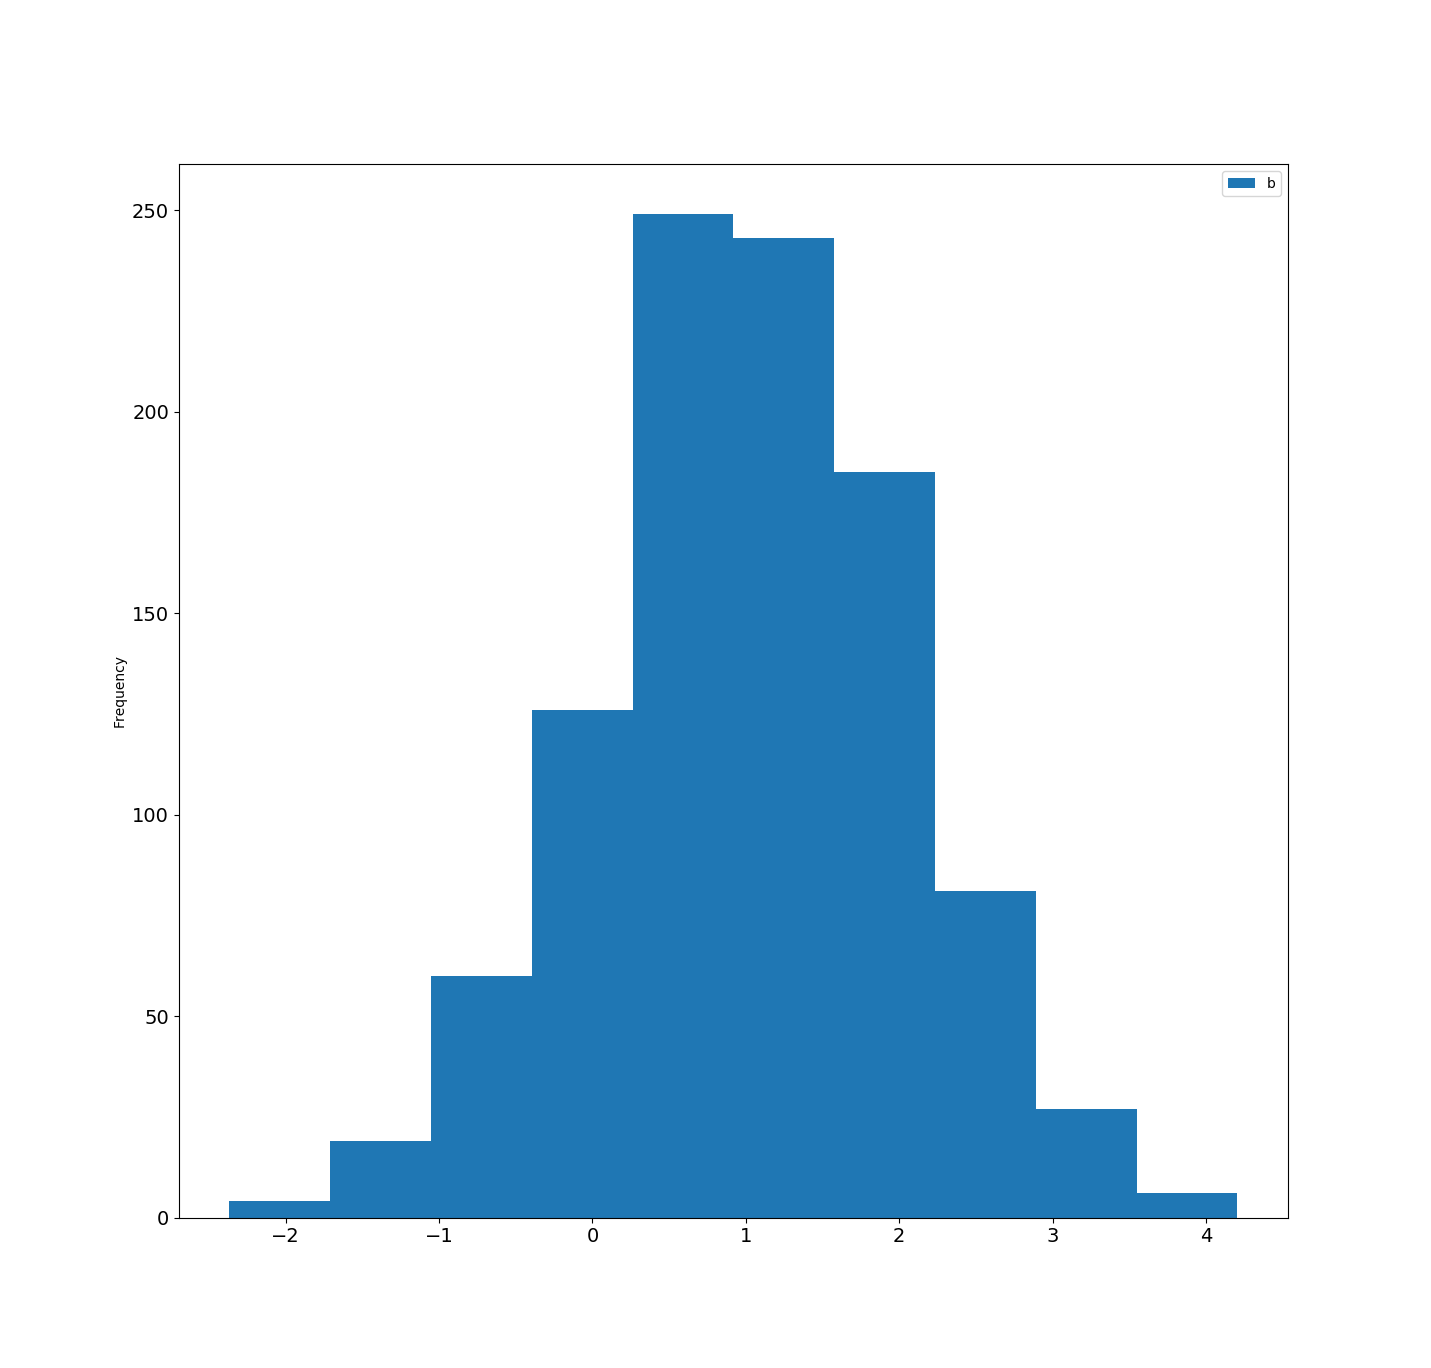
This histogram tells us that values around 1 is more frequent than the value 4 or -2.
Making a histogram is not more diffult than changing the kind to hist.
movies.plot(kind='hist', y=...)
Notice that were skipping the x axis here. Histograms usually show the frequency on one axis, so it only needs you to specify one axis. It will ignore what you put as x value, just give it the y!
Try to plot a historgram of the rating of the movies.
movies.plot(kind='hist', y='Rating')
You did it! That's all! Spend a minute or two looking at your graphs. Also feel free to play around with them. If you want to plot more, some ideas are given below. If you have had enough, take a break and prepare for the course project.
3. Want more?
- Find out if people vote more for good movies or not. How does the number of votes correlate with the rating?
- Which years were most movies produced?
There are plenty of other tutorials online, here are a few:
https://www.youtube.com/playlist?list=PLQVvvaa0QuDc-3szzjeP6N6b0aDrrKyL- A nice youtube tutorial series
https://swcarpentry.github.io/python-intermediate-mosquitoes/01-intro-python.html
https://www.tutorialspoint.com/python_pandas/python_pandas_visualization.htm (The visualization section of the tutorial above)