Detecting novel anomalies in Twitter
Delia Rusu and Mattia Boni Sforza
PyData London 2016
About Us
Knowsis
Knowsis is a social-intelligence company providing social media analytics for finance.

Knowsis
Topics of research:
- named entity recognition, disambiguation and linking
- event detection
- sentiment analysis
- social network analysis
- anomaly detection
- novelty detection
System which promptly flags the user when there is a novel anomaly in social activity
- Novel?
- Not previously encountered
- Novel Anomaly?
- Something that deviates from what is standard, normal, or expected
- Novel Anomaly in social activity?
- Unexpected amount of tweets in short time which creates a spike in tweets volume
Novel anomalies detection pipeline

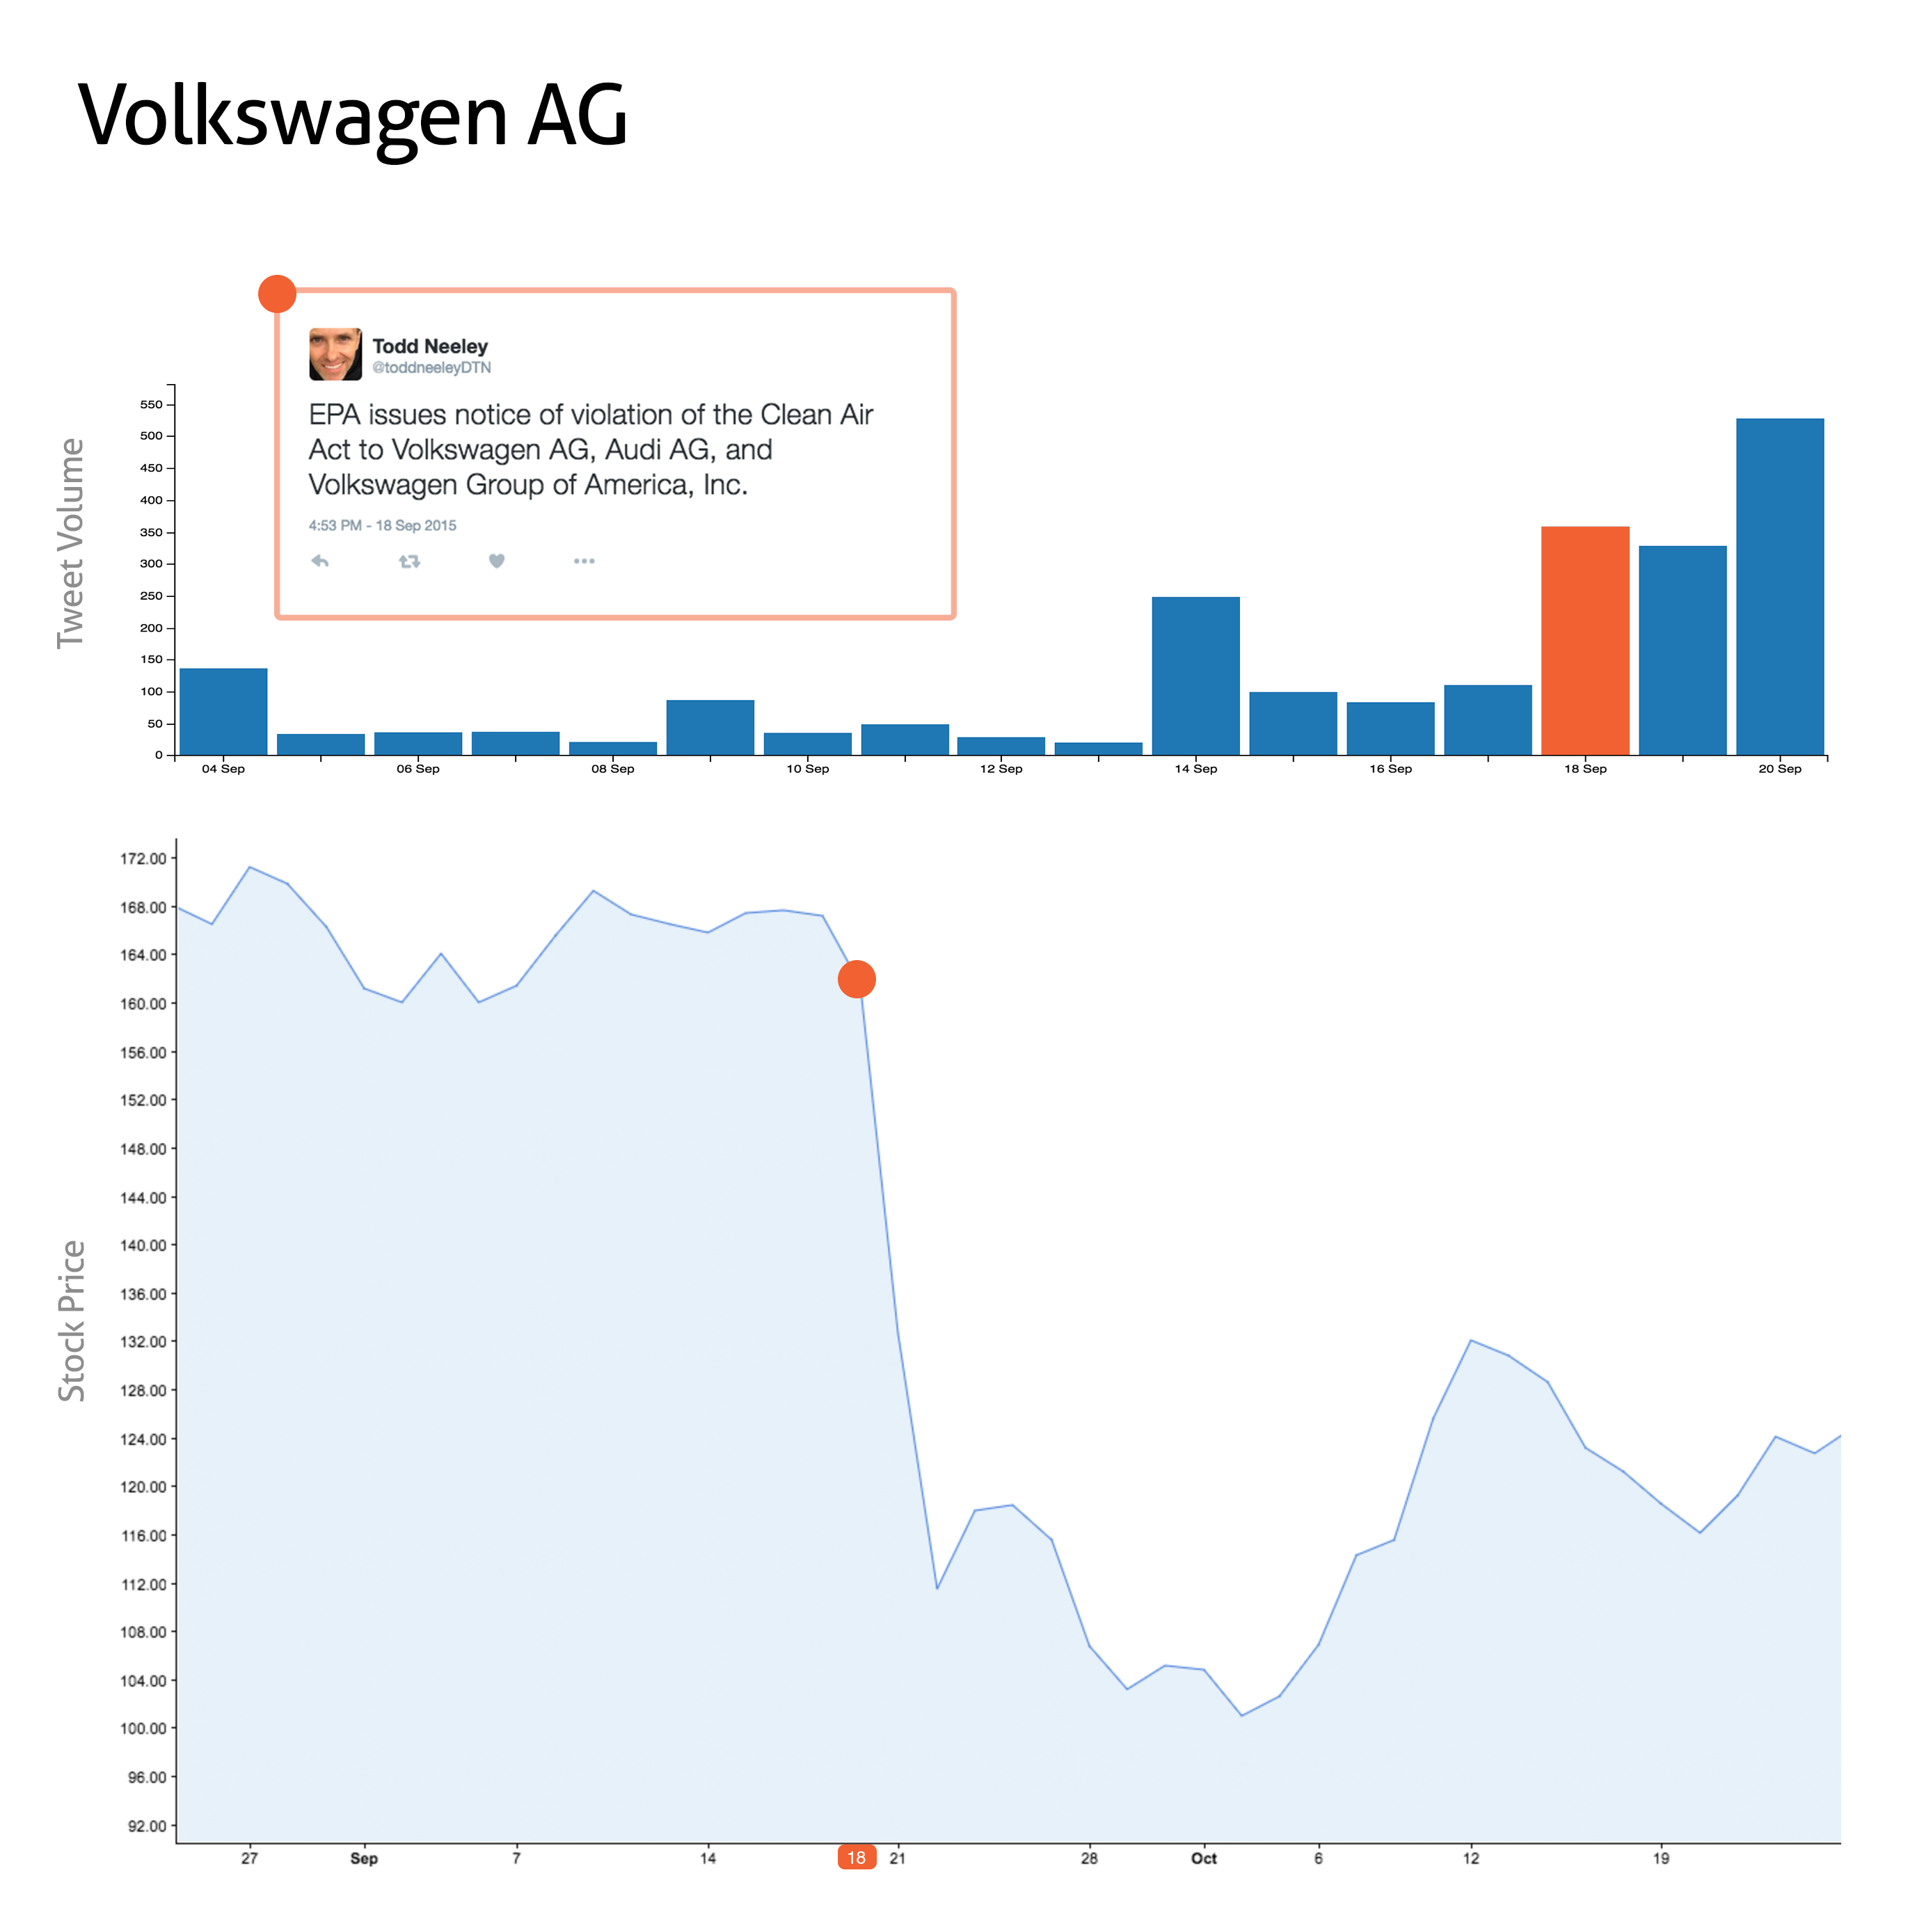
from IPython.core.display import Image, display
display(Image('images/VW_chart.jpg', unconfined=True))

What you need
- Define a variable to measure
- what is the main characteristic that makes the data anomalous?
- Establish if the observed variable is unexpected
- how to quantify the unexpected nature of this quantity?
Approach
- Variable to measure is the count of tweets given a fixed time window (aka rate)
- Consists of two steps:
- Predict the tweets count given some predictor variables (characteristics of the data known in advance)
- Use the prediction to establish how (un)likely it is to observe such a tweets volume
Model the tweets rate
- Static volume
- Dinamic amount to account for seasonality
- Include short time memory to only detect spikes

Natural way to model counts of events happening in time is to use a Poisson process $N(t)$ with parameter $\lambda$, the rate at which the events happen
$$ \mathbb{E}[N(t)] = \textbf{expected number of events occurred until time } t = \lambda t$$A Poisson regression models the logarithm of the expected number of events as a linear combination of predictor variables
$$ \log(\mathbb{E}[N]) = log(\lambda) = \beta_1 x_1 + \beta_2 x_2 + \dots + \beta_k x_k $$with $\beta_i$ coefficients of the model estimated based on volume history and $x_i$ observable quantities of the datapoint.
Predictor variables for $\lambda$
Consider seasonality at different scales
- day of the week $x_w$
- hour of the day $x_h$
- month (?)
- ...
Consider recent behaviour
- count in the previous time window $x_{t-1}$
- count 2 time windows before $x_{t-2}$
- ...
- count for the day so far or yesterday (?)
Other variables?
- ...
Detect the anomaly
With the expected rate $\lambda_{pred}$, how (un)likely is that we see a number of tweets $N$ higher than the one we have so far?
If this event has probability lower than $\alpha$, it is anomalous!
$$\mathbb{P}(N \geq n_{obs} | \lambda_{pred}) < \alpha$$Pros
- timely (predict in advance)
- unsupervised (no need for annotations)
- easily adapt to different time scales
- easy to extend and include more predictors
- applicable to discrete data of different nature
- Generalised Linear Model applicable to different distribution families
...and Cons
- needs other algorithms to determine if the anomaly is geneuine (spam driven, somehow expected, ...)
- higly sensitive (try Zero inflated Poisson)
- variance and expected value are the same (try Negative Binomial)
Novelty Detection
Given an anomaly period, identify which tweets are novel
Observation: tweets tend to cluster in stories
Given an anomaly period, identify the tweets which are novel not part of old stories
VW Example

Challenges
- streaming setting - each tweet needs to be processed in bounded space and time
- bounded space - constant amount of stories in memory
- bounded time - Locality Sensitive Hashing (Indyk and Motwani, 1998)
- how much history is required to decide if a tweet is novel
- stories can be reoccurring
First Story Detection

Locality Sensitive Hashing
- approximate nearest neighbor task
- hashing each tweet into buckets to maximize the probability of collision for tweets which are close
- requires a measure of distance for tweets
Advantage:
- LSH works well if tweet is close to its nearest neighbor
Disadvantage:
- LSH fails to return the nearest neighbor for distant tweets
- Solution: if the LSH doesn't return a neighbor, check novelty against most recent tweets
Novelty Flow

Conclusions
general anomaly detection algorithm which is:
- applicable to different problems
- easily understandable
- fast training and detection
- works well in a streaming pipeline
two-step novelty detection
- fast lookup using LSH
- additional lookup in inverted index for the most recent tweets
Thank You!
Presentation & Notebooks:
https://github.com/knowsis/novel-twitter-anomalies-pydatalondon2016/