#!/usr/bin/env python
# coding: utf-8
# # Chapter7
# D3.js in Actionの7章の勉強ノートです。
#
# 最初にきちんと保存できるようにHTMLとd3.v3.min.jsをセットします。
#
# これまで、d3.v3.min.jsを以下のようにロードしていましたが、nvd3のinitialize_javascriptでこれが不要になりました。
#
# ただし、kernelはPython2を使用するため、sageは%load_extでロードします。
#
# ``` html
#
# ```
# In[14]:
get_ipython().run_line_magic('load_ext', 'sage')
from IPython.core.display import HTML
from string import Template
import json
import nvd3
nvd3.ipynb.initialize_javascript(use_remote=True)
# 地図データをjupyterで表示することがD3を勉強し始めた契機でした。
#
# 3章まで基本を勉強したので、ちょっと飛んで7章を試してみます。
# In[2]:
get_ipython().run_cell_magic('writefile', 'css/ch7.css', 'path.countries {\n stroke-width: 1;\n stroke: black;\n opacity: .5;\n fill: red;\n}\ncircle.cities {\n stroke-width: 1;\n stroke: white;\n fill: black;\n}\ncircle.centroid {\n fill: red;\n pointer-events: none;\n}\nrect.bbox {\n fill: none;\n stroke-dasharray: 5 5;\n stroke: black;\n stroke-width: 2;\n pointer-events: none;\n}\npath.graticule {\n fill: none;\n stroke-width: 1;\n stroke: black;\n}\npath.graticule.outline {\n stroke: black;\n}\n')
# In[3]:
get_ipython().run_cell_magic('writefile', 'js/ex7-1.js', 'd3.json("js/world.geojson", createMap);\n\nfunction createMap(countries) {\n var width = 350;\n var height = 350;\n var aProjection = d3.geo.mercator()\n .scale(80)\n .translate([width / 2, height / 2]);\n var geoPath = d3.geo.path().projection(aProjection);\n d3.select(\'#ex1\').select("svg").selectAll("path").data(countries.features)\n .enter()\n .append("path")\n .attr("d", geoPath)\n .attr("class", "countries")\n}\n')
# In[4]:
get_ipython().run_cell_magic('HTML', '', '\n\n\n\n\n')
# jupyterでqueueを使おうとするとエラーになってしまうので、queueを使わないで、citeisを表示してみます。
# In[5]:
get_ipython().run_cell_magic('writefile', 'js/ex7-2.js', 'd3.json("js/world.geojson", createMap);\n\nvar width = 350;\nvar height = 350;\nvar aProjection = d3.geo.mollweide()\n .scale(120)\n .rotate([-136, 0])\n .center([0, 38])\n .translate([width / 2, height / 2]);\n\nfunction createMap(countries) {\n var geoPath = d3.geo.path().projection(aProjection);\n var featureSize = d3.extent(countries.features,\n function(d) {return geoPath.area(d);}); \n var countryColor = d3.scale.quantize()\n .domain(featureSize).range(colorbrewer.Reds[7]);\n \n d3.select(\'#ex2\').select("svg").selectAll("path").data(countries.features)\n .enter()\n .append("path")\n .attr("d", geoPath)\n .attr("class", "countries")\n .style("fill", function(d) {\n return countryColor(geoPath.area(d))\n });\n}\n\nd3.csv("data/cities.csv",function(error,data) {createCities(data)});\n\nfunction createCities(cities) {\n d3.select(\'#ex2\').select("svg").selectAll("circle").data(cities)\n .enter()\n .append("circle")\n .attr("class", "cities")\n .attr("r", 3)\n .attr("cx", function(d) { return aProjection([d.y, d.x])[0]})\n .attr("cy", function(d) { return aProjection([d.y, d.x])[1]});\n \n}\n')
# In[6]:
get_ipython().run_cell_magic('HTML', '', '\n\n\n\n\n\n\n\n')
# ## タイルの利用
# タイルを使うと、地図の他に衛星写真やタイルに変換された地図情報を地図に重ね合わせて表示することができます。
# In[7]:
get_ipython().run_cell_magic('writefile', 'js/ex7-3.js', 'var width = 500, height = 500;\nvar takaokaBoundingBox = {geometry: {coordinates: [[[136.904778, 36.822525], [137.072662, 36.822525], [137.072662, 36.658552], [136.904778, 36.658552], [136.904778, 36.822525]]], type: "Polygon"}, id: 999999, properties:{}, type: "Feature"};\n\nd3.select("#ex3").select("svg").append("g").attr("id", "tiles");\nd3.select("#ex3").select("svg").append("g").attr("id", "vectors");\n\nvar tile = d3.geo.tile()\n .size([width, height]);\n\nvar projection = d3.geo.mercator()\n .scale((1 << 19) / 2 / Math.PI)\n .translate([width / 2, height / 2]);\n\nvar center = projection([137.025970, 36.754062]);\n\nvar path = d3.geo.path()\n .projection(projection);\nvar zoom = d3.behavior.zoom()\n .scale(projection.scale() * 2 * Math.PI)\n .translate([width - center[0], height - center[1]])\n .on("zoom", redraw);\nd3.select("#ex3").select("svg").call(zoom);\nprojection\n .scale(1 / 2 / Math.PI)\n .translate([0, 0]);\n\n\nvar geoPath = d3.geo.path().projection(projection);\nd3.select("#ex3").select("#vectors").selectAll("path.countries").data([takaokaBoundingBox])\n .enter()\n .append("path")\n .attr("d", geoPath)\n .attr("class", "countries")\n .style("fill", "red")\n .style("stroke-width", 3)\n .style("stroke", "black")\n .style("fill-opacity", .25)\n\nredraw();\n\nfunction redraw() {\n var tiles = tile\n .scale(zoom.scale())\n .translate(zoom.translate())();\n \n var image = d3.select("#ex3").select("#tiles")\n .attr("transform",\n "scale(" + tiles.scale + ") translate(" + tiles.translate + ")")\n .selectAll("image")\n .data(tiles, function(d) { return d; });\n \n image.exit()\n .remove();\n\n image.enter().append("image")\n .attr("xlink:href",\n function(d) { return "http://" \n + ["a", "b", "c"][Math.random() * 3 | 0] \n + ".tile.openstreetmap.org/" + d[2] + "/" + d[0] + "/" + d[1] \n + ".png"; }) \n .attr("width", 1)\n .attr("height", 1)\n .attr("x", function(d) { return d[0]; })\n .attr("y", function(d) { return d[1]; });\n \n projection\n .scale(zoom.scale() / 2 / Math.PI)\n .translate(zoom.translate());\n\n d3.select("#ex3").selectAll("path")\n .attr("d", geoPath);\n}\n')
# In[8]:
get_ipython().run_cell_magic('HTML', '', '\n\n\n\n\n\n\n\n\n\n')
# ### shpファイルからgeojsonを作成
#
# gdal-binをインストール
# ```bash
# $ sudo apt-get install -y gdal-bin
# ```
#
# In[9]:
get_ipython().run_cell_magic('bash', '', '# rm -f data/A27-10_16-g_SchoolDistrict.json\nogr2ogr -f geoJSON data/A27-10_16-g_SchoolDistrict.json data/A27-10_16-g_SchoolDistrict.shp\n')
# In[10]:
get_ipython().run_cell_magic('writefile', 'js/ex7-4.js', 'var width = 500, height = 500;\nvar takaokaBoundingBox = {geometry: {coordinates: [[[136.904778, 36.822525], [137.072662, 36.822525], [137.072662, 36.658552], [136.904778, 36.658552], [136.904778, 36.822525]]], type: "Polygon"}, id: 999999, properties:{}, type: "Feature"};\n\nd3.select("#ex4").select("svg").append("g").attr("id", "tiles");\nd3.select("#ex4").select("svg").append("g").attr("id", "vectors");\n\nvar tile = d3.geo.tile()\n .size([width, height]);\n\nvar projection = d3.geo.mercator()\n .scale((1 << 19) / 2 / Math.PI)\n .translate([width / 2, height / 2]);\n\nvar center = projection([137.025970, 36.754062]);\n\nvar path = d3.geo.path()\n .projection(projection);\nvar zoom = d3.behavior.zoom()\n .scale(projection.scale() * 2 * Math.PI)\n .translate([width - center[0], height - center[1]])\n .on("zoom", redraw);\nd3.select("#ex4").select("svg").call(zoom);\nprojection\n .scale(1 / 2 / Math.PI)\n .translate([0, 0]);\n\nvar geoPath = d3.geo.path().projection(projection);\n\nd3.json(\'data/A27-10_16-g_SchoolDistrict.json\', function (schoolDistnct) {\n // console.log(schoolDistnct);\n\n var data = schoolDistnct.features.filter(function(d) { \n return d.properties.A27_006=="高岡市立"; \n });\n\n d3.select("#ex4").select("#vectors").selectAll("path.countries").data(data)\n .enter()\n .append("path")\n .attr("d", geoPath)\n .attr("class", "countries")\n .style("fill", "red")\n .style("stroke-width", 3)\n .style("stroke", "black")\n .style("fill-opacity", .25) \n \n}); \n\nredraw();\n\nfunction redraw() {\n var tiles = tile\n .scale(zoom.scale())\n .translate(zoom.translate())();\n \n var image = d3.select("#ex4").select("#tiles")\n .attr("transform",\n "scale(" + tiles.scale + ") translate(" + tiles.translate + ")")\n .selectAll("image")\n .data(tiles, function(d) { return d; });\n \n image.exit()\n .remove();\n\n image.enter().append("image")\n .attr("xlink:href",\n function(d) { return "http://" \n + ["a", "b", "c"][Math.random() * 3 | 0] \n + ".tile.openstreetmap.org/" + d[2] + "/" + d[0] + "/" + d[1] \n + ".png"; }) \n .attr("width", 1)\n .attr("height", 1)\n .attr("x", function(d) { return d[0]; })\n .attr("y", function(d) { return d[1]; });\n \n projection\n .scale(zoom.scale() / 2 / Math.PI)\n .translate(zoom.translate());\n\n d3.select("#ex4").selectAll("path")\n .attr("d", geoPath);\n}\n')
# In[11]:
get_ipython().run_cell_magic('HTML', '', '\n\n\n\n\n\n\n\n\n')
# geojsonのデータは、以下の図のように各gの__data__属性に保持されています。
# 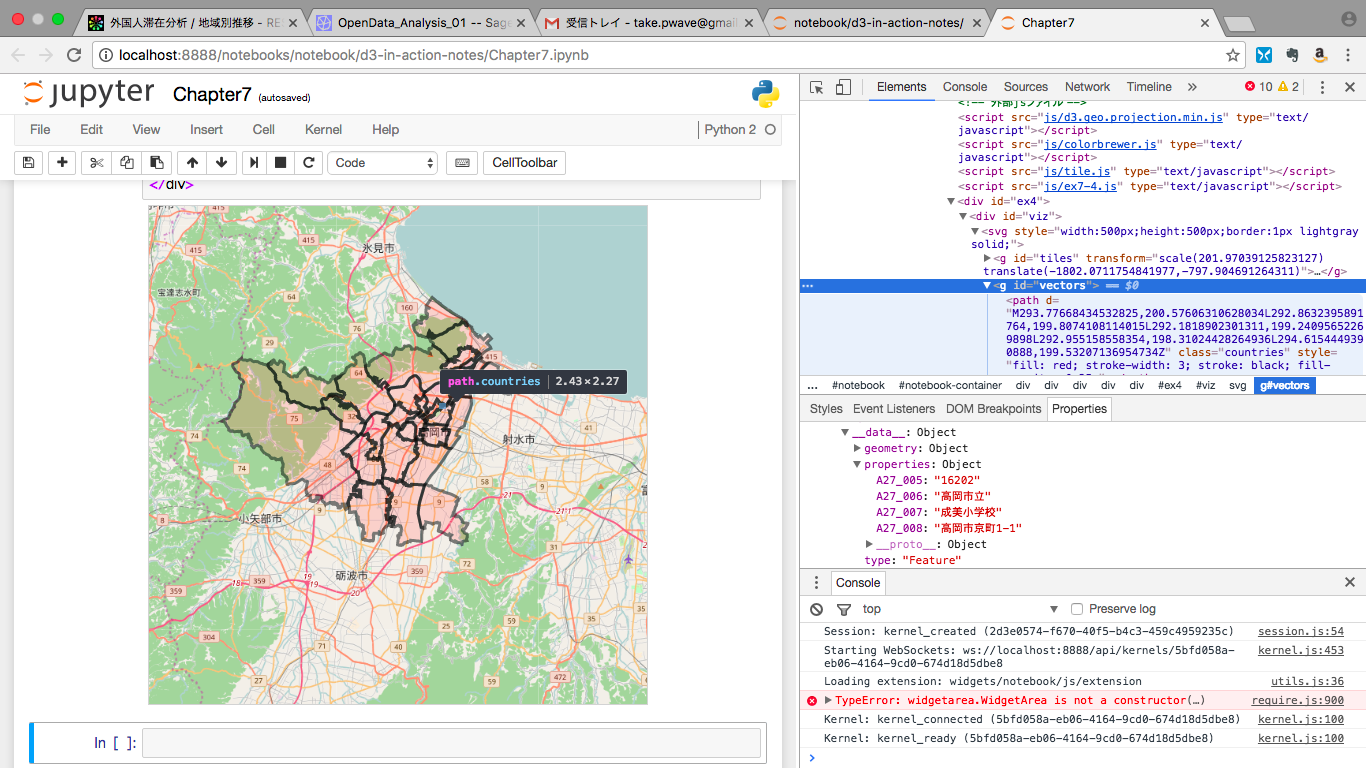 # In[ ]: